

Stocks up 65% of the past 20 trading days, highest since Nov 2021, and a reason it is starting to "feel like a bull market." We expect 1Q23 EPS to exceed expectations, likely 2H23 trough in EPS = supporting strengthening breadth.

The S&P 500 is up 8% YTD (~+20% in the past 6 months) and at this pace, is annualizing returns of ~30% — that is not our forecast. And as we highlighted earlier this year, the “rule of 1st 5 days” (neg prior year and >1.4% gain in 1st 5 days) implies ~20% gain for 2023.
- But despite these fairly impressive gains, this does not “feel” like a bull market for investors. There are several reasons for this including (but not all): (i) Fed is tightening and has stated that it intends to keep hiking (even as bonds call opposite); (ii) EPS estimates are down and YoY is negative (nadir in 2H23) and (iii) the stock market just doesn’t feel consistently rising — last Friday’s reversal is an example.
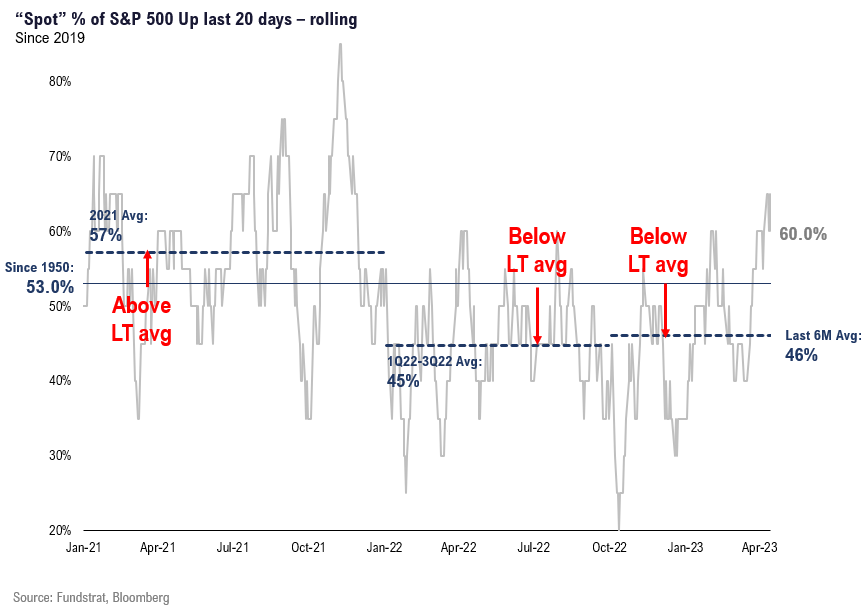
- The stock market is beginning to “feel like a bull market” as the % of up days (of the past 20) reached 65% last week — the highest figure since Nov 2021. For the 15 month period from Dec 2021 to March 2023, this figure never exceeded 60% and was a crushing mere 20% on Oct 12, 2022. That date of that 20% reading is also the date of the recorded low.
- The first chart of this note shows this ratio curled up sharply and we believe will soon reach 70% in coming weeks, aided by what we expect to be better than expected 1Q2023 EPS results. And as such, the rise in equities will soon “feel like a bull market.”
- The 6 month average for this is only 46%, which is below the 53% LT average. Thus, this explains why stocks have risen 20% in that timeframe, but this feels like a bear market to investors. Stocks in the past 6 months have not risen with sufficient frequency to feel like a bull market.
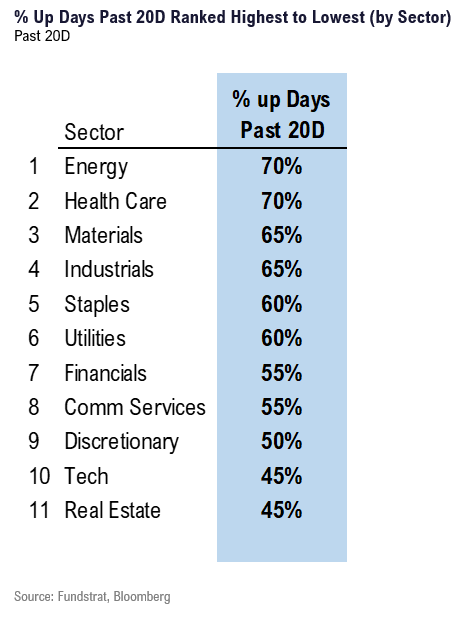
- The 4 sectors with the best % up days ratio is Healthcare (XLV 0.01% ), Utilities (XLU -1.09% ), Basic Materials (XLB 0.62% ) and Industrials (XLI 0.16% ) and is the second table. But of these, the EPS revisions have been negative for Healthcare and Utilities, so these are not as attractive as Materials or Industrials.
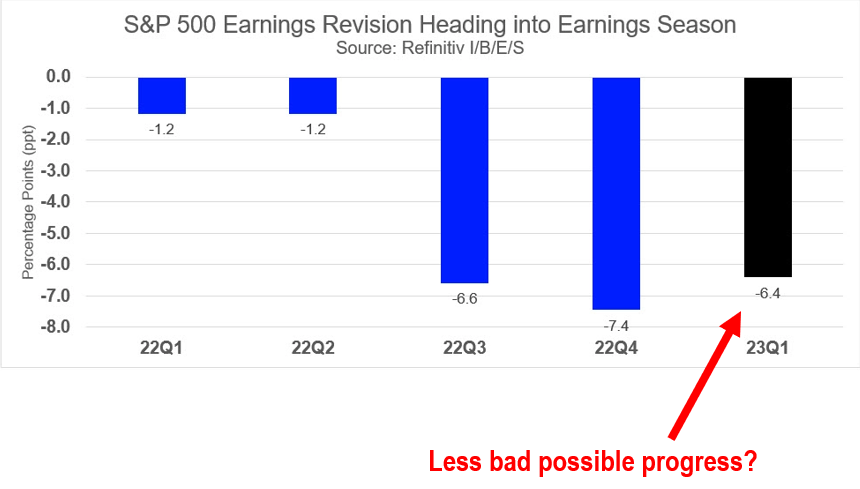
- Regarding 1Q2023 EPS, the first reports by major banks beat consensus estimates by 9% to 20% (JPM 0.06% WFC PNC -0.12% C 1.29% ) and data by Refinitiv/Eikon show that 1Q2023 EPS estimates overall declined (vs 3M earlier) by -6.4%. While this sounds bad, this is lower than -7.4%/-6.6% of 4Q22 and 3Q22, respectively, meaning, the downward drift in EPS estimates is somewhat bottoming.
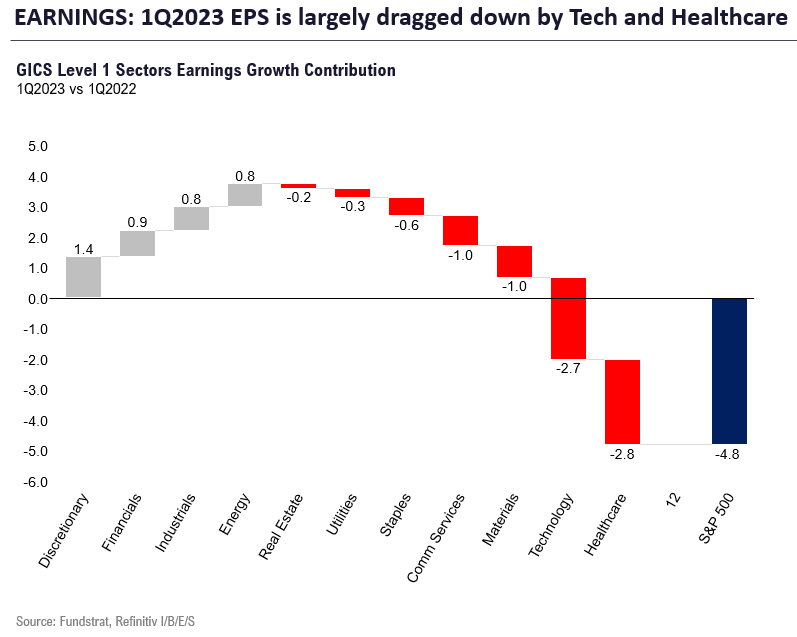
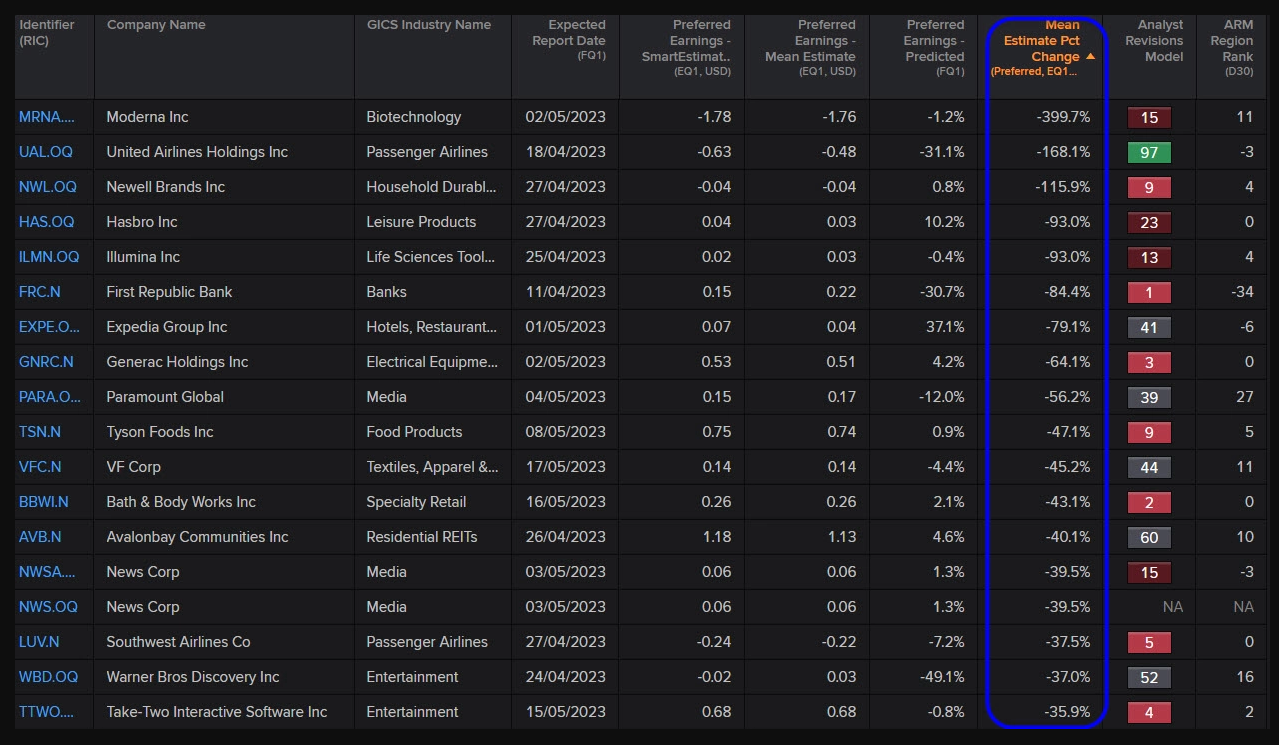
- As for the drivers of down 1Q2023 EPS, the largest contributor is Healthcare (-19% XLV 0.01% ) which is -3% of the -5% overall EPS decline. The 3 worst EPS revisions have been Moderna (MRNA 2.17% ), United Airlines (UAL) and Newell Rubbermaid (NWL 12.25% ), so this does not feel like “Cyclical EPS” is falling apart in 1Q23.
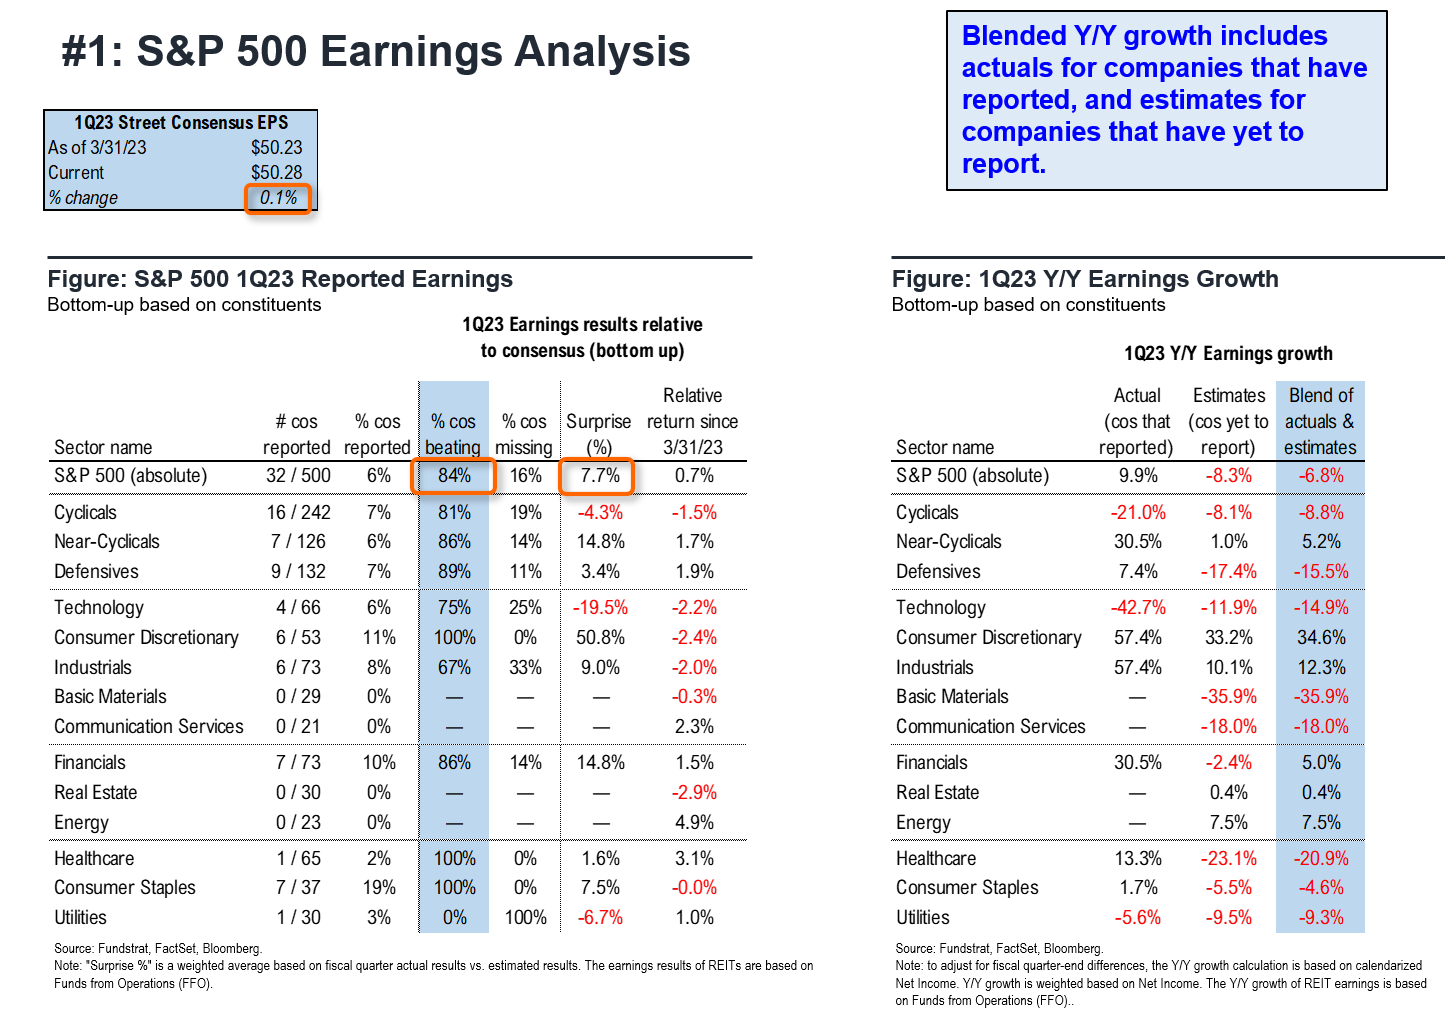
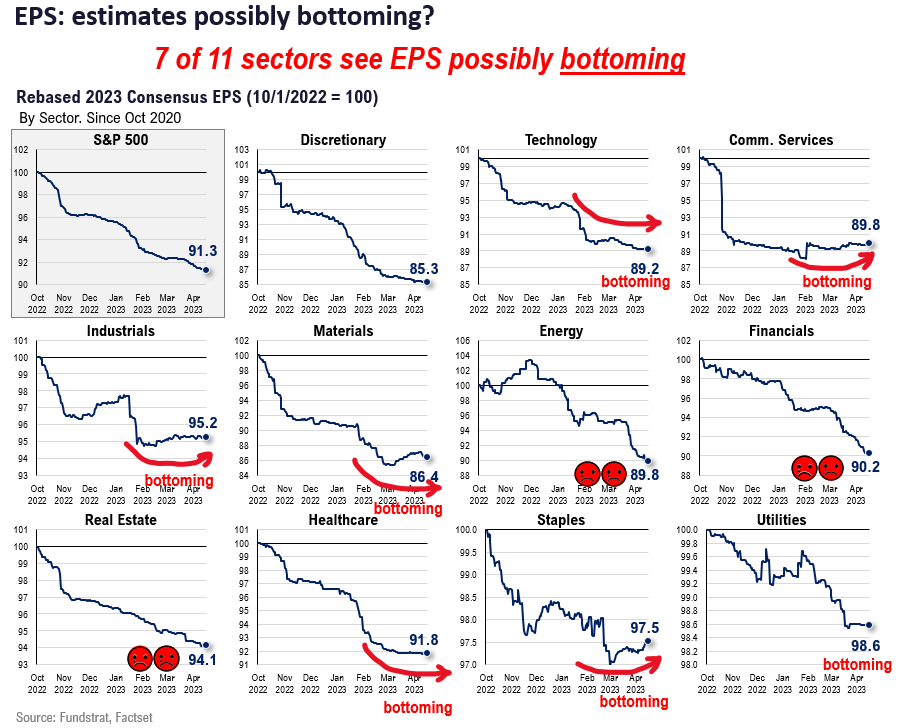
- We will get a better sense for 2023 EPS and 1Q23 results as we move through earnings season in the coming weeks, but we think the overall tone will be positive. So far, 32 companies have reported and 84% are beating, by a median of 7.7%. In fact, tracking 2023 EPS estimates since the start of the year, it looks like 7 of 11 sectors could be seeing EPS estimates somewhat bottoming. Basic Materials (XLB 0.62% ), Industrials (XLI 0.16% ) and Staples (XLP -0.21% ) look fairly definitive. The 3 sectors seeing consistent downward revisions are Energy (OIH -0.06% XLE -0.92% ), Financials (XLF -0.15% ) and REITs (XLRE 0.33% ). The latter 2 are not surprises.
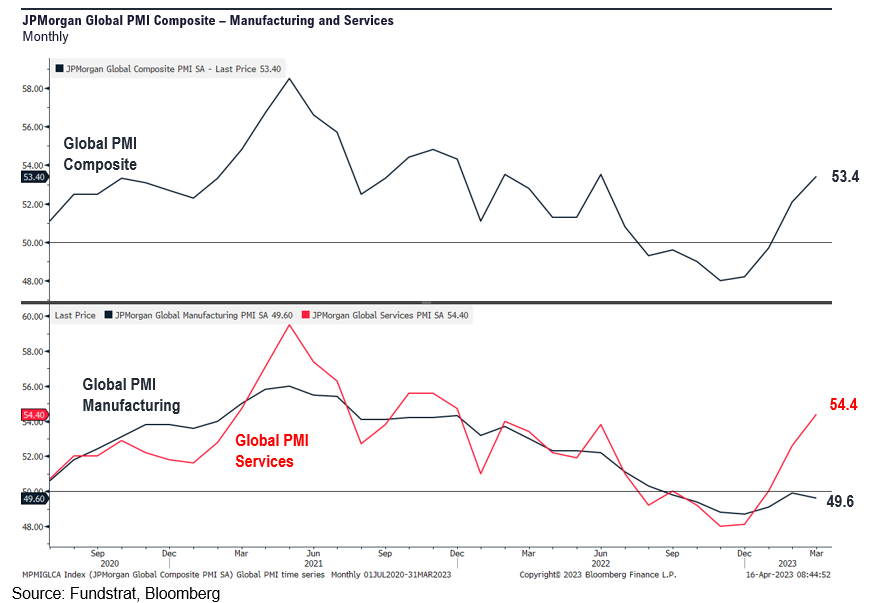
- There are several factors supporting stabilizing 2023 EPS. The first is the USD has flattened out and USD strength might have subtracted -5% to -7% of EPS in 2022. The other are global PMIs have turned back higher. The JPMorgan Global PMI composite has risen for 4 consecutive months now and is now at 53.4, the highest reading since December 2021. So while US PMIs are still weak, the rest of the world is firming. Global GDP is generally correlated to global PMIs and higher GDP = higher EPS.
- As for the Fed tolerating easing financial conditions, we think this remains the active debate in the market. Those cautious believe the Fed sees greater risks of allowing inflation to flourish versus the downside risks of overtightening. But an increasing number of economists argue the current Fed hikes are set to deliver slowing inflation (our view) and many now see higher unemployment as possibly unnecessary risks (see below). And coupled with the tightening of credit coming from the regional bank crisis, this supports the reasons the bond market is seeing a far more dovish rate path than the current Fed view (SEP, or summary of economic projections).
- Ultimately, this comes down to inflation easing and we believe inflation is on a sustained and faster (than consensus) decline. We will provide more details in our First Word on Wednesday morning. But this reflects the fact that a sufficient number of inflation components are declining and inflation is set to fall faster than consensus expects.
Bottom line: We continue to see stocks adding to their 1% gains month to date
The S&P 500 has gained 1% for the month and our composite of “rule of 1st 5 days” implies gains 4%, or exceeding 4,250 by month end. This remains our view and we believe 1Q23 earnings season results will be a positive catalyst.
FEELS LIKE A BULL: When % up days >55% and finally reached 65%, highest since Nov 2021
As we mentioned above, the % of up days recently reached 65% (last week) and is the highest since Nov 2021:
- for the entire 10 month period between Dec 2021 and Oct 2022, this figure stayed mostly below the 53% representing the long-term average since 1950.
- you might wonder why this 65% will not be the high water mark, but as we noted above, we expect 1Q23 earnings season results to bolster confidence that EPS estimates are finally bottoming
- at a time when Fed can reduce its fight against inflation.

The 6 month average for this is only 46%, which is below the 53% LT average. Thus, this explains why stocks have been rising but it has not felt like a bull market.
And as shown, the leading groups are a mix of defensives and cyclicals. So I would not necessarily deem this rally to be defensive purely. In fact, as this broadens, I suspect it would be led by cyclicals.
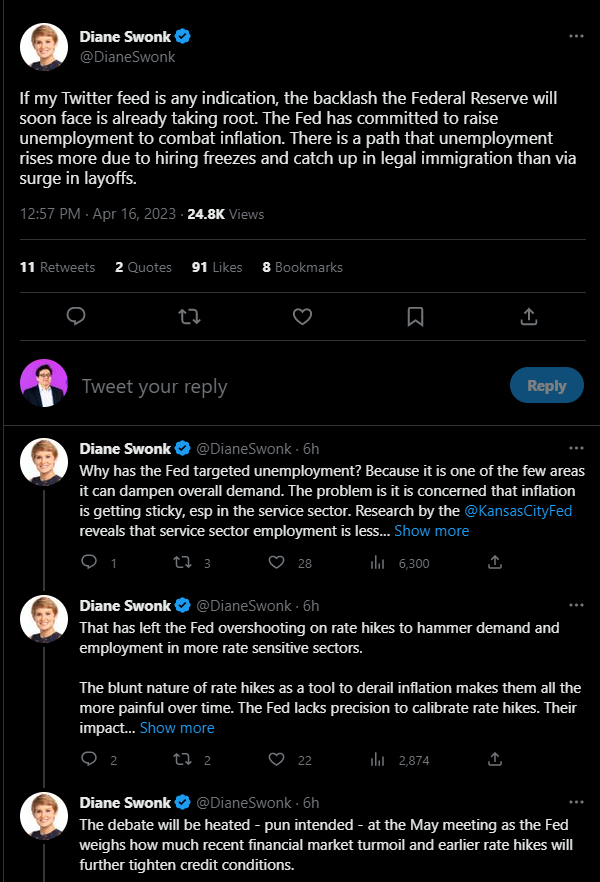
And regarding financial conditions, we expect the Fed to begin to tolerate easing financial conditions, particularly since there is growing pushback against pushing up unemployment rates. This is something we are seeing with greater frequency and is noted by economist @DianeSwonk.
1Q23 EPS: Better than feared
1Q23 EPS revisions are down 6.4% in the past 3 months, but the half-full reality is this is better than the revisions for 3Q22 and 4Q22. The takeaway being that the headwinds that hurt profit visibility could be easing to an extent. We will have a better sense as we move through earnings season.
The largest drag to EPS in 1Q23 is Healthcare with EPS down 19%. And as shown below, the largest single revision downwards is Moderna.
- Healthcare is not being hit by the downturn in the economic cycle. The downturn in profits reflects the extraordinarily good earnings from 2021 and 2022.
- This makes comparisons more difficult.
And while only 32 companies have reported results so far:
- 84% are beating by a median of 7.7%, so it has been a good start.
2023 EPS: Positive comparisons in 2H23?
As for consensus forecasts, we know negative revisions are slowing to an extent. We will have a better sense once we hear from a broader set of companies.
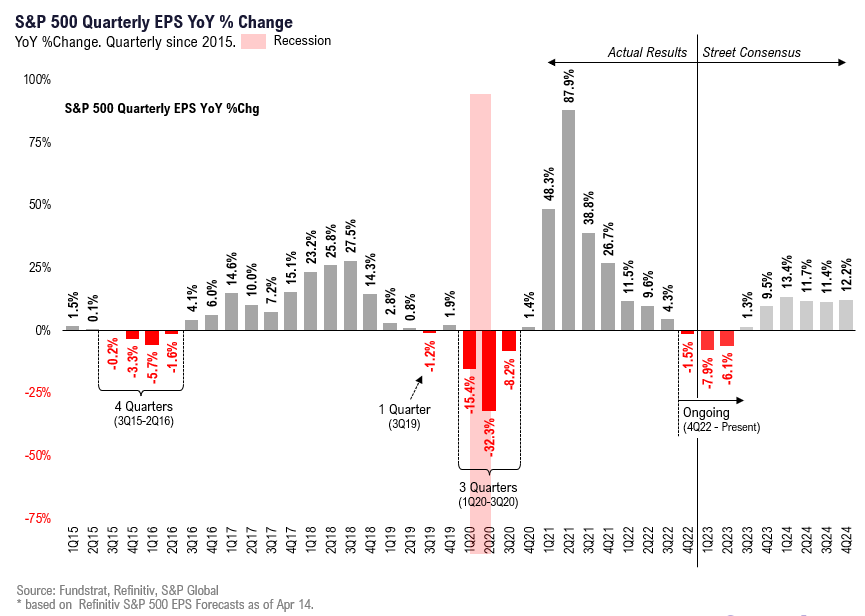
- but 2H2023 is currently expected to see profits turn higher.
- this would be 3-4 quarters of negative YoY EPS and this is consistent with the profit recessions of 2016 and 2020
And as we noted, 7 of 11 sectors seem to have bottoming of EPS forecasts. This is similarly positive.
Global PMI: Bottoming, which we see boding well for profits in 2023
The JPM Global PMIs have turned up for 4 consecutive months as shown below. The Global Services PMI is what has turned higher and the manufacturing is still below 50, but hovering just below 50.
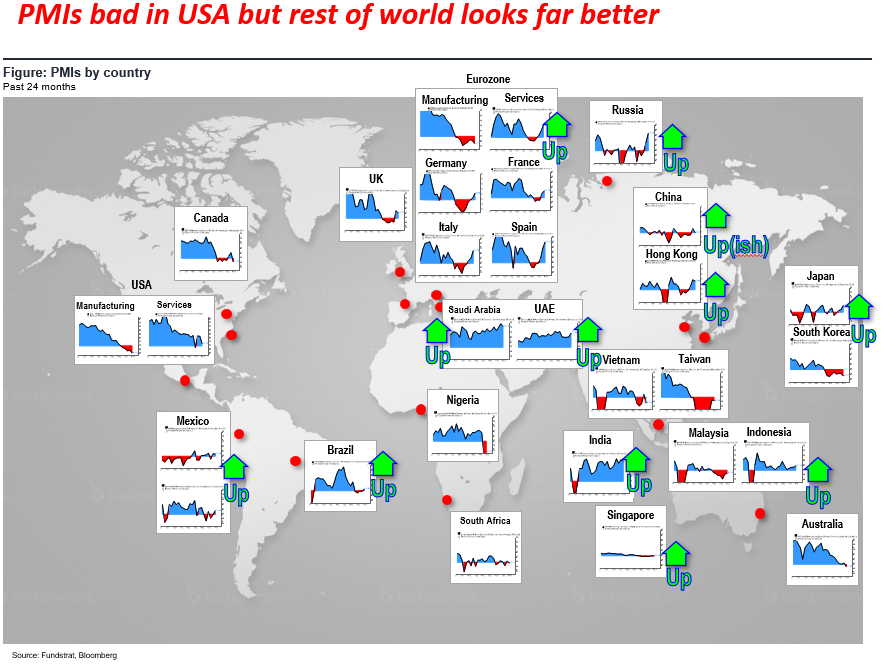
While US PMIs have been weakening (still), the chart below shows the Europe, parts of Asia and Latin America have already seen PMIs strengthen. With more than half of S&P 500 profits generated outside the US, this upturn in PMIs suggest global GDP should strengthen, which should help EPS.
ECONOMIC CALENDAR: Key is inflation, and April so far is “tame”
With the exception of the Atlanta Fed wage tracker, incoming data for inflation in April (March data) has been tame).
Key incoming data April
4/3 10am ISM Manufacturing Employment/Prices Paid MarchTame4/4 10am ET JOLTS Job Openings (Feb)Tame4/7 8:30am ET March employment reportTame4/12 8:30am ET CPI MarchTame4/12 2pm ET March FOMC MinutesTame4/13 8:30am ET PPI March Tame- 4/14 7am ET 1Q 2023 Earnings Season Begins
4/14 Atlanta Fed Wage Tracker MarchSemi-strong- 4/14 10am ET U. Mich. March prelim 1-yr inflation
- 4/19 2:30pm ET Fed releases Beige Book
- 4/28 8:30am ET PCE March
In fact, incoming data on inflation has been soft since the start of March (the start Feb data) and supports the idea that the “hot” inflation readings in Jan (reported in Feb) was the anamoly.
Key incoming data for March 2023
3/7 10 am ET Powell testifies SenateHawkish3/8 10am ET Powell testifies HouseNeutral3/8 10am ET JOLTS Job Openings (Jan)Semi-strong3/8 2pm ET Fed releases Beige BookSoft3/10 8:30am ET Feb employment reportSoft3/13 Feb NY Fed survey inflation exp.Soft3/14 6am ET NFIB Feb small biz surveySoft
3/14 8:30am ET CPI FebTame3/15 8:30am ET PPI FebTame3/17 10am ET U. Mich. March prelim 1-yr inflationBIG DROP3/22 2pm ET March FOMC rate decisionDOVISH3/31 8:30am ET Core PCE deflator FebTame3/31 10am ET U Mich. March final 1-yr inflationTame
STRATEGY: Staying above 200 week moving average = good
The S&P 500 has been above its 200 week moving average for 25 weeks now as shown below. On Oct 12, 2022, the S&P 500 touched this level and has since moved higher.
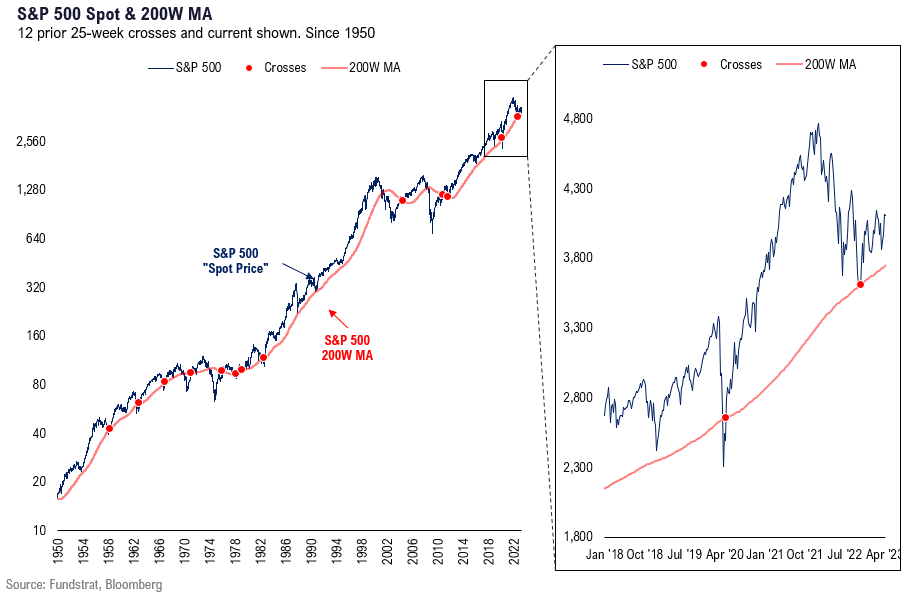
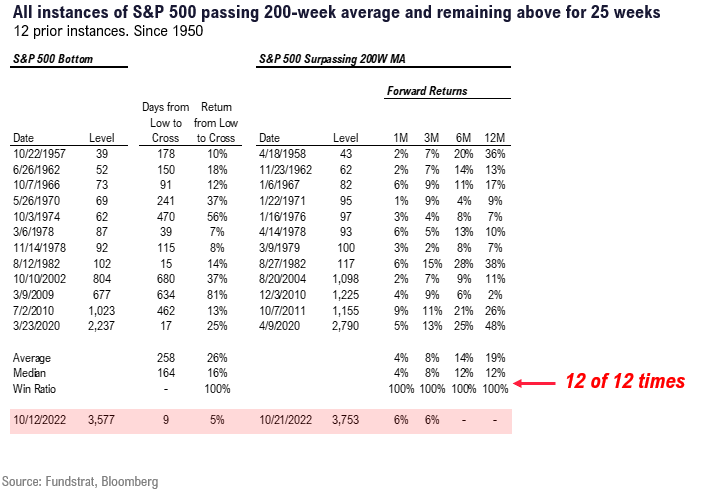
In fact, as the table below shows, in the 12 instances of crossing above 200 week moving average and staying there for 25 weeks:
- S&P 500 higher in 12 of 12 instances
- for all periods, 1M, 3M, 6M and 12M
- doesn’t this sound like a bull market?
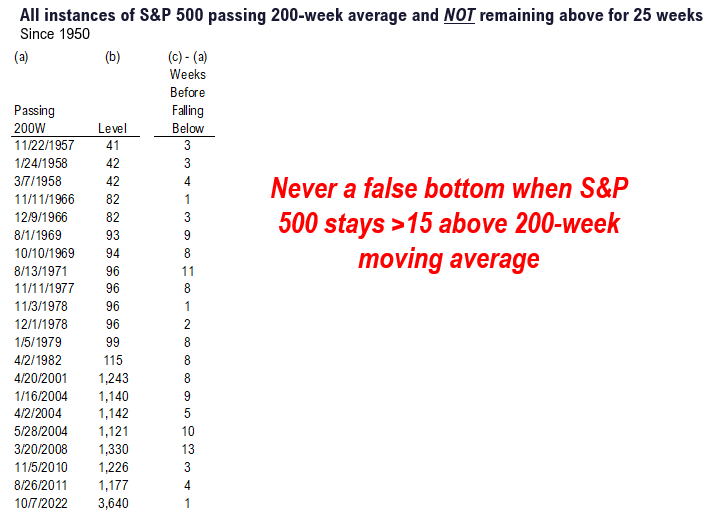
We arrived at “25 weeks” based upon the table below.
- since 1957, there have been multiple crosses above 200 week
- but many failed and led to new lows
- the longest of these “fake recoveries” is 13 weeks
- thus, we looked at 15 weeks as the threshold
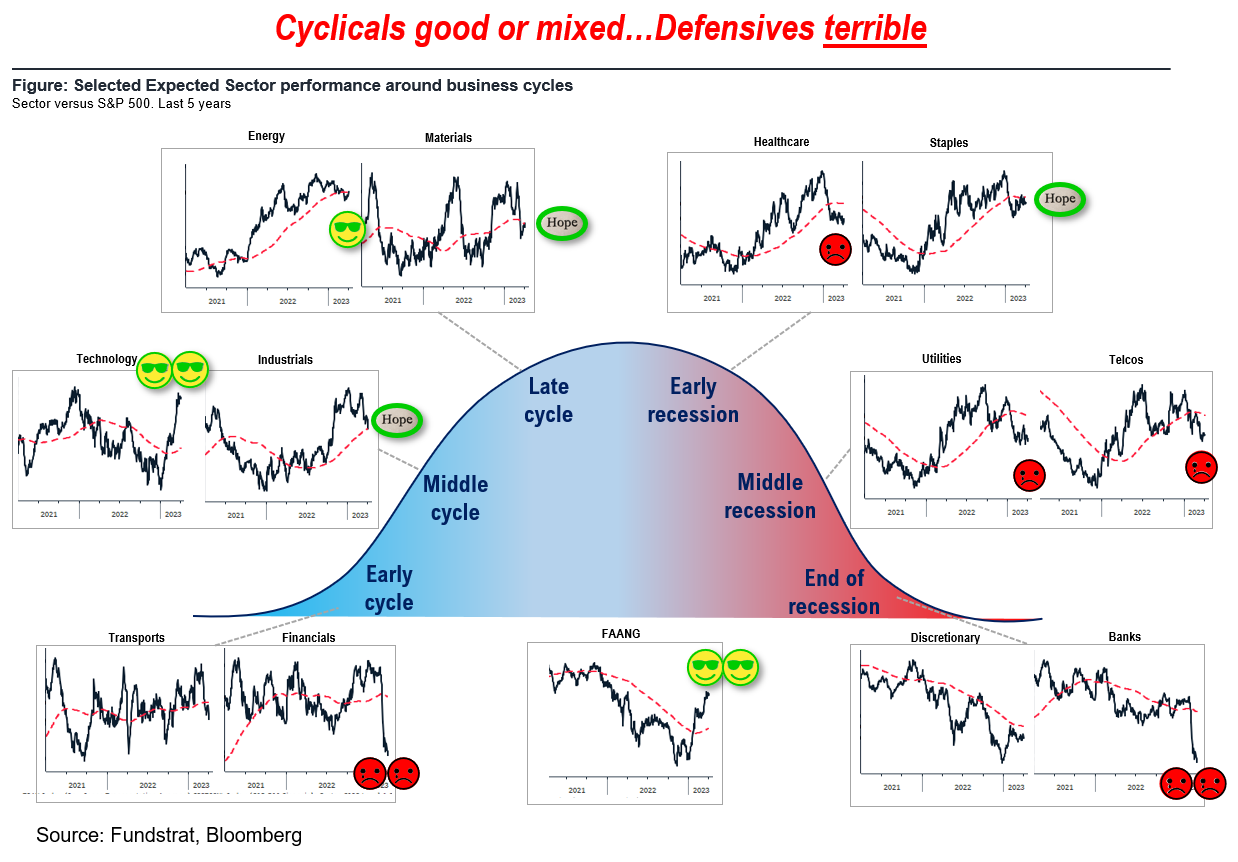
STRATEGY: Cyclicals outperforming more than Defensives
We have highlighted the 2-yr relative performance of the major groups below and as shown, the leadership is more cyclical.
- Leading are Tech/FAANG, Energy, some Industrials, Materials and Staples.
- The drags on S&P 500 performance have been Utilities, Financials, Telecoms and Healthcare.
- In other words, the drags have been largely Defensives.
- This is counter to those saying this rally in 2023 is Defensive stocks.
And our base case for April remains a strong >4% rally, following the pattern of “Rule of 1st 5 days.” The Rule of 1st 5 days looks at years when S&P 500 gains >1.4% in 1st 5 days and is negative the prior year.
- This has happened 7 times since 1950: 1958, 1963, 1967, 1975, 2003, 2012 and 2019.
- Based upon those 7 years, April implied gain is +4.2% and was positive 6 of 7 times (only 2012, -0.7%). This implies +175 points, or S&P 500 >4,275 by the end of April.

A gain of 4%, or +172 points would put S&P 500 >4,250 by the end of the month. And we think this would ultimately force a bear capitulation.

We publish on a 3-day a week schedule:
Monday
SKIP TUESDAY
Wednesday
SKIP THURSDAY
Friday
_____________________________
37 Granny Shot Ideas: We performed our quarterly rebalance on 1/30. Full stock list here –> Click here
______________________________

