Technical Strategy

Research

Technical Analysis

Technical analysis is generally based on the study of price movement, volume, seasonality, sentiment, and trading flows in an attempt to identify and project price trends, targets and potential exhaustion. Moreover, technicals are largely utilized for identifying potentially attractive risk/reward opportunities and/or highlighting improving or deteriorating trends in Equities, Treasuries, Currencies, Commodities and/or Cryptocurrencies. Technical analysis does not consider the fundamentals of the underlying asset being analyzed.
Whitney leaning against a railing on a downtown street

Mark Newton, CMT

As former Managing Member/Owner of Newton Advisors LLC, Mark has more than 25 years of buy-side and sell-side experience in the financial services industry. He formerly worked with Diamondback Capital Management, and with Morgan Stanley in New York City as their technical strategist.
Before moving to the New York City area in 2004, Mark traded equity options as a market maker/floor trader at the CBOE, and worked in risk management. Mark is a member of the Market Technicians Association, and former member of the CBOE, CBOT, and PHLX. He graduated with a BS in Finance from Virginia Tech in 1991 and obtained his Chartered Market Technician designation in 2002. He appears frequently on CNBC, FOX Business and Bloomberg.

Why is Technical Strategy Important?

While it's widely thought that fundamental and macro analysis can help one understand the underlying health/attractiveness of a company's stock and the economy, technical analysis is important when considering the underlying trend of a certain asset class for purchase.
When considering buying a stock, one generally prefers to have the technical indicators pointing in the same direction as the fundamentals. Thus, a rising trend of higher highs and higher lows coinciding with improving fundamentals is beneficial, versus a trend steadily moving lower, or sideways, on any time frame. As we know, stocks rarely trade at/near “intrinsic value” and price targets given by fundamental analysts, so having an understanding of direction of trend is vital to knowing what direction a stock is trading and/or whether this is strengthening or weakening. Technical analysis is highly useful in determining when it might be possible for the underlying to have a chance at reaching the fundamental target.

Overall, utilizing technical analysis in one's process might be beneficial for the following reasons:

The following concepts can help you navigate the markets:

  • First, they allow one to understand what the current trend is of the asset (stock, ETF, crypto, etc ) in question over various time frames. It's useful to know whether a stock is trending higher, lower, or sideways, and attempt to buy/own stocks with both technicals and fundamentals simultaneously improving.
  • Second, technicals can be used for risk management purposes, and many investors make use of technicals to help right-size their positions, (overweighting stocks which have the best technical setup or offer attractive risk/reward profiles, particularly if this lines up with the fundamental backdrop). Moreover, others consider using technicals to hedge or sell their positions if/when a stock starts to deviate meaningfully from its trend or potentially reaches levels out of line with fundamentals.
  • Third, technical analysis is often used for stock selection, in seeking out stocks which appear like attractive risk/reward candidates and which might offer above-average return possibilities. Based on one's risk tolerance or preference for investment, some might consider buying stocks which are breaking out to new 52-week high territory, or have been demonstrating superb relative strength versus their peers. Others might choose to buy short-term weakness within a current uptrend at levels which technicals suggest make sense.

When looking at technical analysis the following concepts are tied to the discipline and can help one navigate the markets:

  • Momentum
  • Relative Strength
  • Volume
  • Breadth
  • Sentiment Shifts
  • Cycles
  • Seasonality
  • Trend Analysis (Trend Following, and Counter-Trend)
  • Sector Rotation
  • Time Analysis
  • Elliott-Wave Theory

Mark Newton’s Methodology

In the field of technical strategy, one typically has a plethora of tools to choose from, among hundreds if not thousands of various indicators developed over the last 100 years. These can normally range from trend following to counter-trend indicators, and ones that specialize in analyzing from a trend following perspective to those that are more effective within trading ranges.
There are dozens of ways to group together any number of indicators that might be successful in allowing one to study a given market technically. What's important before embarking on this process is to carefully consider one's time frame for investment and expectations to get out of this process.
Some investors might have a nano-second type time frame which explores small deviations from current trends, either to exploit movement from a trend following breakout type approach or looking to trade something from a counter-trend standpoint that has deviated meaningfully from a current trend. The latter type movement could be attempted to exploit by fading a certain move, expecting mean reversion back to the prior trading range.
These days traders often have a very short-term time frame for an investment or “trade”, but the frequency of trading can often create variance and divergences in outcomes.
Other investors tend to have more of a position-trading or swing trading time frame, and prefer to analyze with a time frame of multiple days and/or weeks or months, but having a preferred outcome of 4-6 weeks for example would typify this approach.
Meanwhile, long-term investors can make use of technical analysis for intermediate-term or long-term time frames of 4-6 months or even years, and use longer-term charts for the purposes of a more lengthy duration of investments. One can certainly drill down to either a short-term or long-term approach, but would typically focus on a chart that closely lines up with that time frame.
Mark Newton typically likes to utilize a wide variety of various indicators in his toolkit but often forgoes some of the commonly utilized indicators such as moving averages to indicate support or resistance, or making use of cross-overs in various oscillators in order to time entry for an investment of any kind. Frequently, Mark concentrates on technical structure and price action as having the biggest contribution to his comprehensive style. Frequently, Mark concentrates on technical structure and price action as the biggest contribution to his unique style.
By studying time frames of monthly charts and going back historically since the origin of a certain stock or index, one can get a feel for prior highs and lows and longer-term trends which might materialize as important support and/or resistance.
Next, by shortening the time frame and concentrating on weekly and/or daily time frames, Mark can then put the near-term trading action into the larger framework to have a better understanding as to how to view a certain trend, and hopefully to profit from it.
In general, stocks whose patterns exhibit technical resilience, trading within technical uptrends on a shorter-term, mid-term and long-term basis without any evidence of trends changing, often tend to be the best of all technical patterns. This is important because if you’re only buying things that are fundamentally undervalued, you can miss out on a lot of gains and lucrative shorter-term opportunities. Many investors choose to avoid stocks at all-time highs, for instance, and in many cases this can be the wrong move.

Important Indicators Used

Trend Identification

daily, weekly, monthly basis
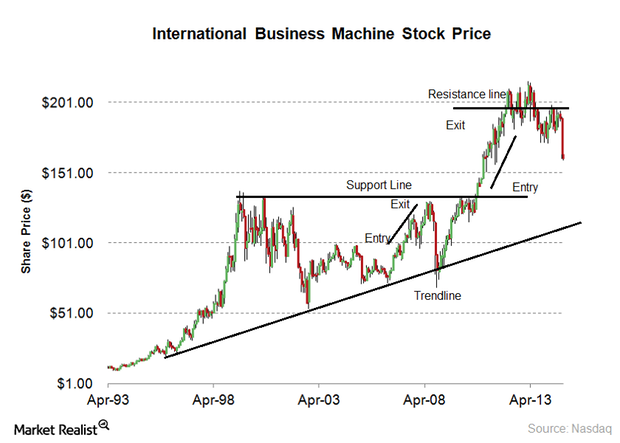
Structural Analysis

Utilizing former highs and lows as potentially being important for resistance and/or support for trading over multiple timeframes

Trendline Utilization

Drawing trendlines extending from the lowest lows to the low preceding the highest highs

Fibonacci Analysis

Using the concept of Fibonacci for retracements in both time and price terms for identifying possible areas of exhaustion

Momentum Analysis

Seeking stocks exhibiting positive momentum for long investments on multiple timeframes

Momentum Divergence Analysis

Keeping track of when momentum starts to positively or negatively diverge from current price trends for purposes of early warnings

Volume Analysis

Keeping track of heavy volume during price gains or lack thereof for help in deciphering the possible duration of a certain trend

Breadth

his is more useful for broader indices when studying the underlying health of a market, but remains quite useful

Ratio Charts

Comparing a stock to its industry and/or to underlying index such as SPX

Relative Strength

Seeking out stocks which exhibit stellar strength and are trading at or within striking distance of 52-week highs (for Long stock selection)

Counter-Trend Analysis

Utilization of Tom DeMark's indicators like TD Sequential and/or TD Combo to identify strong trends which might be on the verge of reversing course, either from downside to upside, or vice-versa

Cycles

Utilizing cycle composites to gain an understanding of the most commonly seen cycles which dictate patterns of low-to-low, or high-to-high for help in identifying potential highs and lows in price

Elliott-Wave

Elliott-Wave projections for the purposes of forecasting potential price targets and utilizing former highs or lows for various stock rallies and for purposes of identifying whether a rally is a new and impulsive trend, or represents a counter-trend move

Astro-Analysis

Utilizing Sun, moon and planetary cycles for use in pinpointing highs, lows and trends for stocks and indices, both from a transiting to transiting standpoint, or transits to natal charts for analysis

Seasonality Studies

Seasonality Studies to identify times of above–average strength and/or weakness based on historical trends

Sentiment Analysis

Using Equity Put/call ratios for indices or stocks and/or commonly used Sentiment polls for keeping tabs on investor sentiment

How to use this technical strategy research

Most daily notes concentrate on Equities and equity sectors/ETFs but also frequently include analysis of treasury markets, commodities, currencies and cryptocurrencies. This is meant largely to draw attention to markets that might show above-average volatility which may not be on the radar of some investors. Often this volatility can create short-term and potentially longer-term trading and/or investing opportunities that merit its inclusion in a well-rounded research process.
Typically, a section on the S&P 500, or QQQ is shown first, to draw attention to the current short-term trend of the market, pointing out areas of support/resistance for traders and illustrating bullish/bearish factors that might be important in causing the trend to extend further, or reverse course.
Next, charts of other actionable assets might be shown that are exhibiting technical structure that merits discussion. Note, not all the write-ups are meant to constitute buy ideas or recommendations, but sometimes are important in the context of the broader market volatility. Mr. Newton's research is generally trying to acclimate investors to timely tactical insights that should be used in conjunction with our other research. Remember, fundamentals are purposely excluded from his process to limit bias and maintain a purity of discipline.
Overall, investors can utilize Mark Newton's technical research in many different ways:
    Daily Commentary (Newton's Law):
    These daily reports attempt to keep investors informed as to the current trends and potential future price trends of the assets being analyzed. Often it's beneficial to read Mark's comments and to understand his time frame for analysis. Long and short ideas occasionally are mentioned which detail how investors might participate in what's being discussed. Mark will provide specific targets to help investors inform tactical decisions.
    Daily Technical Analysis Videos:
    These videos can be helpful to assisting investors better understand the charts of the assets being discussed, but also Mark's analysis as he reviews the charts on various timeframes. Many investors enjoy this personalized style of analysis, which is quick, easy to understand, and comprehensive.
    Technical Trade Ideas:
    Mark will utilize these notes to provide actionable long and short ideas based on his technical analysis. Investors will quickly get a feeling for the kind of risk/reward setups Mark prefers and what he finds most attractive. Many of our members have found Mark's insights to be an indispensable addition to the FS Insight suite of products.
    Live Technical Stock Analysis:
    Once a month, Mark invites you to join his live webinar, where he'll quickly analyze stocks, ETFs or risk assets which have received the most “UpVotes” by members. He'll attempt to analyze as many as possible during the allotted time. Please check out which stocks are most requested here from our members or register for the next session so you can join the live techincal stock analysis. Click HERE to submit your preferred stocks to be analyzed by Mark during his next session!
Overall, some might wish to utilize Mark's technical research on its own, or consider pairing it with all the other content FS Insight has to offer. For example, one could utilize Mark's reports but also combine these with Tom Lee's First Word for entry prices to Tom's strategies.
Additionally, subscribers could evaluate Mark's work and use it in combination with the FSI Sector Allocation and Brian's Dunks for determining entry / exits. Finally, one can gauge the market sentiment by looking at Quant Focus combined with Mark's work.

Conclusion and Next Steps

Finally, it is important to understand that Mark's reports are based solely on his own technical analysis tools and might not necessarily line up or agree with the content being written by other teams. We view having multiple independent lenses of analysis as a distinct strength of our product lineup. Mark tends to have a shorter-term time frame for his analysis, and his methodologies are 100% different from others within FS Insight who might have a different toolkit towards analyzing markets. Often our analysis is mutually supportive of our theses, but when different types of analysis diverge this is a useful signal as well.
Technical analysis is predominantly concerned with historical price and time movement and does not consider the underlying fundamentals of the stocks mentioned.
Moreover, the macro picture tends to shift very rapidly in this day and age, and it's thought that using analysis from various different disciplines is often helpful towards deciphering the volatility present in risk assets.
Finally, while Mark might make technical suggestions on various stock tickers or ETFs mentioned, it's important to keep in mind that each investor has their own risk tolerance and time frame for investment.
Thus, while technical price targets or stops might be given as part of daily write-ups, it's up to each investor to manage his/her investments based on their own risk profile. Ultimately, investors take the risk and we do not share in your gains and losses. We try to provide the best research in the business, but our members are responsible for the trades they choose.
Bottom line, read and enjoy, but always use FS Insight analysis as a supplement to a more robust analysis that one needs for portfolio construction, and/or position management. Mark's work is simply one more tool in your arsenal to help navigate these markets.