


February 2023 Upticks


Note: This Upticks report will be in replace of my Daily Technical Strategy piece today (2/22/2023).
Update
US Equity markets continue to be caught in a tug-of-war between bulls and bears, with market participants largely still confused as to why economic data and earnings are not having as strong of a pull on market prices as many might expect. The bears continue to wrestling with downward earnings revisions and the ongoing uncertainty of the FOMC’s endgame for interest rate hikes. Meanwhile the Bulls seem to champion a quicker pullback in inflation and a more resilient economy which might be able to withstand further rate hikes and usher in growth in the months to come.
Technically speaking of course, most of the data continues to support a more enthusiastic stance for risk assets, largely centered on recent momentum and breadth expansion, coupled with bearish sentiment and bullish market cycles for US Equities. Sectors like Technology have staged a sharp rebound, and key index constituents like MSFT, GOOGL and AAPL have all exceeded their respective downtrends. As of early February, the percentage of SPX issues above their respective 200-day moving averages had surpassed 70%, the highest level in more than a year.
Meanwhile, as previously discussed, first-half seasonality in pre-election years tends to be one of the best periods of the four-year Presidential cycle, which might make near-term cyclical weakness prove short-lived. This bullish cyclicality has largely proved to be opposite to Wall Street Consensus, which came into 2023 expecting a weaker first half followed by a comeback in the back half of the year.
February has indeed proven tricky thus far, and prices have run counter to normal pre-election year seasonality for the month. Yet a few bullish points are worth mentioning which largely reinforce the idea that a positive stance this year should be correct. First, uptrends from last October’s lows remain intact, and despite some minor “backing and filling” no real technical damage has occurred.
Furthermore, defensive sectors have shown persistent underperformance. Even counting the weakness of the past few weeks, sectors like Consumer Discretionary, Technology and Communication Services have outperformed sectors like Utilities and Consumer Staples.
Finally, most of the world continues to show very constructive signs of recovery from last year’s bear market,and several countries like France and the UK have seen their respective benchmarks rise back to new all-time high territory. The US has lagged in this regard given big-cap Technology’s weakness in recent months. However, the US is thought to offer some upcoming mean reversion to other international indices given the success of Technology having begun to strengthen.
One of the more important pieces of the puzzle concerns market sentiment, and on this point, I see short-term sentiment having diverged a bit from longer-term sentiment. Specifically, call option trading has recently hit all-time highs in volume thanks to recent interest in Zero-day-to-expiration options (DTE-0). Furthermore, popular gauges of sentiment like AAII and Fear and Greed recently switched back to bullish/greedy after months of having been negative. However, this comes amidst an intermediate-term trend of very high cash balances in investors’ portfolios. Moreover, recent Bank of America Portfolio Manager surveys from January showed Portfolio manager allocations to US equities having plummeted to the lowest levels in nearly two decades. Overall, my thoughts are that short-term weakness in Equities in recent weeks should go a long way towards helping to reign in this short-term bullish sentiment and provide buying opportunities for investors who are focused more on the intermediate-term.
Methodology
- Relative strength vs. sector and index
- At/near 26-week and/or 52-week highs
- Positive momentum and/or Upward sloping moving averages on multiple timeframes
- Lack of DeMark exhaustion on daily, weekly, monthly and/or in combination based on TD Sequential and/or TD Combo indicators
- DeMark “TD 13 countdown Buys” utilizing TD Sequential and/or TD Combo indicators at/near lows on multiple timeframes
- Elliott-wave theory
- Positive momentum divergences (at/near lows for buy candidates), Lack of deterioration within its sector and at/near upper quartile of its annual range
- Above-average bullish bases for lengthy timeframes which might precede technical breakouts
Additions (Upticks)
- Microsoft. (MSFT -1.38% – $251.51)
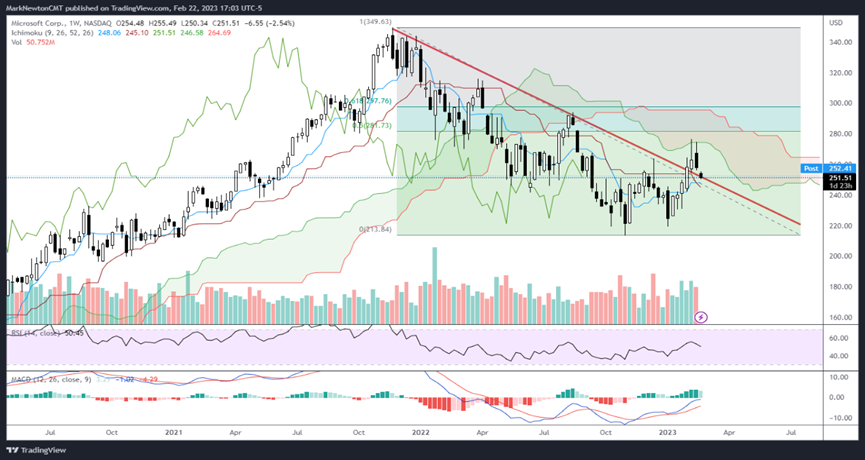
Microsoft looks right to have exposure to following its successful breakout of the long-term downtrend followed by its pullback over the last couple weeks. Its rally into late January came very close to testing its 50% retracement of the prior decline, but fell short given prices finding resistance at the weekly Ichimoku cloud. Now recent weakness has brought prices right back to test the area of the breakout, which creates an attractive technical risk reward. Upside looks likely up to retest $276.76 and over should drive a rally up to $298, or the 61.8% Fibonacci retracement of the prior decline. Momentum has begun to slope higher on a weekly basis, and makes a compelling case that MSFT likely has begun to bottom out. Ideal support to buy dips lies at $242-$249. However, any move back over $260 likely means this rally is getting started again, and no further pullback might be necessary. Overall, MSFT looks to outperform among large-cap Technology, and looks technically appealing here.
- Amgen. (AMGN 2.17% – $236.16)
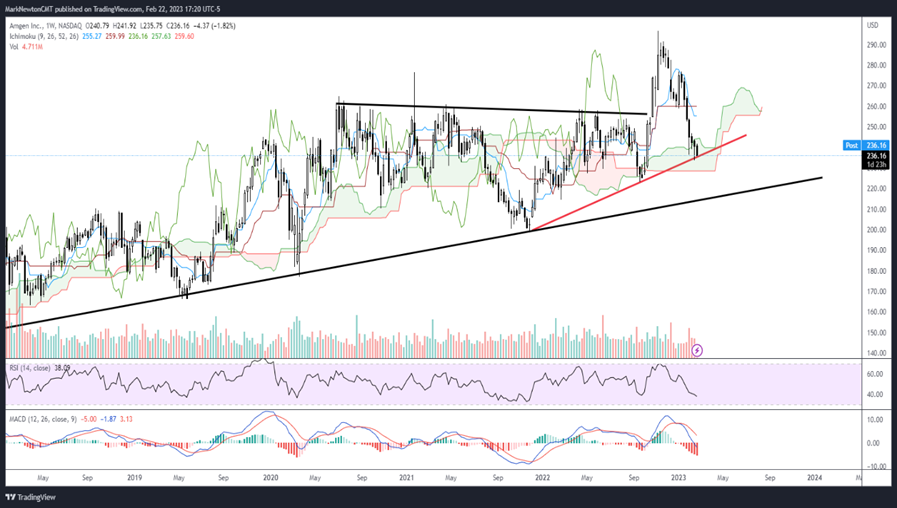
Amgen looks attractive following its recent 20% decline over the last three months as part of its larger bullish pattern. While this downtrend remains ongoing and has not yet stabilized, AMGN looks attractive given that momentum has reached oversold levels while prices have pulled back to test an uptrend connecting rising lows from late 2021. Support on this recent drawdown could materialize at current levels with a maximum selloff down to test September lows just above $223.
- Boston Scientific (BSX -1.72% – $46.61)
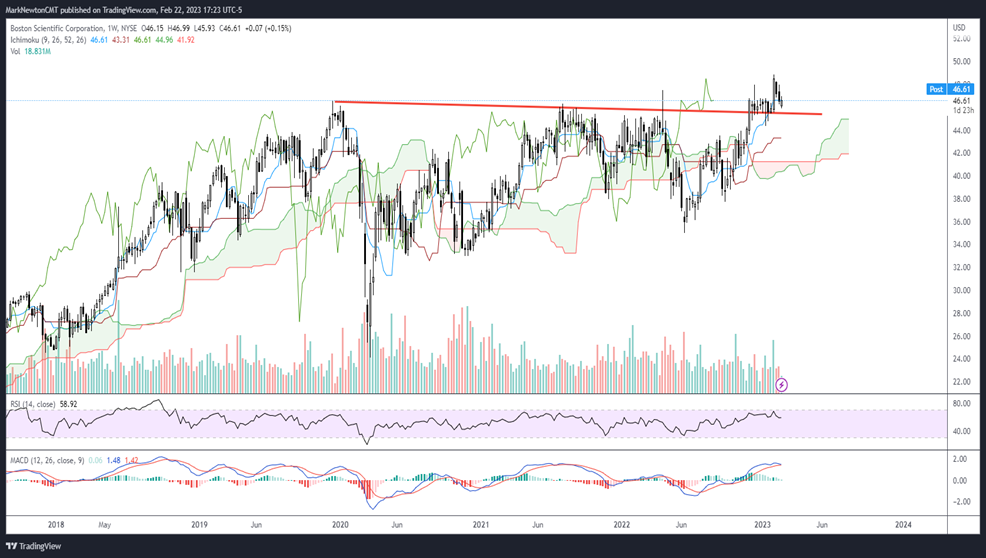
Boston Scientific looks quite appealing following the lengthy intermediate-term breakout which happened back in late November 2022. The stock had been basing since early 2020, so the consolidation had spanned nearly three years before being exceeded three months ago. Volume has been supportive of this rally and expanded initially in October and then again back in late January when this moved over $48. Now a two-week consolidation should provide an appealing area to buy dips for those looking after successfully helping to lessen overbought conditions. Upside targets lie near $58 while support on pullbacks is found at $43.50
Other Comments
Tesla (TSLA 15.33% – $200.86)
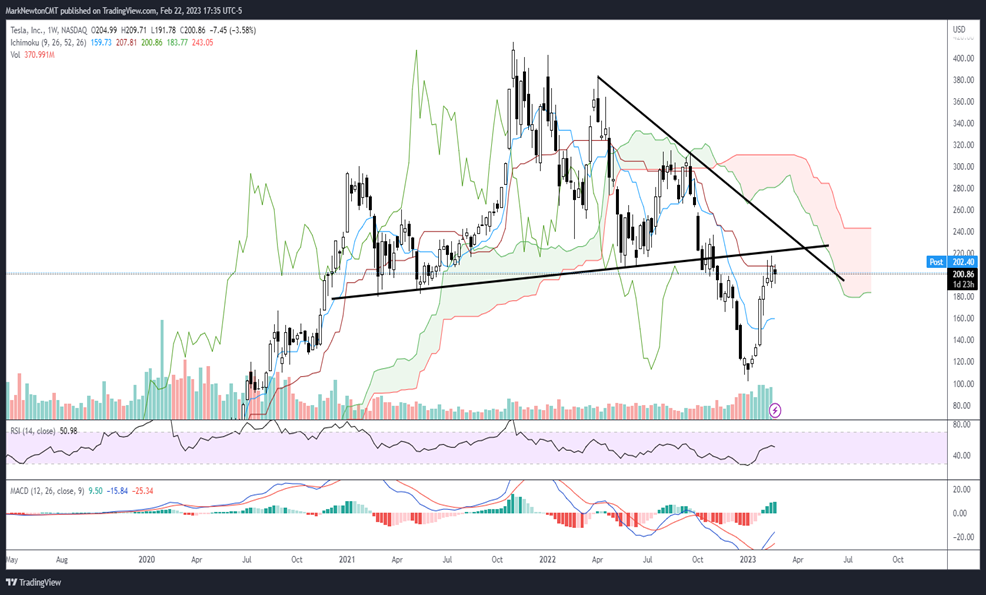
I’m choosing to keep TSLA as a laggard selection, despite the stock’s massive comeback in the last couple months. While initial comments did suggest a move down to near $100 was possible, there wasn’t sufficient technical evidence at the time to suggest it was right to remove TSLA as a laggard, expecting any kind of meaningful rally. Now TSLA has begun to stall out in the last couple weeks right near the area of the former breakdown at $205-$215, an area that I feel is technically significant given that it’s lined up with the giant area of neckline support (which should now prove to be resistance on this retest) My cycle composite shows TSLA peaking and declining into the month of May. However, it’s still difficult to expect TSLA pulls back right away, and it’s necessary to see the stock get back under $187.61 on a weekly close before any larger pullback is thought to be getting underway. Bottom line, I view a 100% rally since January as part of a larger bearish pattern to make the stock unattractive at current levels. However, I will remove TSLA if this exceeds $225, as this would be a signal that a rally up to $259 might be possible before pulling back. At present, this current area at $200 does not seem right to expect meaningful upside, and therefore I’ll continue to hold this stock as a laggard which I expect possible underperformance in the weeks/months ahead.
Revisions to Support and Resistance on existing names
- Lennar (LEN 0.49% ) – raising resistance to $117
- Casey’s General Store (CASY 0.60% ) – Choosing to hold despite a recent break of short-term support as longer-term support lies at $197
- Monster Beverages (MNST) – Resistance will be at $114, then $124. MNST had hit first level, but expect ongoing rally for this stock.
- Hess (HES) – Moving resistance up to $120
- Marathon Petroleum (MPC) – Resistance moved to $140
- Bristol Myers (BMY – Lowering support to $65.95
- ON Semiconductor (ON) – Support moved to $60. Resistance level now $100
Deletions
- Pepsi Co – (PEP 0.04% – $176.12)
Deletions (Laggards)
- Norwegian Cruise Line Holdings – (NCLH-$16.84)
- Ollie’s Bargain Outlet Holdings – (OLLI -3.22% -$58.69)
- Wynn Resorts – (WYNN- $107.67)
The “Upticks” List
| Ticker | Sector | Price* | Support | Resistance |
| REGN 0.88% | HC | 765 | 702 | 791,860 |
| UNH | HC | 548 | 482 | 589, 627, 651 |
| AMGN 2.17% | HC | 236 | 223 | 259, 296 |
| HUM -0.85% | HC | 547 | 470 | 573, 601 |
| BMY -0.59% | HC | 80 | 65.95 | 91, 101 |
| BSX -1.72% | HC | 47 | 43.5 | 58 |
| LEN 0.49% | CD | 89 | 69.9 | 117 |
| CASY 0.60% | CD | 249 | 197 | 243, 253, 289 |
| ON 3.83% | IT | 72 | 60 | 100 |
| MSFT -1.38% | IT | 251 | 242 | 277, 298 |
| MNST 1.11% | Sp | 102 | 85 | 114, 124 |
| MPC 0.66% | E | 109 | 105 | 140 |
| HES 0.26% | E | 133 | 120 | 155, 162 |
| VLO 0.49% | E | 131 | 114 | 159,176 |
| PGR -1.11% | F | 131 | 120 | 132, 143 |
The “Upticks” (Laggards)
| Ticker | Sector | Price* | Support | Resistance |
| GME -4.20% | Cons Discretionary | 20.52 | 16 | 27.87 |
| TSLA 15.33% | Cons Discretionary | 200.86 | 160 | 225 |
| EXPE 0.13% | Cons Discretionary | 107.97 | 74.51 | 109.50 |

