

It sort of looks like USA cases peaked this week... we will have a better sense in 7 days

Click HERE to access the FSInsight COVID-19 Daily Chartbook.
We are shifting to a 4-day a week publication schedule:
Monday
Tuesday
Wednesday
SKIP THURSDAY
Friday
STRATEGY: It sort of looks like USA cases peaked… we will have a better sense in 7 days
It sort of looks like USA cases peaked this week… we will have a better sense in 7 days…
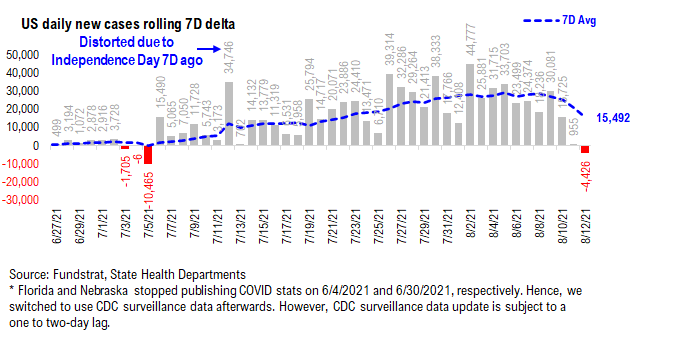
Recall, the IHME forecast USA infections would peak Wednesday, 8/11. And as the daily cases shown below show, this seems to be the case. The issue with this data is that several states, FL and Nebraska, have lagged data, so tireless Ken uses CDC data, which is lagged as well but updated daily.
– but so far so good
– daily cases do seem to be plateauing, at a minimum

The 7 day delta (see below) also flipped negative. Hmmm. This is a good sign. But we will know if this is conclusive a week from now. But for now, wow. The IHME forecast seems to have nailed the date.
Starting Monday, NYC will be requiring proof of vaccination
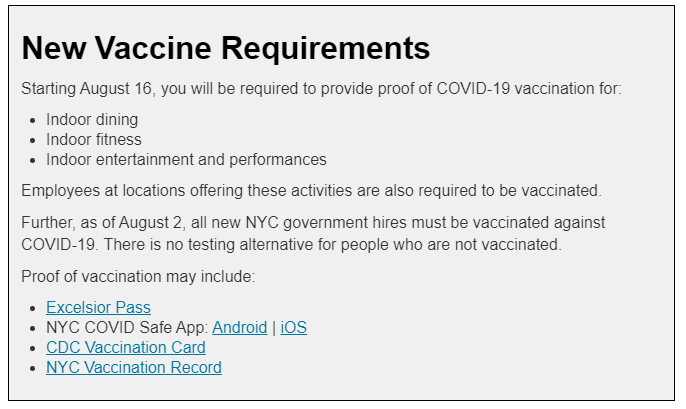
New York City is the first US city to require proof of vaccination for several activities: indoor dining, indoor fitness, and indoor entertainment/performances. I have a reservation next Monday (8/16) with some friends coming in from out of town. And they are all required to show proof of vaccination.
NYC requirements are shown below, and 4 ways to show proof of vaccination:
– Excelsior Pass <— primarily NY residents
– NYC COVID Safe App
– CDC Vaccination Card
– NYC Vaccination Record
For me, since I do not live in the state of NY, my only two options are:
– NYC COVID Safe App
– CDC Vaccination Card
I don’t want to carry my CDC Vaccination Card, so I decided to download the NYC Safe App.
The download was simple (found on iOS App store)

The app is pretty simple actually. It was really 3 steps:
– enter personal info (name, email, etc)
– upload Photo ID
– upload vaccination record
I did both and the screenshot of the app is below. As you can see, it is a pretty simple app. And I surely prefer to use this app, rather than carry my CDC vaccination record. I am just worried about losing my CDC vaccination record.

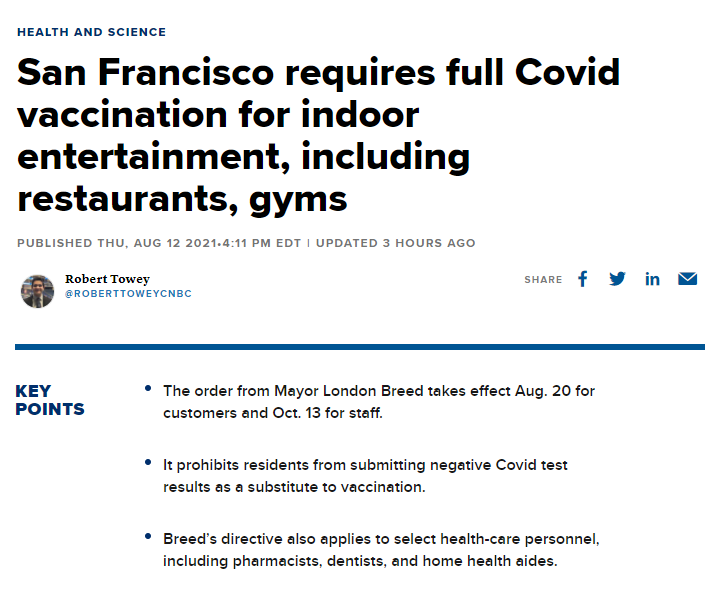
…San Francisco on Thursday announced it is also instituting vaccine requirements
On Thursday, San Francisco also announced similar measures, requiring full vaccination for indoor activities.
– the upshot is we are seeing policymakers take deliberate steps to enable freedoms of the vaccinated
– limit the freedoms of those unvaccinated
Clearly, the policymaker and public view towards non-vaccinated has changed. One from empathy towards exclusion. We are not saying this is good policy, but it is the direction of policy.
South Korea develops contactless COVID-19 testing booth = brilliant
A South Korea hospital has developed a COVID-19 testing booth that is contactless:
– booth is self-contained
– holding only the possibly infected
– nurses and doctors interact via “gloves through glass” or via telemedicine

This is actually a practical idea as medical workers no longer need to put on special gear and outfits. As the article above notes, this reduces the level of burden for the staff but provides a completely clean and safe setup:
– the goal is to create a mobile setup
– this reminds us of the Seinfeld, ‘the bubble boy’ episode (Season 4, Episode 7)
If you don’t remember that episode, below is a screenshot.

STRATEGY: Central view remains “everything rallies” into YE
We continue to see improving conditions supporting an “everything rallies” into YE. But central to this is an expectation is the following conditions:
– Delta variant peaks soon
– No Fall wave
– No Asia panic/massive COVID-19 wave
– 10-year stabilizes/rises
– US economic momentum strengthens as “delta panic” fades
– White House/ Congress pass infrastructure
– No Fed surprises –. key
– Seasonals kick in
As we said in July, we viewed the Delta variant as “more bark than bite” and this indeed seems to be the case. And one of the key issues into YE is the COVID-19 pandemic does not flare up in a way that disrupts the global economy.
…Inflation creates market reaction, but the larger fractal suggests inflation might undershoot consensus
Markets will continue to be reactive to inflationary risks — this is something investors have historically shown a “hair trigger” and in this post-pandemic recovery, the market’s sensitivity is even greater, given the further noise created by supply chain disruptions and shortages.
– on Thursday, the PPI (producers price index) came in above expectations at 1.0% month over month, vs 0.5% Street
– this offset the softer CPI (consumer price index) reading Wednesday 0.3% m/m vs Street 0.4%
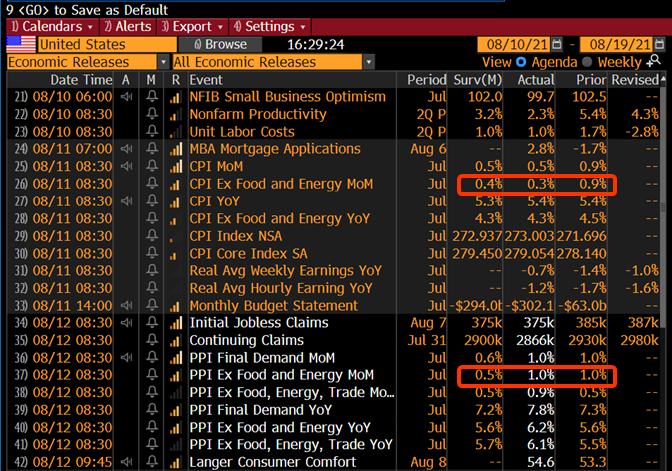
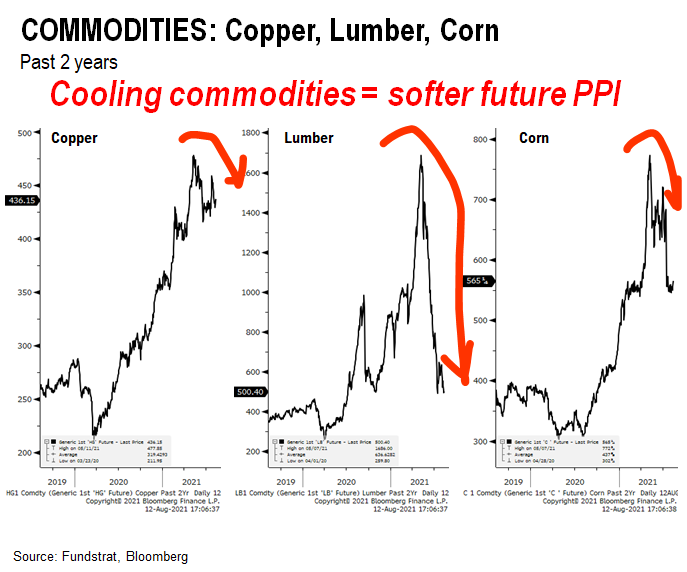
But as much as markets reacted strongly to the “hot” PPI reading, the most recent PPI readings are reflecting surging commodity costs with a lag. As shown below, copper, oil, lumber and corn have been rising for some time. Thus, the fact these are reflected in PPI now is not surprising.
– however, these commodities are beginning to soften
– so we should see softening of these stronger PPI readings in coming months
…Epicenter likely to lead the “everything rallies into YE”
Our rationale for recommending Epicenter stocks is shown below. Post-pandemic drivers favor Epicenter, particularly if we are going full risk-on.
– the key inflection in the past 10 days is the reversal higher in interest rates
– this becomes a big tailwind for Financials
– this also is a tailwind for Energy XLE 0.13% OIH 0.88% (see note from Tuesday)
– we still like FAANG because there is a pro-cyclical element to FAANG
– there is also a catch-up trade for AMZN 0.27% AAPL 0.62% which are up a mere 2%/9% versus 18% for S&P 500

…and key groups are indeed turning higher
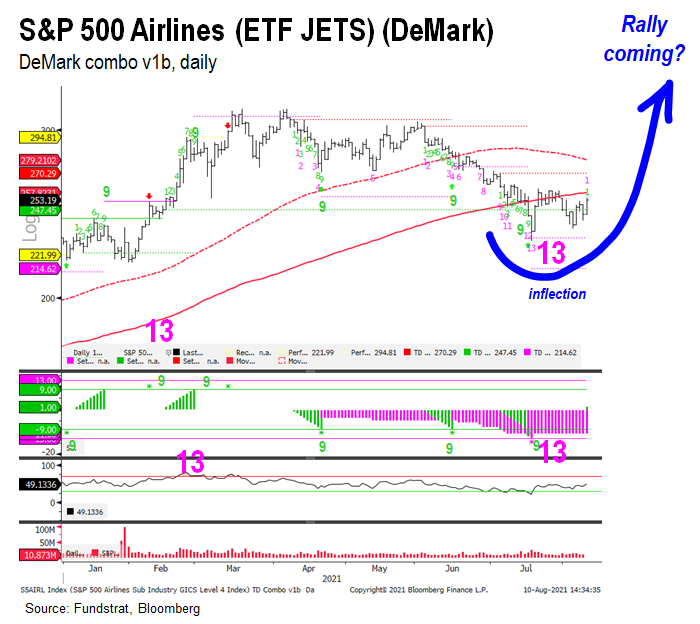
As we flagged last week, 3 key groups are also inflecting higher. The 3 charts are shown below in sequence:
– China MCHI -0.48% has inflected higher
– Airlines JETS 0.95% and nearing the 200D
– Casinos BETS and showing an impulsive rally higher
These were among the first groups to sell-off, peaking between February and April. Thus, their reversal higher is a sign of renewed Epicenter leadership.

__________________________
26 Granny Shot Ideas: We performed our quarterly rebalance on 07/30. Full stock list here –> Click here
___________________________
POINT 1: Daily COVID-19 cases 111,415, up +18,350 (ex-FL&NE) vs 7D ago… 7D delta has turned downwards for 4 days… Daily cases could roll over soon…
_____________________________
Current Trends — COVID-19 cases:
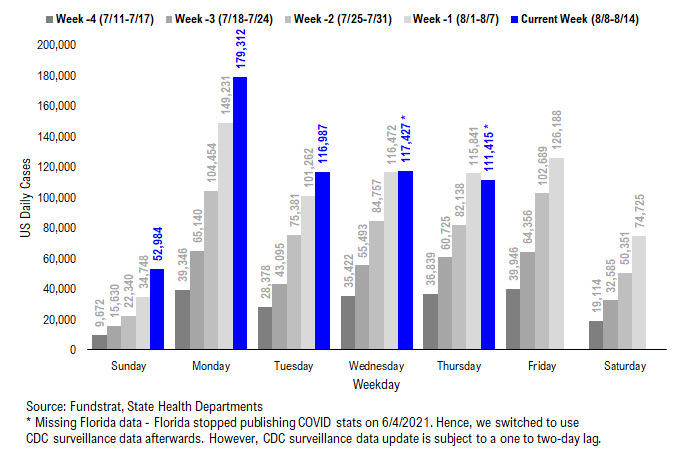
– Daily cases 111,415 vs 115,841 7D ago, down -4426
– Daily cases ex-FL&NE 111,415 vs 93,065 7D ago, up +18,350
– 7D positivity rate 8.7% vs 8.4% 7D ago
– Hospitalized patients 73,762, up +25% vs 7D ago
– Daily deaths 454, down -0.1% vs 7D ago
_____________________________
*** Florida and Nebraska stopped publishing daily COVID stats updates on 6/4 and 6/30, respectively. We switched to use CDC surveillance data as the substitute. However, since CDC surveillance data is subject to a one-to-two day lag, we added a “US ex-FL&NE” in our daily cases and 7D delta sections in order to demonstrate a more comparable COVID development.
The latest COVID daily cases came in at 111,415, up +18,350 (ex-FL&NE). The most important metric we are watching closely this week is the 7D delta in daily cases. As suggested by its name, the 7D delta in daily cases measures the rate of change in the daily case count after eliminating the weekly seasonality. Over the past 4 days, the 7D delta in daily cases trend has turned downwards, which means the speed of the case rise has slowed and daily cases could roll over soon. Hence, although the case figure could continue to rise for another 7-10 days (based on current change in 7D delta), we have seen the glimmer of hope for the case figures to apex.
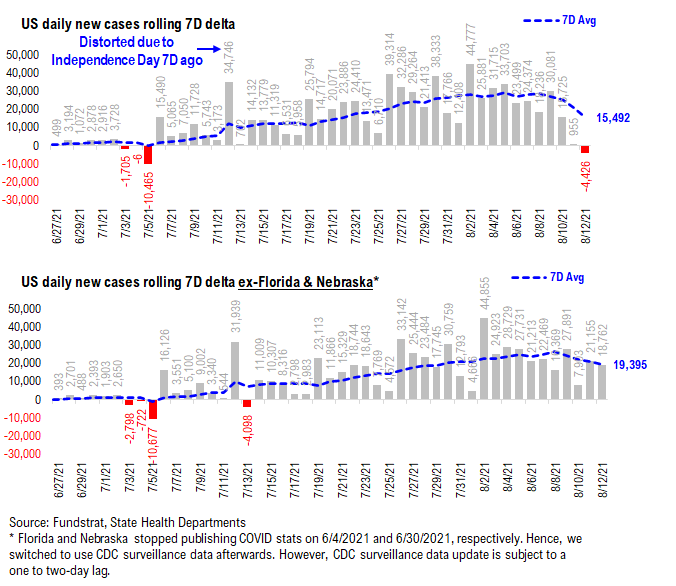
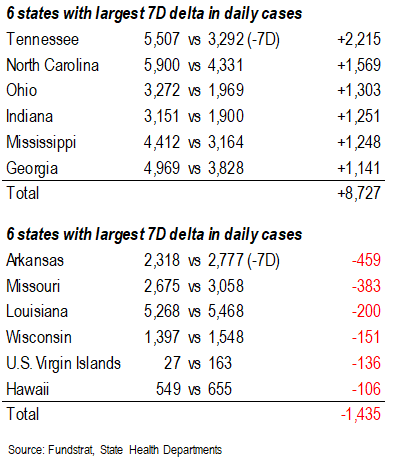
7D delta in daily cases is rolling over now…
As shown in the chart below, the 7D delta in daily cases seems to roll over now – down from ~26,000 four days ago to current level at 19,395. If this speed of decline persists, we could see a negative 7D delta in 7-10 days. And a negative 7D delta indicates the daily cases “officially” roll over.
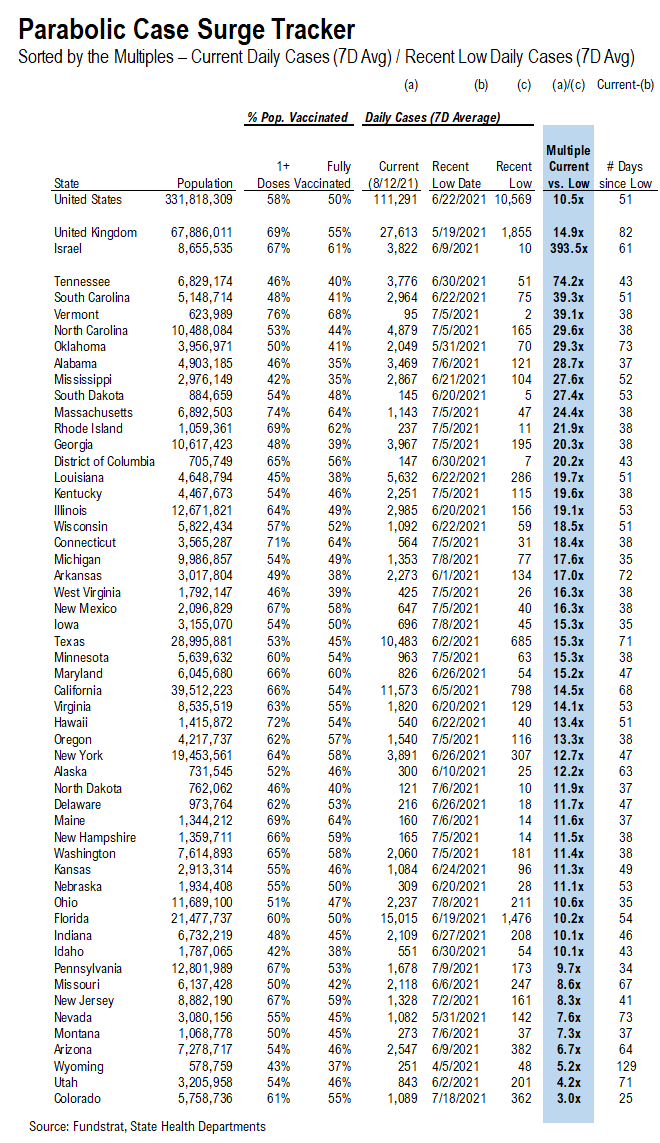
Low vaccinated states seem to have a larger increase in daily cases compared to their recent low…
Below, we added a new section called “Parabolic Case Surge Tracker” to monitor the possible parabolic surge in daily case figures. In the table, we included both the vaccine penetration and the recent case trend for 50 US states + DC. The table is sorted by the multiple of their current daily cases divided by their recent low in daily cases.
– The states with higher ranks are the states that have seen a more significant rise in daily cases
– We also calculated the number of days between now and the recent low date; a state with a high multiple but low number of days since its low means the state is facing a relatively rapid surge in daily cases
– The US as a whole, UK, and Israel are also shown at the top as a reference
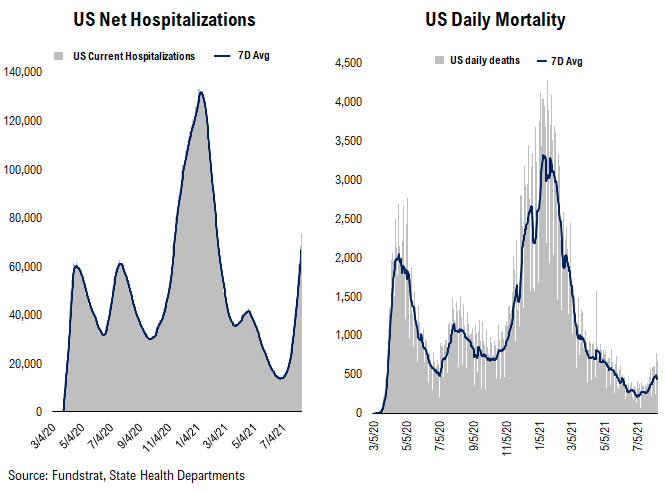
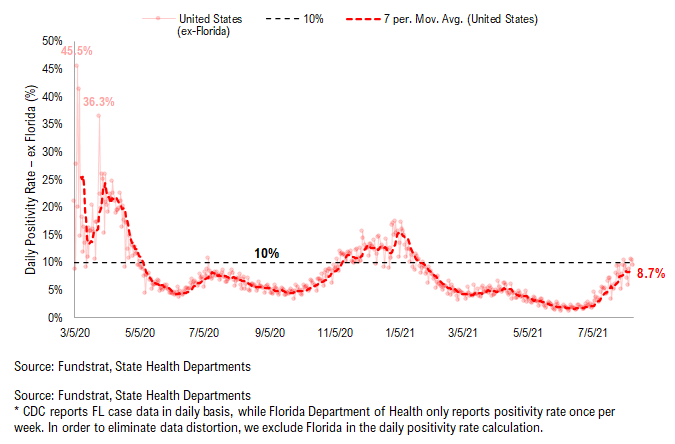
Hospitalization and positivity rate continue rising… Daily deaths is also trending upwards now…
Below we show the aggregate number of patients hospitalized due to COVID, daily mortality associated with COVID, and the daily positivity rate for COVID.
As you can see, hospitalization and positivity rate have exceeded the peak level we’ve seen in April’s “mini” wave. Daily deaths have been trending upwards recently, but far less “dramatic” than the cases or hospitalization trends.

POINT 2: VACCINE: vaccination pace has been gradually rising over the past four weeks… Over half of Americans are fully vaccinated…
_____________________________
Current Trends — Vaccinations:
– avg 0.7 million this past week vs 0.7 million last week
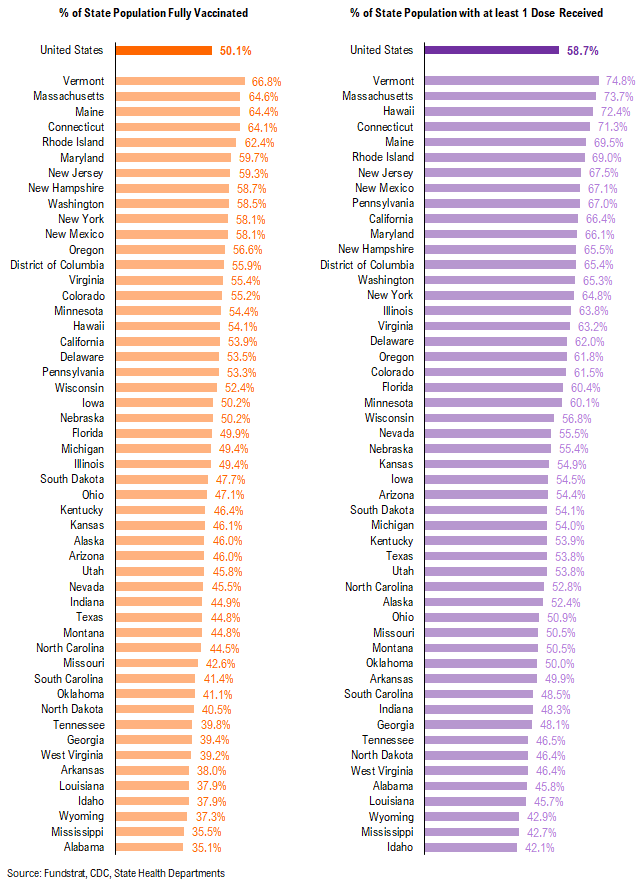
– overall, 50.1% fully vaccinated, 58.7% 1-dose+ received
_____________________________
Vaccination frontier update –> all states now near or above 80% combined penetration (vaccines + infections)
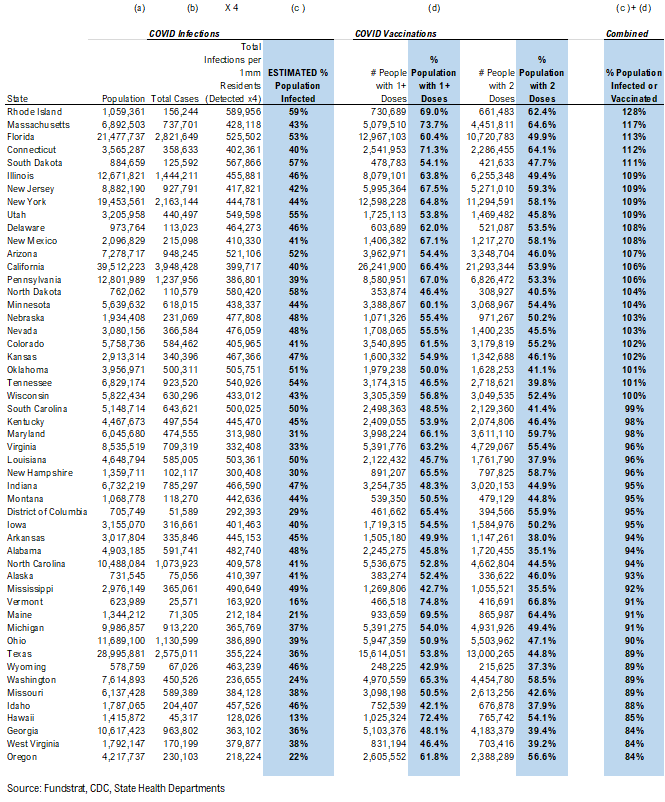
Below we sorted the states by the combined penetration (vaccinations + infections). The assumption is that a state with higher combined penetration is likely to be closer to herd immunity, and therefore, less likely to see a parabolic surge in daily cases and deaths. Please note that this “combined penetration” metric can be over 100%, as infected people could also be vaccinated (actually recommended by CDC).
– Currently, all states are near or above 80% combined penetration
– RI, MA, SD, CT, NJ, IL, NY, DE, NM, UT, PA, ND, AZ, MN, CA, FL, NE are now above 100% combined penetration (vaccines + infections). Again, this metric can be over 100%, as infected people could also be vaccinated. But 100% combined penetration does not mean that the entire population within each state is either infected or vaccinated.
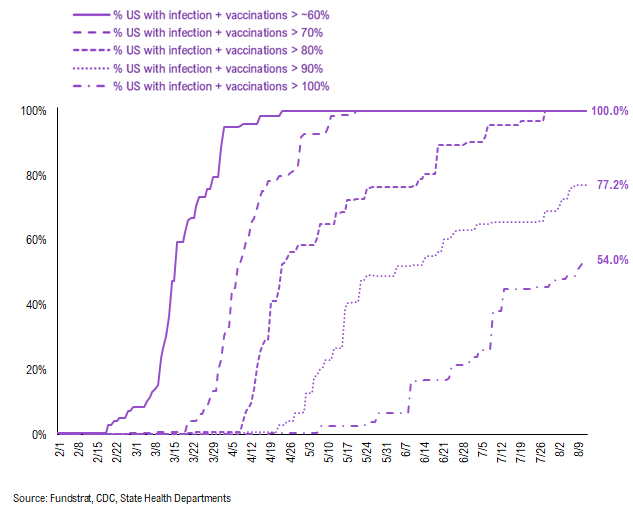
Below is a diffusion chart that shows the % of US states (based on state population) that have reached the combined penetration >60%/70%/80%/90%/100%. As you can see, all states have reached 80% combined vaccination + infection. 77.2% of US states (based on state population) have seen combined infection & vaccination >90% and 54.0% of US states have seen combined infection & vaccination >100% (Reminder: this metric can be over 100%, as infected people could also be vaccinated. But 100% combined penetration does not mean that the entire population within the state is either infected or vaccinated).
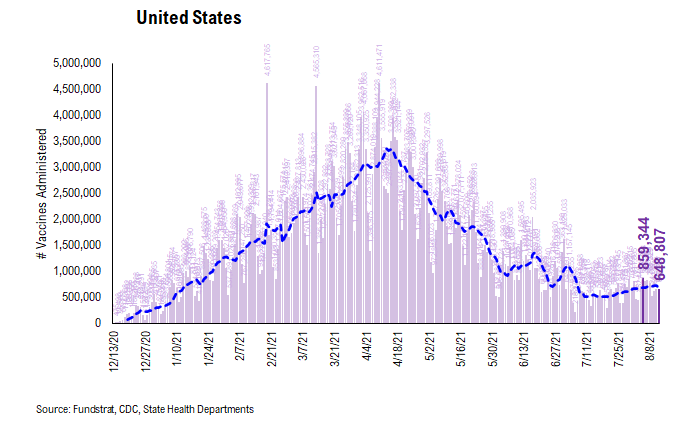
There were a total of 648,807 doses administered reported on Thursday. The vaccination pace has slowly improved over the past four weeks. It seems that people are becoming more inclined to get vaccinated over growing Delta variant concerns. Especially, the states with lower vaccine penetration appear to have a greater improvement.
As we noted above, NYC and San Francisco is now requiring or will start to require proof of vaccination for several activities: indoor dining, indoor fitness, and so on. More cities or local governments could follow and implement similar requirements. Although vaccine hesitancy is not easy to fade, these new rules could push more people to get vaccinated.
53.1% of the US has seen 1-dose penetration >60%…
To better illustrate the actual footprint of the US vaccination effort, we have a time series showing the percent of the US with at least 45%/45%/50% of its residents fully vaccinated, displayed as the orange line on the chart. Currently, 88.8% of US states have seen 40% of their residents fully vaccinated. However, when looking at the percentage of the US with at least 45% of its residents fully vaccinated, this figure is 69.7%. And only 46.1% of US (by state population) have seen 50% of its residents fully vaccinated.
– While 85.0% of US states have seen vaccine penetration >50%, 56.3% of them have seen 1 dose penetration >55% and 53.1% of them have seen 1 dose penetration > 60%.
– 88.8% of the US has at least 40% of its residents fully vaccinated, However, only 69.7% of US has fully vaccinated >45% and 46.1% of US has fully vaccinated >50%.

This is the state by state data below, showing information for individuals with one dose and two doses.
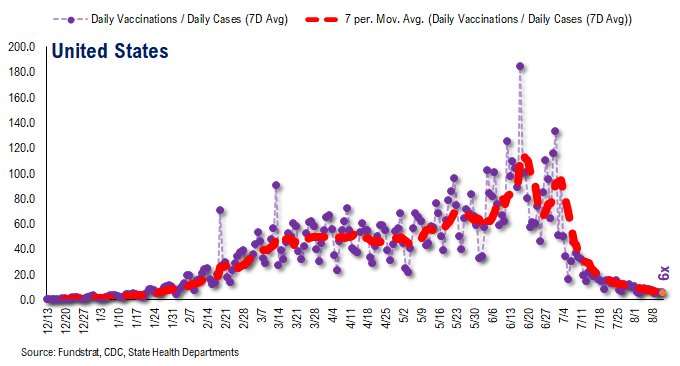
The ratio of vaccinations/ daily confirmed cases has been falling significantly (red line is 7D moving avg). Both the surge in daily cases and decrease in daily vaccines administered contributed to this.
– the 7D moving average is about ~10 for the past few days
– this means 10 vaccines dosed for every 1 confirmed case
In total, 352 million vaccine doses have been administered across the country. Specifically, 195 million Americans (59% of US population) have received at least 1 dose of the vaccine. And 166 million Americans (50% of US population) are fully vaccinated.

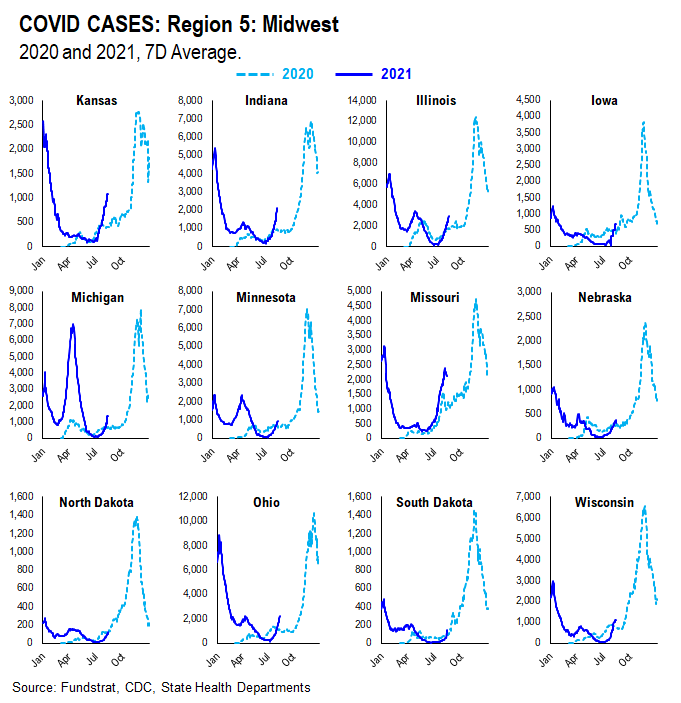
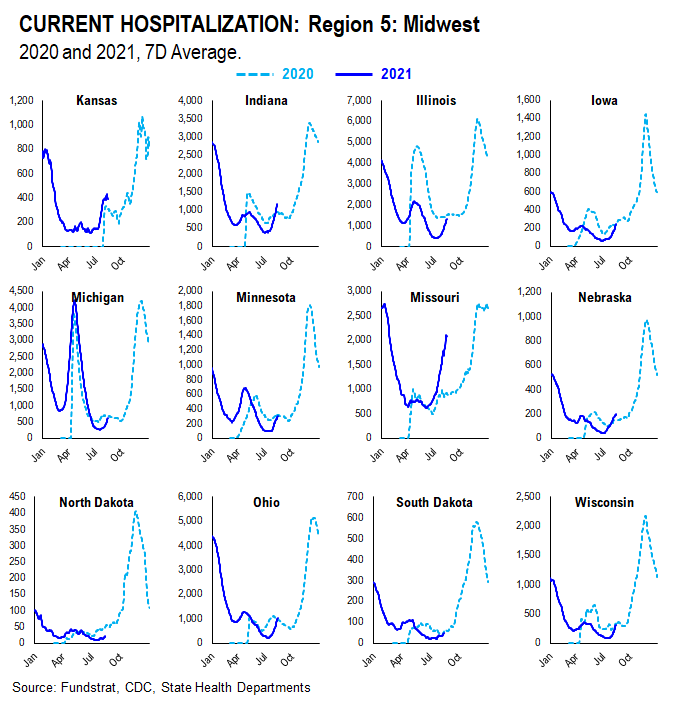
POINT 3: Tracking the seasonality of COVID-19
In July, we noted that many states experienced similar case surges in 2021 to the ones they experienced in 2020. As such, along with the introduction of the more transmissible Delta variant, seasonality also appears to play an important role in the recent surge in daily cases and hospitalization. Therefore, we think there might be a strong argument that COVID-19 is poised to become a seasonal virus.
The possible explanations for the seasonality we observed are:
– Outdoor Temperature: increasing indoor activities in the South vs increasing outdoor activities in the northeast during the Summer
– “Air Conditioning” Season: similar to “outdoor temperature”, more “AC” usage might facilitate the spread of the virus indoors
If this holds true, seasonal analysis suggests that the Delta spike could roll over by following a similar pattern to 2020.
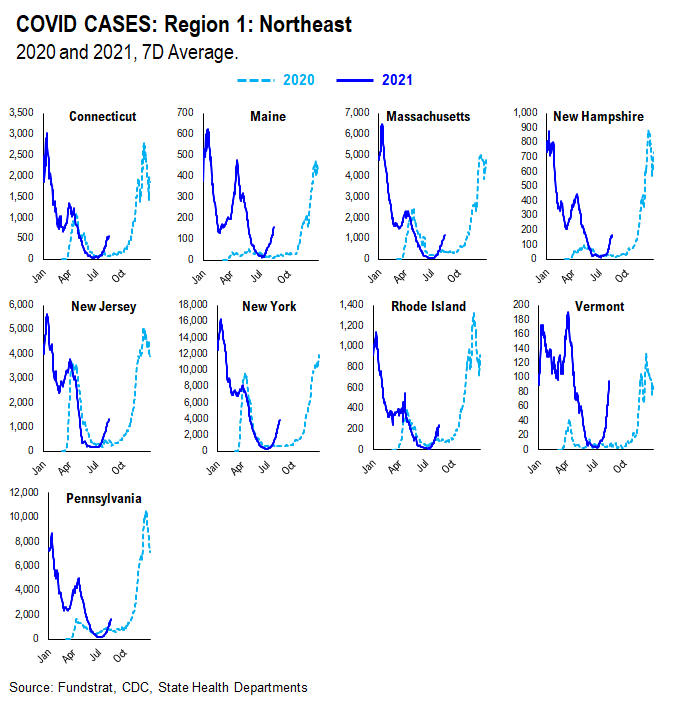
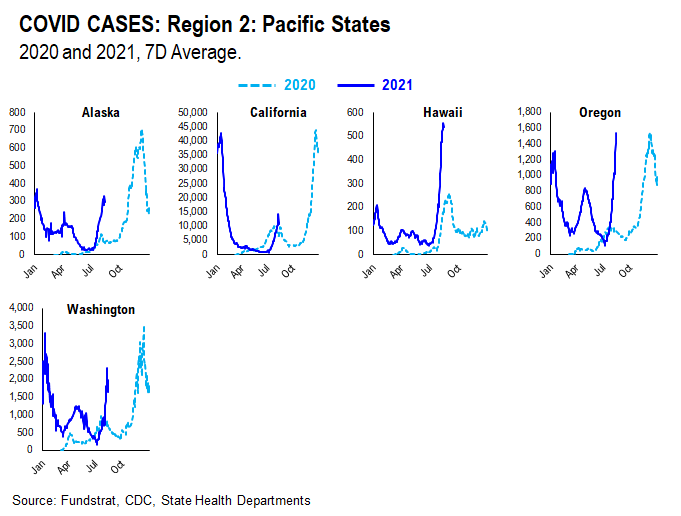
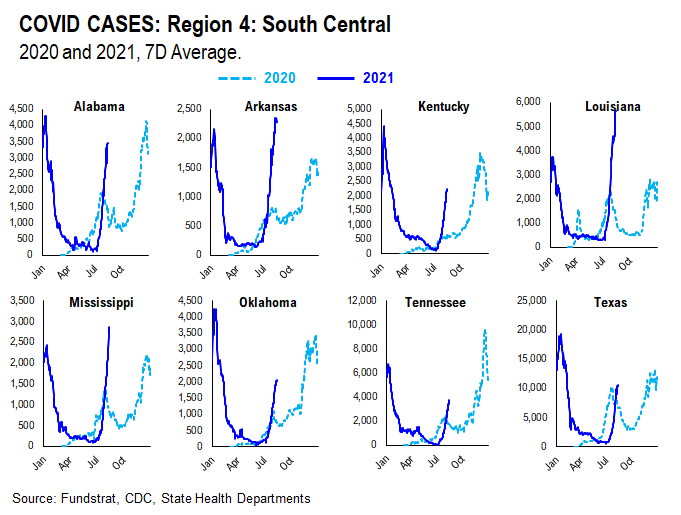
We created this new section within our COVID update which tracks and compare the case and hospitalization trends in both 2020 and 2021 at the state level. We grouped states geographically as they tend to trend similarly.
CASES
It seems as if the main factor contributing to current case trends right now is outdoor temperature. During the Summer, outdoor activities are generally increased in the northern states as the weather becomes nicer. In southern states, on the other hand, it becomes too hot and indoor activities are increased. As such, northern state cases didn’t spike much during Summer 2020 while southern state cases did. Currently, northern state cases are showing a slight spike, especially when compared to Summer 2020. This could be attributed to the introduction of the more transmissible Delta variant and the lifting of restrictions combined with pent up demand for indoor activities.


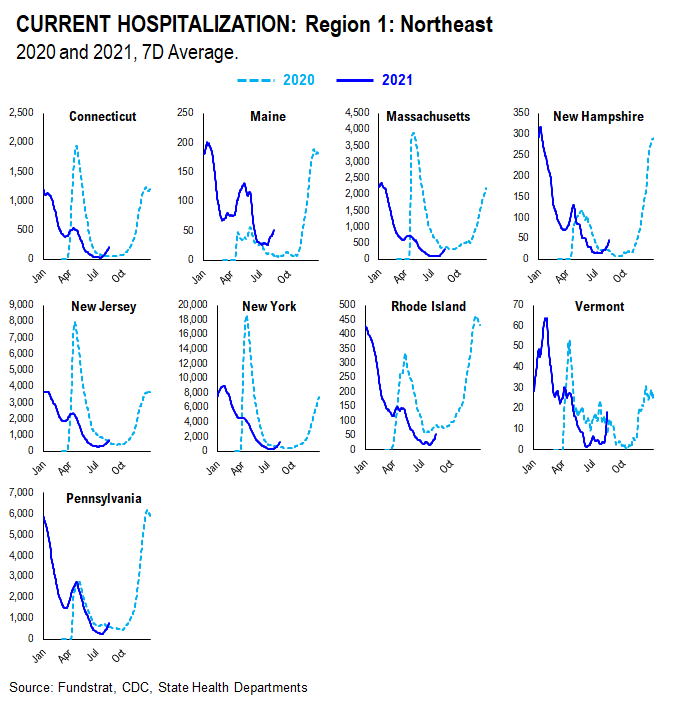
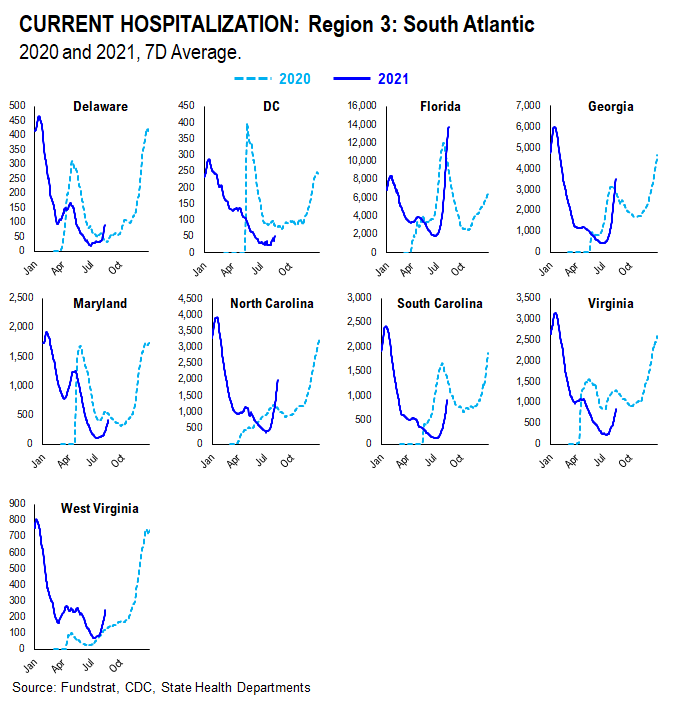
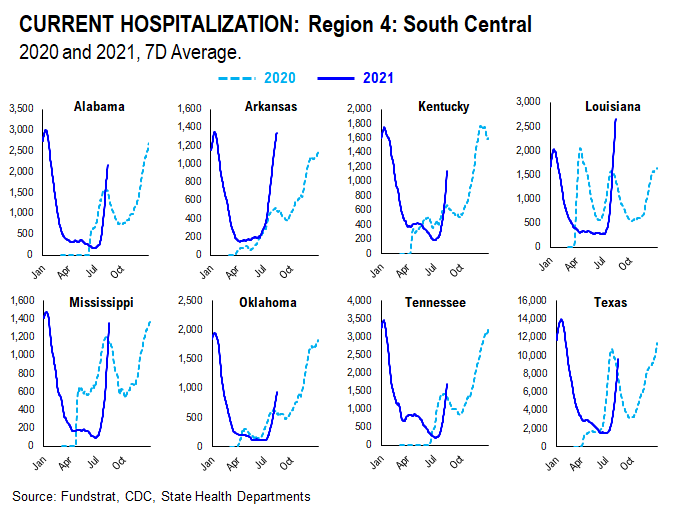
HOSPITALIZATION
Current hospitalizations appear to be similar or less than Summer 2020 rates in most states. This is likely due to increased vaccination rates and the vaccine’s ability to reduce the severity of the virus.


More from the author
Articles Read 1/2
🎁 Unlock 1 extra article by joining our Community!
Stay up to date with the latest articles. You’ll even get special recommendations weekly.
Already have an account? Sign In 6ef4ab-5582a0-f4f846-a72a13-201262
Already have an account? Sign In 6ef4ab-5582a0-f4f846-a72a13-201262

