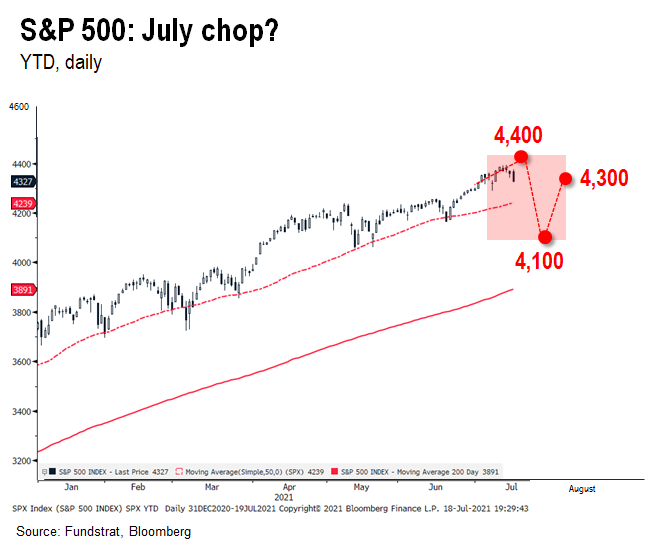
Delta variant sure has a lot of "bark but hardly any bite" -- contributing to July chop, but ultimately creates great setup 2H rally

Click HERE to access the FSInsight COVID-19 Daily Chartbook.
We are shifting to a 4-day a week publication schedule:
- Monday
- Tuesday
- Wednesday
- SKIP THURSDAY
- Friday
STRATEGY: Delta variant triggering “July chop” but “bark worse than bite”
…USA cases are rising but not really parabolic, more barely linear
At the moment, the delta variant is causing a rise in USA cases, but this rise is not exactly parabolic. The latest cases figures for USA:
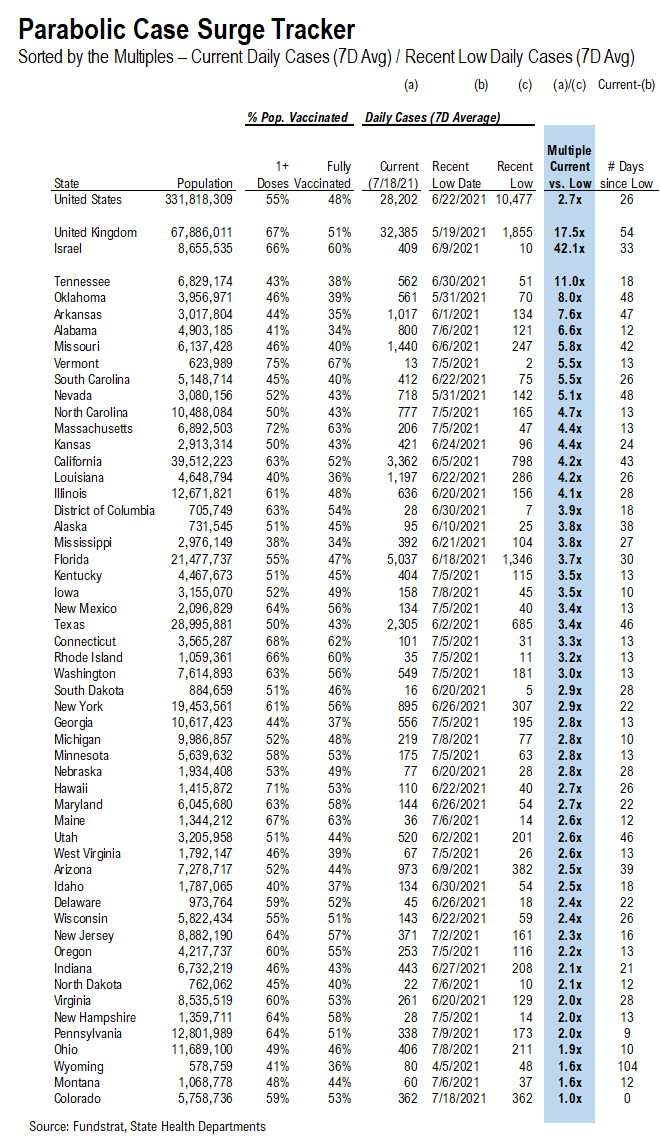
– USA cases +28,202 (2.7X vs low)
– UK cases +32,385 (17.5X vs low)
– Israel case +409 (42.1X vs low)
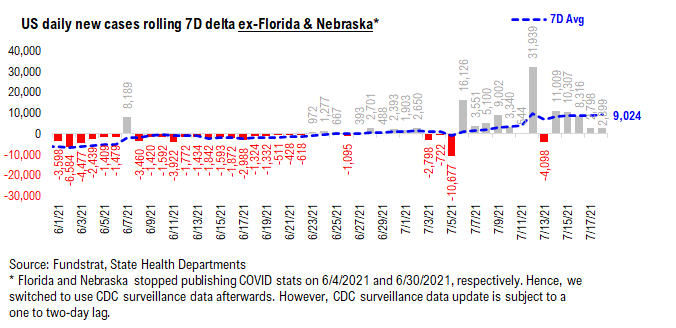
As you can see below, the 7D delta in USA cases are up, but not really gaining that much momentum. The future is uncertain, so it could rise rapidly, but it is modest so far.
…Delta variant has a lot of “Bark”, and it is unnerving markets
At the end of June, we had warned that we saw “July chop” coming. We had cited multiple factors at the time, but the three primary drivers were:
– Delta variant could lead to a parabolic rise in USA cases to possibly 100,000 –> ~10X to match UK surge
– Since 1928, strong 1H, particularly >13% leads to flat/down July, with half instances 3-5% declines
– Anecdotally, clients were telling us pundits expected strong July given typical seasonals –> counter-trade consensus
And while S&P 500 is actually up 0.7% for July, this belies the violent sector rotations taking place within the broader market. We are at the midpoint of the month, and many of our clients can attest that this been an extremely choppy month. In fact, equity markets have hardly responded to the fundamentally strong 2Q2021 results.
Delta variant triggers fear of Wave 4 –> more “bark than bite”
But of the 3 factors, the most significant, in my opinion, is the surge in cases associated with the Delta variant. Nations around the world are seeing a parabolic rise in cases. And this raises the specter the world is facing Wave 4 of COVID-19. That is, instead of COVID-19 retreating with the surging penetration of vaccinations, COVID-19 mutations are making this disease more transmissible again.
Why would Delta create panic?
– Parabolic case rise –> cases tends to be market focus
– Low VAX nations –> Australia, Indonesia, Thailand, Japan, etc are forced to use lockdowns
– USA Un-vaxxed –> as many as 82 million Americans are not vaxxed/never infected
…In USA, vulnerable populations Vaxxed, hospitalizations are not surging
Yes, there are policy dilemmas being created due to the Delta variant spread (there are others too). COVID-19 is a serious health risk, butwe think there are multiple reasons to mitigate our concerns:
– the vulnerable populations in the US (and rest of World) have been vaccinated
– vaccinated persons have far lower risk of severe outcomes
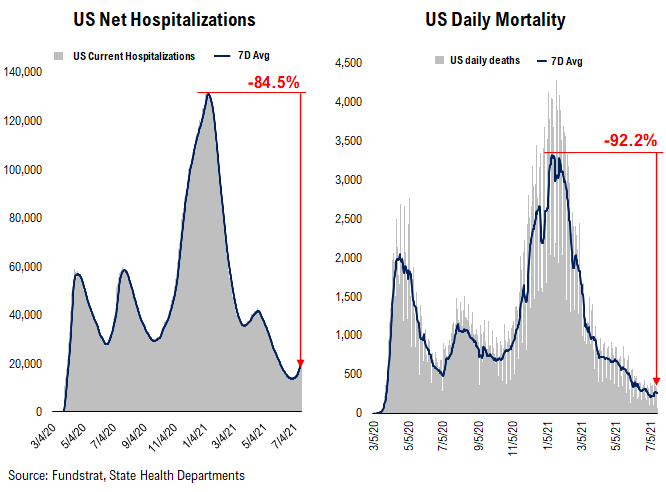
– hospitalizations are hardly tracking the rise in cases –> true in UK, India and USA
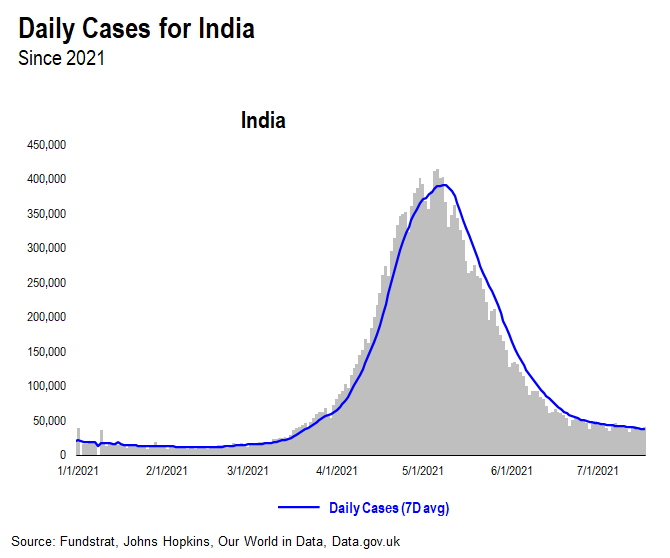
– Most importantly, India, where the Delta variant first detected, has been able to contain COVID-19 spread
The last point is key. If India has seen cases rollover, I think the odds of the USA and rest of World containing the spread from delta variant is quite strong.
– if India saw cases peak within 4-6 weeks from initial surge
– we expect USA, UK and Israel to see similar trajectories
– USA cases likely peak sometime in August
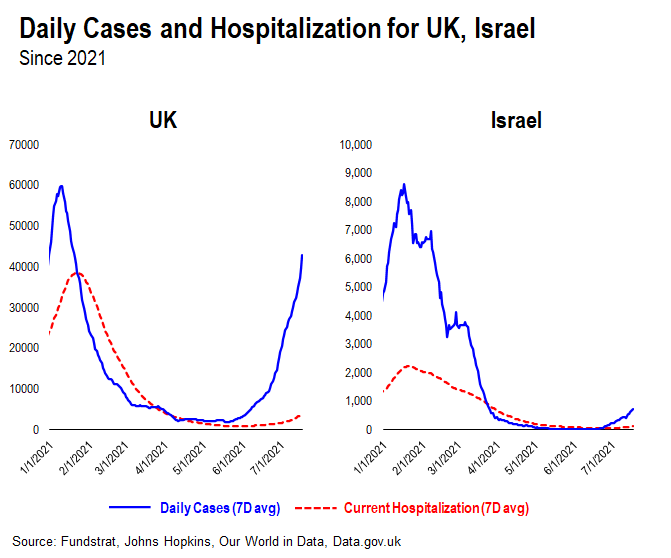
…Little “bite” from Delta variant in UK and Israel experience
And while it might seem like we are belaboring this point, see how hospitalizations have sharply trailed the rise in COVID-19 cases for both Israel and the UK.
– Israel, in fact, has seen a modest rise in cases compared to UK
– Israel virtually no rise in hospitalizations
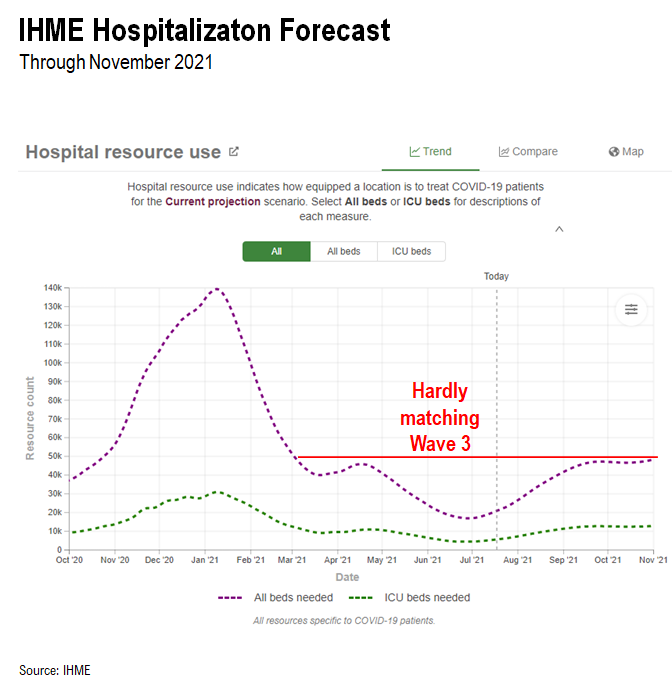
…IHME model forecasts USA modest rise in hospitalizations, far short of Wave 3 peak of 140,000
As many of our clients know, we have found the forecasts of the IHME (Institute of Health Metrics) useful. The IHME models are used by policymakers around the world including the White House. Below is their last forecast for hospitalizations:
– Hospitalizations forecast to rise to 40,000 by November 2021
– This falls way short of the 140,000 figure seen in January 2021
– But is up from 15,000 in July 2021
The IHME is indeed forecasting more Americans getting hospitalized due to the Delta variant. However, this is hardly matching the surge seen in Wave 3 of COVID-19. And as many recall, the healthcare severity of Wave 3 fell far short of Wave 1 and 2.
One reason for this is the USA vaccination made early efforts to target the vulnerable populations:
– Elderly Americans
– Americans with pre-existing conditions such as obesity, diabetes, and other risk factors
In fact, this NY Post article below reminds us that protecting the vulnerable is the most important action. And this effort has been a success in the US. According to the American Diabetes Association:
– Diabetics ~40% of USA COVID-19 deaths
– Diabetics are 10% of the overall population
Hence, the risks of severe outcomes are lower in the USA, simply because of the early vaccine targeting.
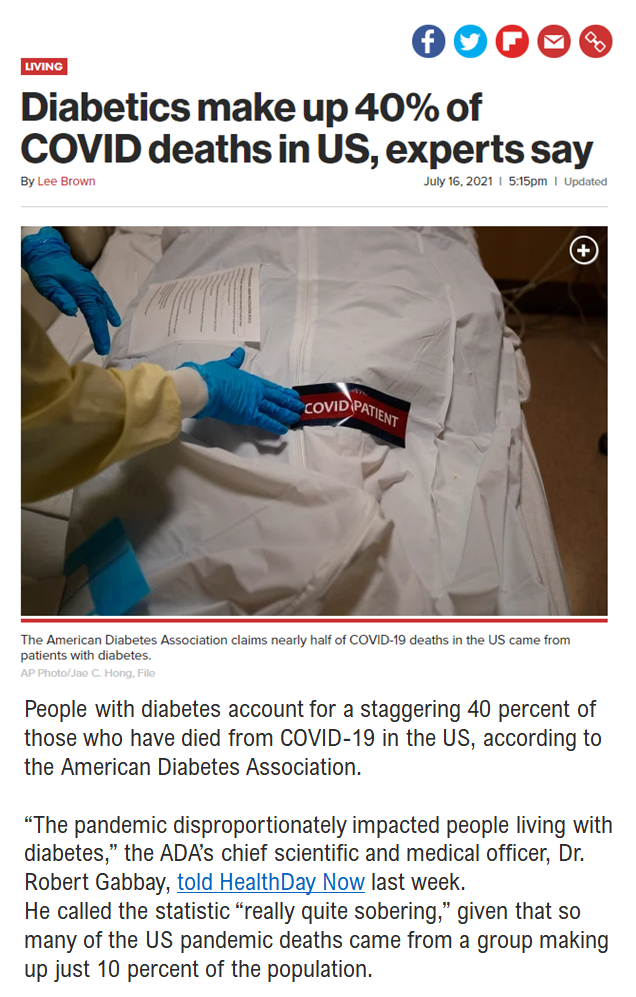
Source: https://nypost.com/2021/07/16/diabetics-make-up-40-of-covid-deaths-in-us-experts-say/?utm_campaign=iphone_nyp&utm_source=com.slack.slackmdm.share
…USA still has an issue with “unvaxxed Americans” but that is a choice
The tweet from State of Alabama Public Health speaks volumes (see below).
– 96% of COVID-19 deaths in past 3.5 months are people not “fully vaccinated”
– conversely, vaccinated Alabamans are 4% of deaths in past 3.5 months
The unvaxxed are facing substantial risks in USA. I realize this is a choice one makes. But the healthcare risks are high for certain cohorts of America.

96.2 percent of deaths from COVID19 in the past nearly three and one-half months in the state have occurred in people who were not fully vaccinated. Read our full NewsRelease at https://t.co/PrAaT9M7aQ. pic.twitter.com/qzCQ8JtwgS
— Alabama Public Health (@ALPublicHealth) July 13, 2021
STRATEGY: July chop ultimately a great set-up for risk assets to rally in 2H2021
Well, we know that markets will get choppy when COVID-19 cases surge.
– That is the first order reaction
– Investors fear an echo of past waves
– Hence, markets find footing when cases stabilize
– Or when markets get “de-sensitized” to cases (not yet)
We don’t expect this period of chop to lead to a larger 10%-like decline for markets. Sure, a 3%-5% sell-off, even to S&P 500 4,100 is possible. But before one gets too bearish and thinks a large sell-off is underway, consider:
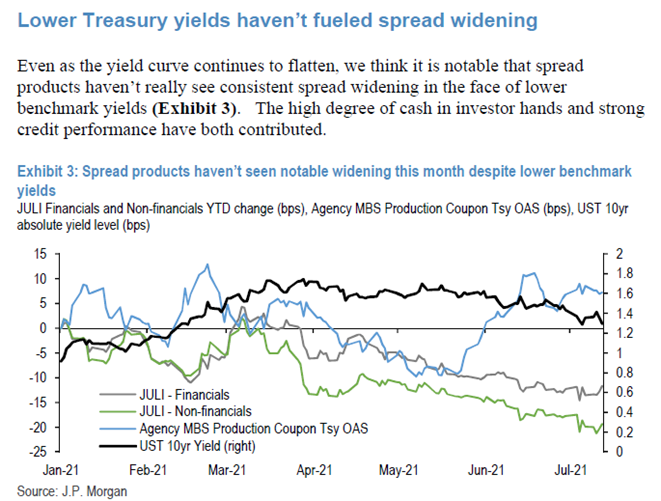
– bond spreads stable –> good for stocks
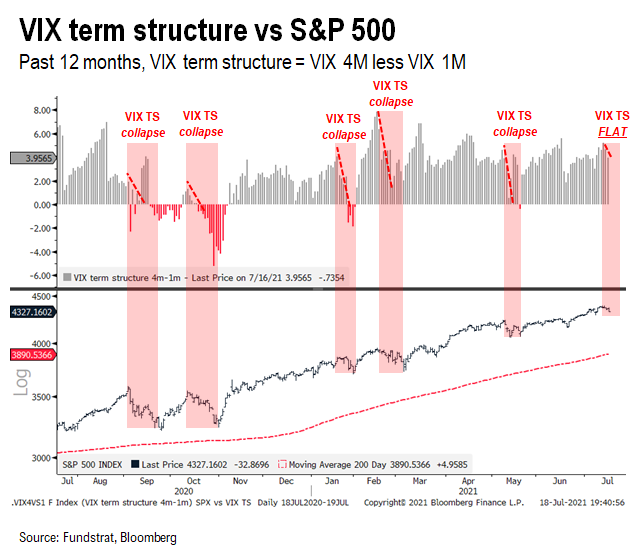
– VIX term structure barely impacted –> not signaling broader weakness
As noted by JPMorgan US Fixed Income teams, bond spreads (vs Treasuries) have been stable. This is a surprise given the immense chop seen in equity markets in the past two weeks.
And we also highlight the variant signal from the VIX term structure. The VIX term structure (TS) is the spread between VIX 4M contract less 1M contract. This should normally be a positive spread (contango) but when a correction looms, the VIX TS inverts of collapses:
– in the past 5 market wobbles
– VIX TS collapsed, even went negative
– current VIX TS has been very stable the past two weeks (see below)
…Sector rotation into Defensives/Growth –> Energy stocks clobbered in the past week
Still, the shift in sector leadership has been pronounced. Again, a few weeks ago, we warned clients about the possibility that USA COVID-19 cases could surge to 100,000 or more on the heels of the Delta variant.
But we have been surprised by the extent of the market rotation:
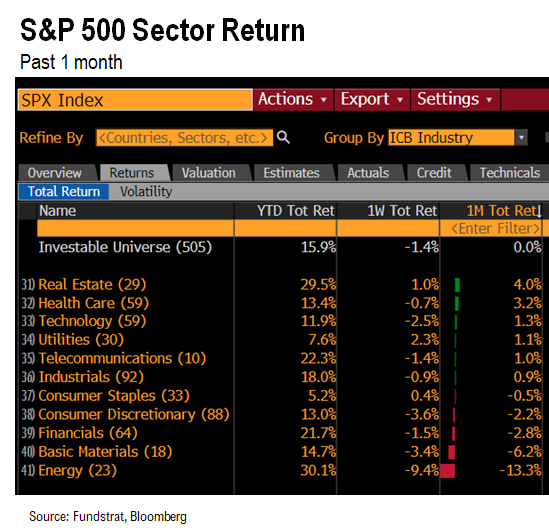
– Epicenter trades like Energy, Basic Materials have been massacred
– Healthcare and Real Estate surged in July
Thus, investors have made a violent rotation out of Epicenter into Growth. This move has been amplified by the flattish behavior of interest rates.
SECTOR STRATEGY: Still see 2H2021 being led by Epicenter and FAANG
As violent as this market rotation has been, we do not believe July marks a turn in the overall market leadership. This is a vicious correction and natural risk-off (given COVID-19 surge).
For 2H2021, we see leadership from Sectors benefitting from:
– “revenge” spending by consumers
– “revenge” capex + buybacks by corporates
– global economic recovery strengthening as vaccine penetration rises
– global confidence recovering as Delta variant wanes
– US major infrastructure spending in 2021/2022
– dovish Fed
Thinking of the above, this is why we are still overweighting Epicenter stocks and also FAANG. We have written multiple analyses and rationale for this, so we will not belabor this Monday given the already lengthy message we have already written.
Energy stocks hit hardest, de-coupling from oil
The most puzzling weakness, in our view, is the crash in Energy stocks.
– Energy stocks down -9% in past week
– Energy stocks down -13% in the past month
– Oil down -4% in the past month
Energy stocks will be more volatile than oil, as the Energy stocks reflect additional impacts that are not reflected in the price of oil:
– expectations of future conditions
– impacts from broader equity market movements
– effects from shareholder dynamics –> is the group over-owned or under-owned
– company specific factors
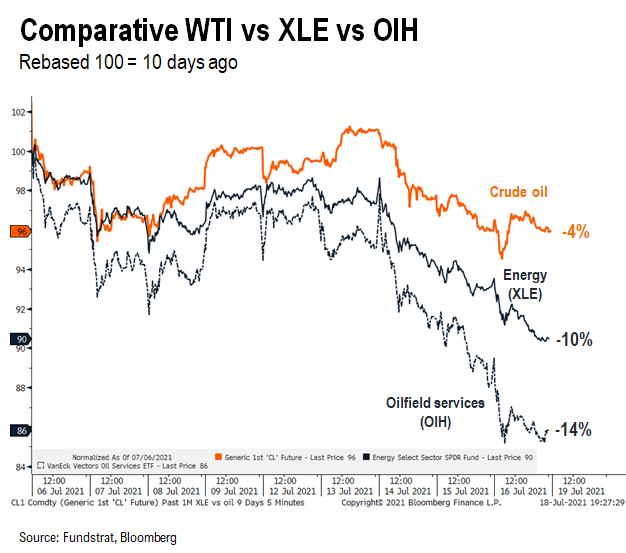
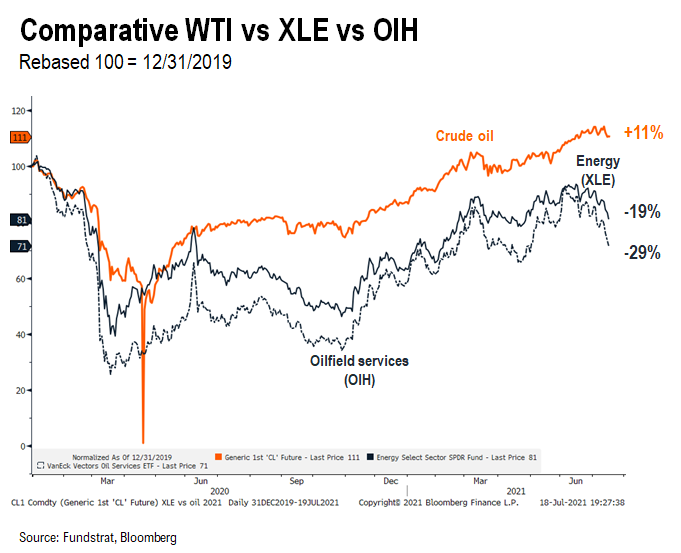
This is not a complete list, but these factors can cause Energy stocks to de-couple from oil. The magnitude of de-coupling is “eye-popping”
– in the past 10 days
– Oil is down -4%
– Energy stocks down -10%
– Oilfield Services down -14%
– in the past 18 months
– Oil is up +11%
– Energy stocks down -19%
– Oilfield Services down -29%
…Delta variant “bark” and July chop seems to explain this sell-off
The linkages between Oil and Energy stock have been pretty tight and seemingly diverged sharply in the past two weeks. Energy stocks have been leading equities in 2021 so far, and even with this sell-off, are still the best performing sector YTD up +29%.
Given the July chop and the associated de-risking associated with the Delta variant, we think investors are backpedaling on the exposure. This is the predictable result of the surge in Delta variant cases.
But as we noted in our earlier discussion, we view this more as a case of bark than bite. Delta variant is not, in our view, going to lead to:
– rollback in re-opening
– nor reduce the “revenge” activity by households
But it is causing investors to get nervous.
In our view, this is a set up for very favorable risk rally. I don’t think July chop is ending this week. But we would not be selling Epicenter stocks here. Nor do we think Energy stocks are entering a renewed downtrend. Rather, this is a healthy correction after a very strong 1H2021.
Tactically speaking, we will be watching for signs of an imminent reversal in the broader markets and within sectors. But the over-arching message, in our view, is:
– Delta “bark getting louder” next few weeks
– but has little bite
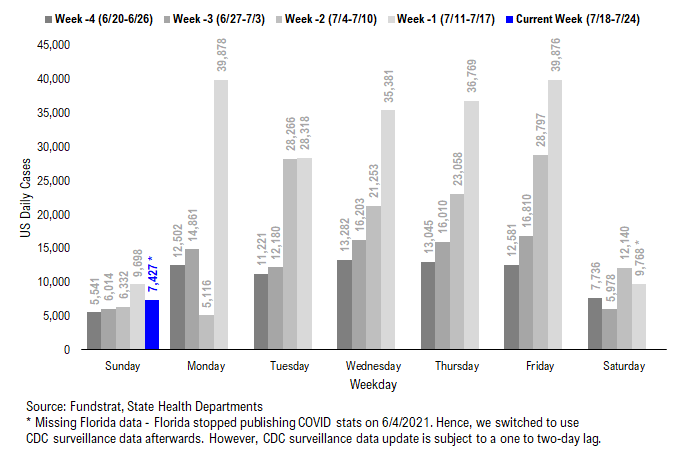
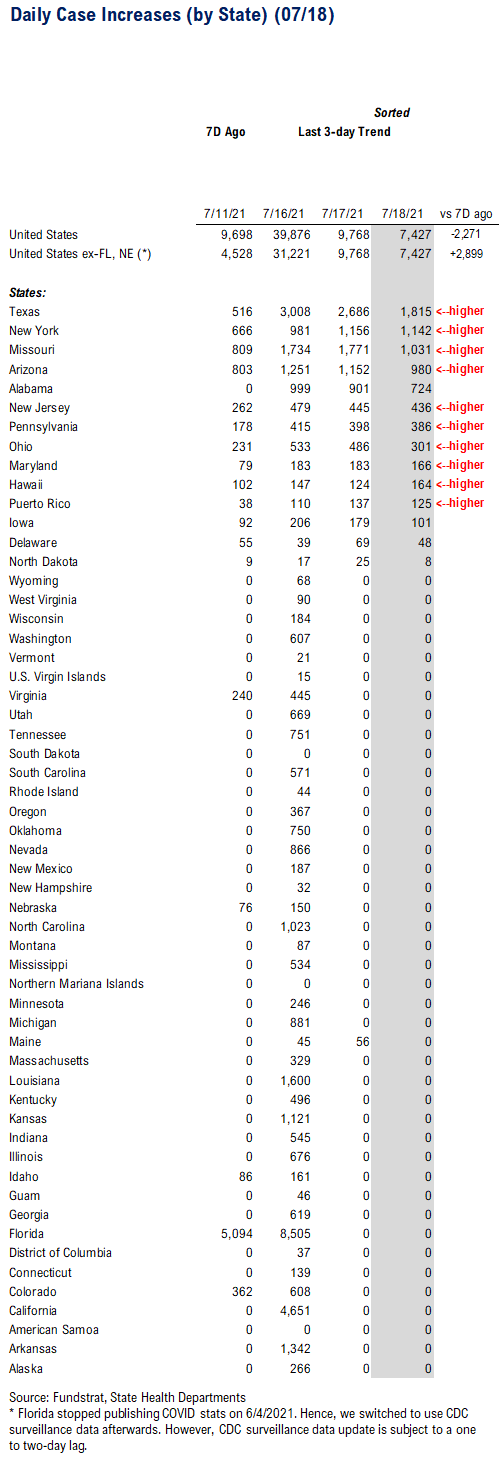
POINT 1: Daily COVID-19 cases 7,427, up +2,899 (ex-FL&NE) vs 7D ago… 7D delta has been flat over the past few days…
_____________________________
Current Trends — COVID-19 cases:
– Daily cases 7,427 vs 9,698 7D ago, down -2,271
– Daily cases ex-FL&NE 7,427 vs 4,528 7D ago, up +2,899
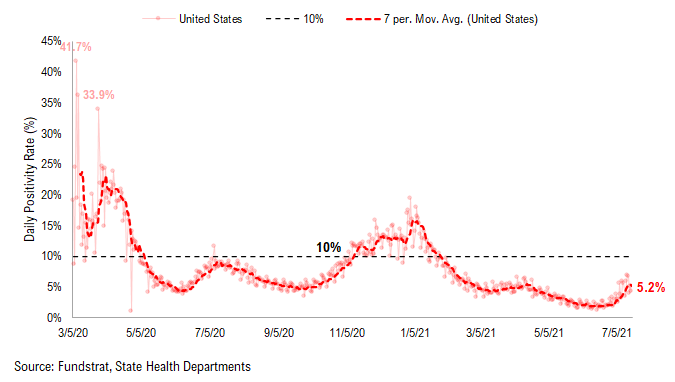
– 7D positivity rate 5.2% vs 4.1% 7D ago
– Hospitalized patients 21,931, up +28% vs 7D ago
– Daily deaths 258, up +15% vs 7D ago
_____________________________
*** Florida and Nebraska stopped publishing daily COVID stats updates on 6/4 and 6/30, respectively. We switched to use CDC surveillance data as the substitute. However, since CDC surveillance data is subject to a one-to-two day lag, we added a “US ex-FL&NE” in our daily cases and 7D delta sections in order to demonstrate a more comparable COVID development.
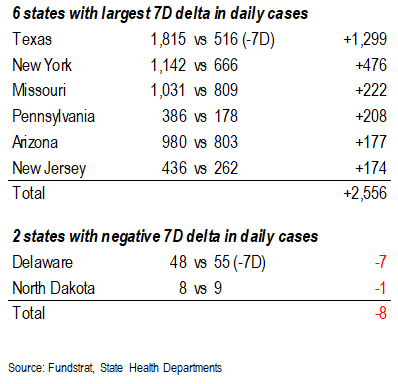
On Sunday, 13 states and Puerto Rico reported a total of 7,427 new cases. The majority of these states and PR reported higher daily cases than 7D ago. The case figure is climbing at a constant rate now – 7D avg of 7D delta in daily cases has been stable at ~10,000. However, 10,000 still means the case figure could exceed 50,000 in two weeks.
The other metrics such as Current Hospitalization and Positivity rate are also rising. Although current hospitalization remains relatively low compared to prior waves, it has been apparently turning upwards recently. The positivity rate is also rising rapidly, and now over 5%. Daily deaths have been flat over the past 1-2 weeks. As we noted before, we believe vaccine penetration could be the key to prevent COVID mortality. And with high vaccine penetration among the elderly population, the death trend might not follow the case trend even if the cases are surging.
Currently, TN, OK, AR, AL, MO, VT, SC, and, NV are the states with the largest increase in daily cases compared to their recent lows (as shown in the “parabolic” tracker below), and all 8 states except VT and NV have less than 50% of their populations vaccinated with at least one dose. This is consistent with what we wrote before regarding the majority of new cases being amongst unvaccinated individuals, and with what we noted previously, vaccination penetration appears to have some causal relationship with the case trend. Therefore, the COVID developments (both the case and vaccination trends) in these states along with the other low vaccinated states (such as MS, LA, GA, ID, WY, ND, IN) are worth watching.
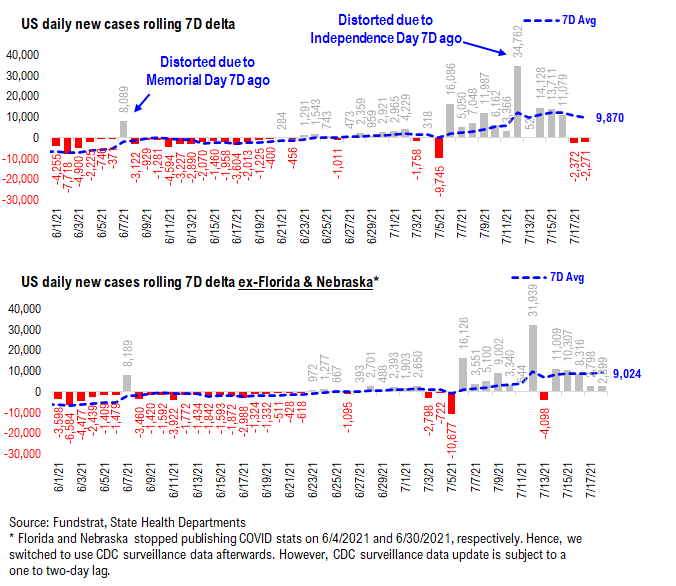
7D delta in daily cases has been about 10,000, flat-lined over the past few days…
The 7D delta in daily cases now rose to approximately 10,000, but it has flat-lined over the past few days. The good news is the speed of case increase is not parabolic. However, it still implies that the case figure could exceed 50,000 in two weeks.
Low vaccinated states seem to have a larger increase in daily cases compared to their recent low…
Below, we added a new section called “Parabolic Case Surge Tracker” to monitor the possible parabolic surge in daily case figures. In the table, we included both the vaccine penetration and the recent case trend for 50 US states + DC. The table is sorted by the multiple of their current daily cases divided by their recent low in daily cases.
– The states with higher ranks are the states that have seen a more significant rise in daily cases
– We also calculated the number of days between now and the recent low date; a state with a high multiple but low number of days since its low means the state is facing a relatively rapid surge in daily cases
– The US as a whole, UK, and Israel are also shown at the top as a reference
Current hospitalization and positivity rates are rising… Daily deaths also seem to be turning upwards now…
Below we show the aggregate number of patients hospitalized due to COVID, daily mortality associated with COVID, and the daily positivity rate for COVID. As you can see, hospitalization and daily deaths are relatively low compared to the prior waves. However, with the recent increase in daily cases, current hospitalization is clearly turning upwards, while daily deaths also appear to be turning. Regarding positivity rate, it recently exceeded 5%, which is higher than the positivity rate we observed during the “mini” wave this April and significantly higher than the recent low of <2%.
POINT 2: VACCINE: vaccination pace has been flat over the past week… The effort to get more people fully vaccinated remains the key…
_____________________________
Current Trends — Vaccinations:
– avg 0.5 million this past week vs 0.5 million last week
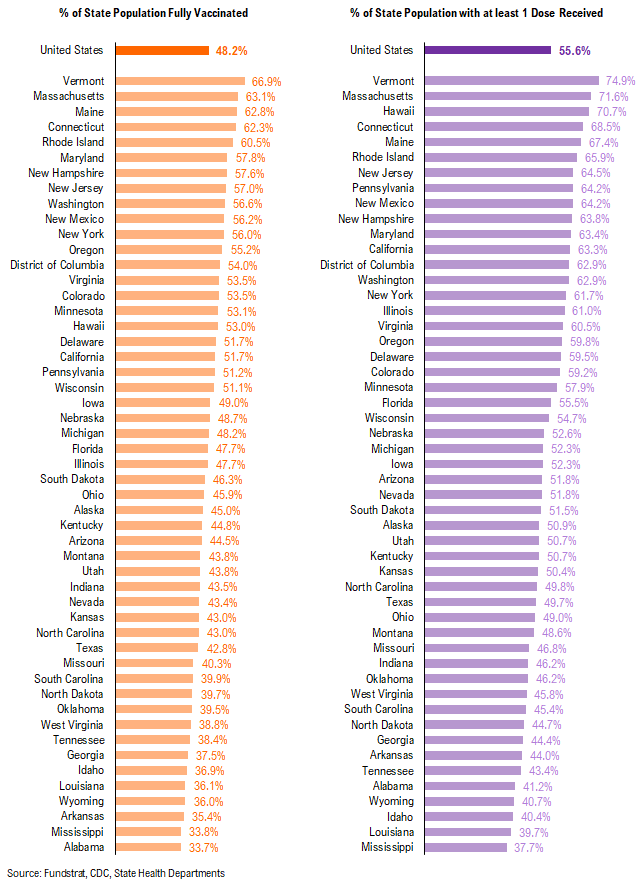
– overall, 48.2% fully vaccinated, 55.6% 1-dose+ received
_____________________________
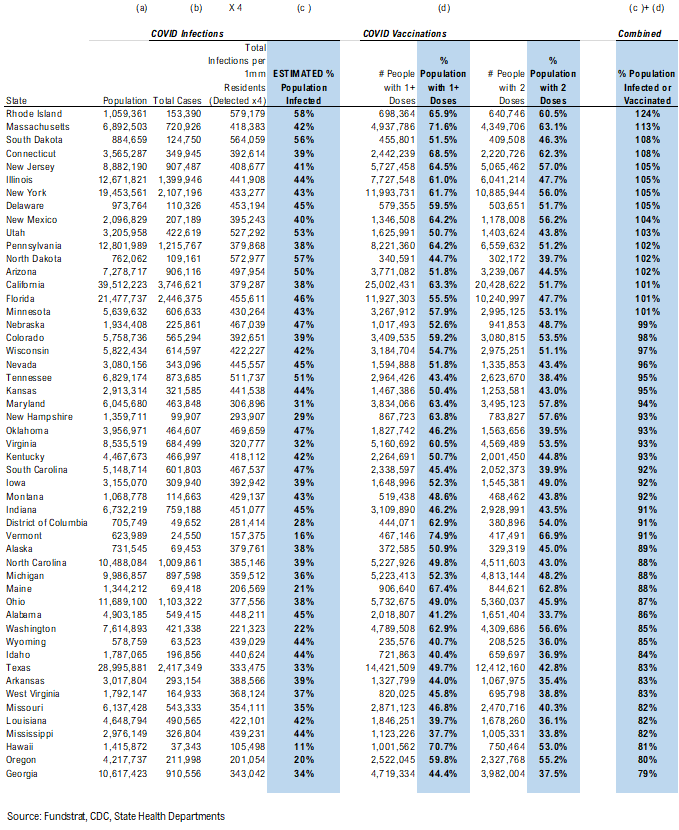
Vaccination frontier update –> all states now near or above 80% combined penetration (vaccines + infections)
Below we sorted the states by the combined penetration (vaccinations + infections). The assumption is that a state with higher combined penetration is likely to be closer to herd immunity, and therefore, less likely to see a parabolic surge in daily cases and deaths. Please note that this “combined penetration” metric can be over 100%, as infected people could also be vaccinated (actually recommended by CDC).
– Currently, all states are near or above 80% combined penetration
– RI, MA, SD, CT, NJ, IL, NY, DE, NM, UT, PA, ND, AZ, MN, CA, FL are now above 100% combined penetration (vaccines + infections). Again, this metric can be over 100%, as infected people could also be vaccinated. But 100% combined penetration does not mean that the entire population within each state is either infected or vaccinated.
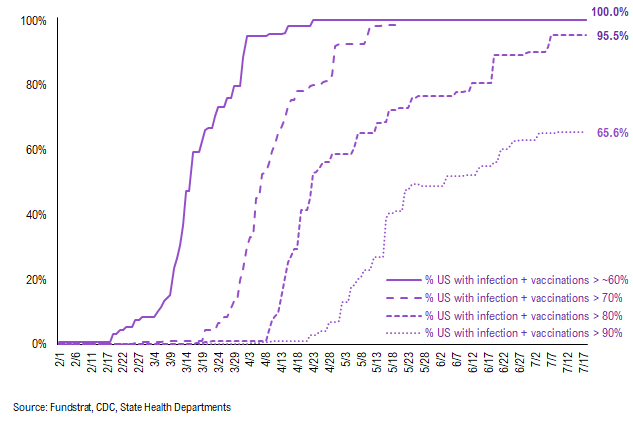
Below is a diffusion chart that shows the % of US states (based on state population) that have reached the combined penetration >60%/70%/80%/90%. As you can see, all states have reached 60% and 70% combined vaccination + infection. 95.5% of US states (based on state population) have seen combined infection & vaccination >80% and 65.6% of US states have seen combined infection & vaccination >90%.
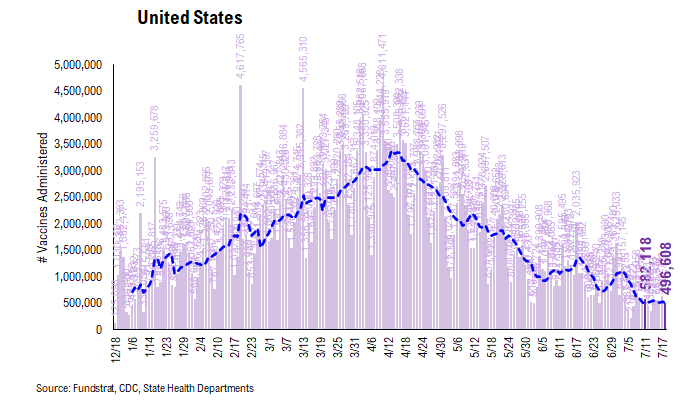
There were a total of 496,608 doses administered reported on Sunday. Over the past 7 days, 507,474 doses were administered per day on average, up 0.7% from 7D ago. The vaccination speed has been flat over the past 10 days, as shown in the chart below. The overall vaccination trend has been sliding down since mid-April.
As the more transmissible Delta variant gradually becomes the dominant strain in the US, vaccinations could not only provide some degree of protection against the virus but are also likely to reduce virus transmission. As many media sources have reported, the majority of new infections in some regions (LA County, Mississippi) are amongst the people who were not fully vaccinated. Therefore, it would be a good sign if we start to see the number of vaccines administered rise. However, we understand that vaccine hesitancy concerns might not easily be reversed. More studies on the vaccine’s side-effects and its efficiency against the variant, as well as government efforts, are key. We will be closely watching the relevant data.
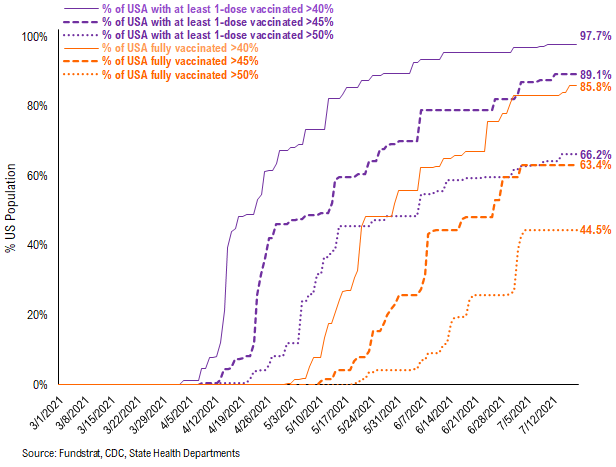
97.7% of the US has seen 1-dose penetration >40%…
To better illustrate the actual footprint of the US vaccination effort, we have a time series showing the percent of the US with at least 45%/45%/50% of its residents fully vaccinated, displayed as the orange line on the chart. Currently, 85.8% of US states have seen 40% of their residents fully vaccinated. However, when looking at the percentage of the US with at least 45% of its residents fully vaccinated, this figure is 63.4%. And only 44.5% of US (by state population) have seen 50% of its residents fully vaccinated.
– While 97.7% of US states have seen vaccine penetration >40%, 89.1% of them have seen 1 dose penetration >45% and 66.2% of them have seen 1 dose penetration > 50%.
– 85.8% of the US has at least 40% of its residents fully vaccinated, However, only 63.4% of US has fully vaccinated >45% and 44.5% of US has fully vaccinated >50%.
This is the state by state data below, showing information for individuals with one dose and two doses.
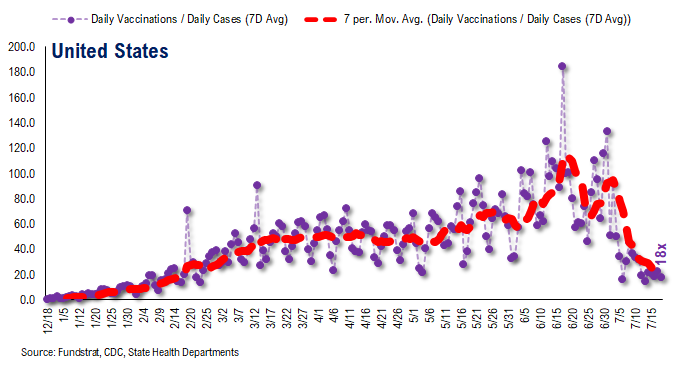
The ratio of vaccinations/ daily confirmed cases has been falling significantly (red line is 7D moving avg). Both the surge in daily cases and decrease in daily vaccines administered contributed to this.
– the 7D moving average is about ~20 for the past few days
– this means 20 vaccines dosed for every 1 confirmed case
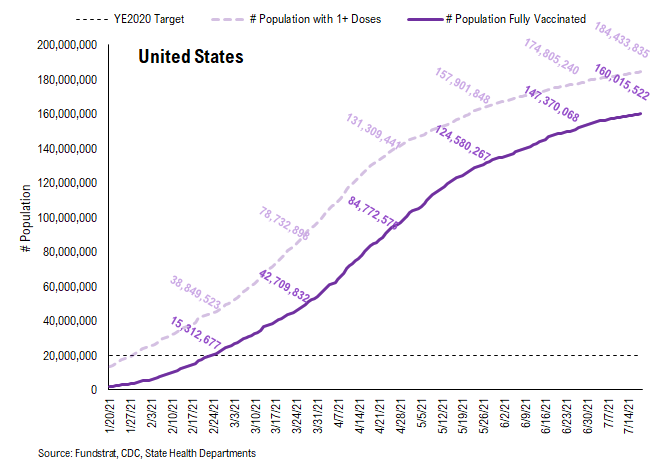
In total, 333 million vaccine doses have been administered across the country. Specifically, 184 million Americans (56% of US population) have received at least 1 dose of the vaccine. And 160 million Americans (48% of US population) are fully vaccinated.
POINT 3: Tracking restrictions lifting and subsequent effects in individual states
Point #3 focuses primarily on tracking the lifting of restrictions, as states have eased the majority of mandates. Keep in mind, easing/lifting restrictions are contingent upon state of emergency ordinances being renewed.
– States in groups 1 and 2 represent states that let their emergency ordinances expire, or that never had one in the first place
– Note: IL and HI are not listed. This is because restrictions lifting is determined at the county / island level, and no statewide policy will be established to lift restrictions until a full reopening
So there is a spectrum of approaches. Our team is listing 3 tiers of states and these are shown below.
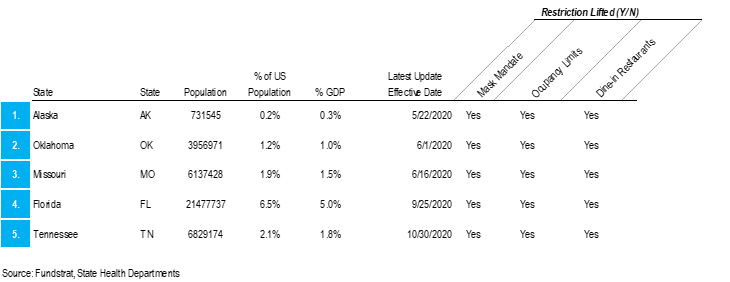
– states that eased all restrictions in 2020: AK, OK, MO, FL, TN
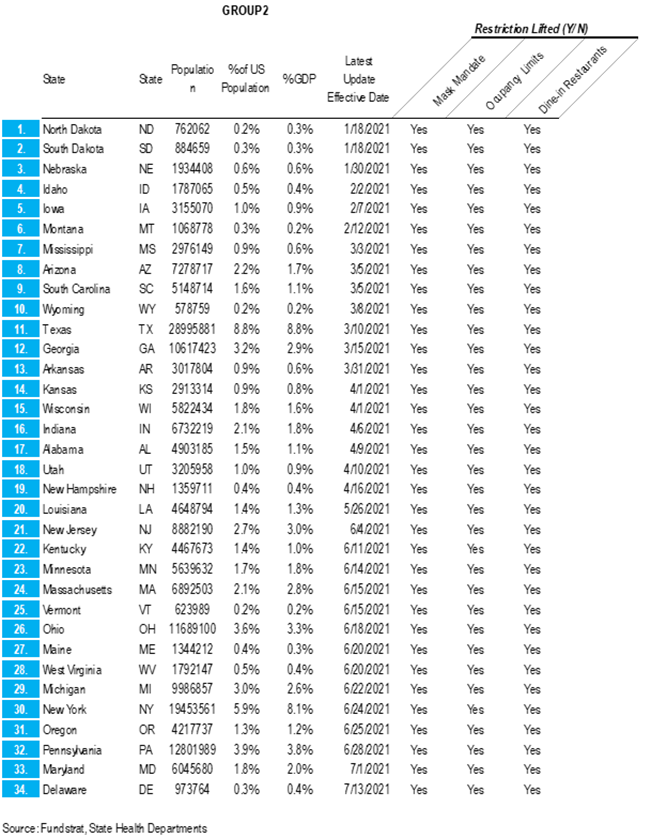
– states that have eased all restrictions in 2021 to now: ND, SD, NE, ID, IA, MT, MS, AZ, SC, WY, TX, GA, AR, KS, WI, IN, AL, UT, NH, LA, NJ, KY, MN, MA, VT, OH, WV, ME, MI, NY, OR, PA, MD, DE
– states that are still easing restrictions in 2021: WA, NC, CA, NM, CO, NV, CT, VA, RI, DC
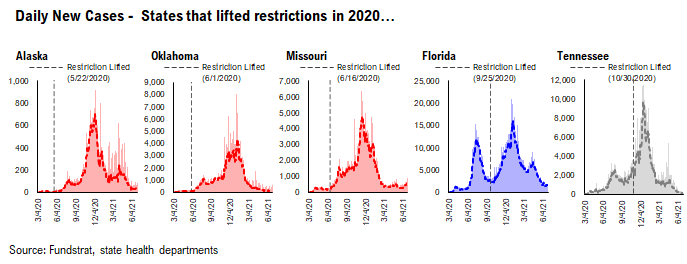
GROUP 1: States that lifted restrictions in 2020…
The daily case trends in these states are impressive and it is difficult to say that lifting restrictions has actually caused a new wave of cases because the case trends in these states look like other states.
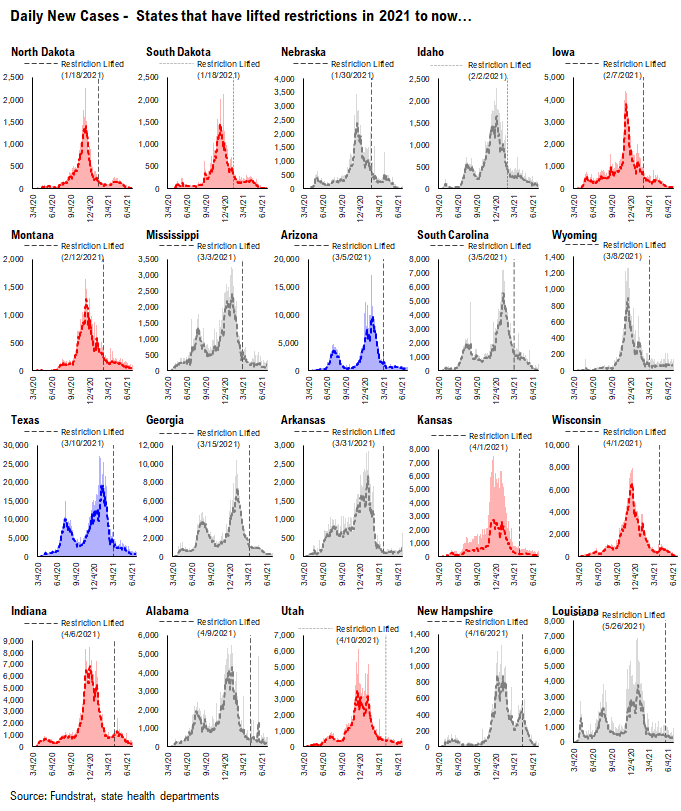
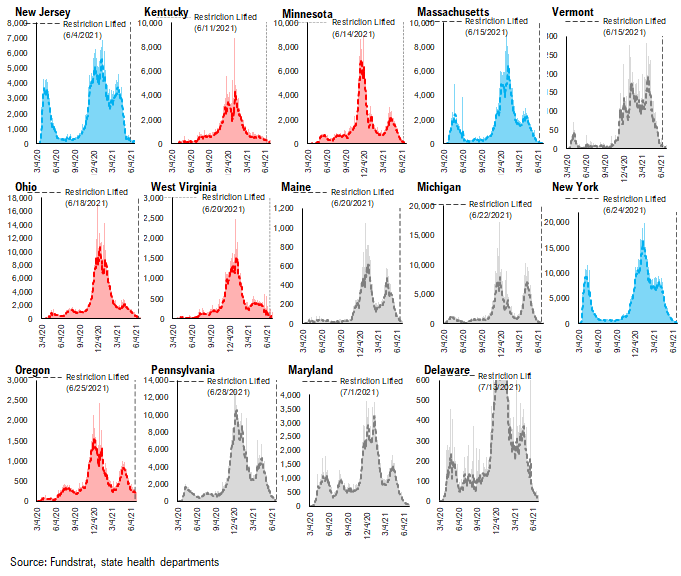
GROUP 2: States that have lifted restrictions in 2021 to now…
Similar to the list of states above, the daily case trends in these states are impressive and it seems that lifting restrictions hasn’t caused an increase in cases.
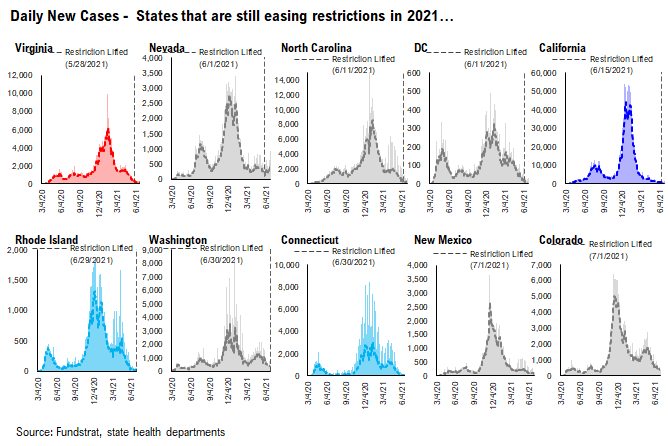
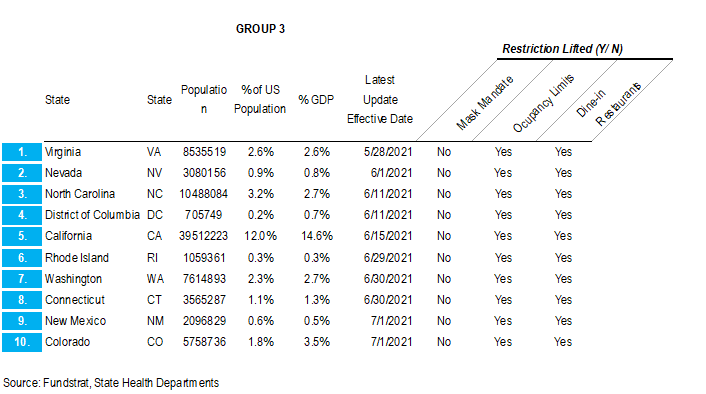
GROUP 3: States that are still easing restrictions in 2021…
These states have begun to lift restrictions, but have yet to ease all restrictions. The date of each state’s most recent restrictions lifting is indicated on each chart. The case trends in these states have been mostly positive.
– Easing restrictions appears to have contributed to an increase in cases in several of these states, most drastically in OR, ME, WA, and MN