

Per DeMark followers of '13': If S&P 500 does not sell-off Wednesday, expect FULLER "risk-on" into YE

Click HERE to access the FSInsight COVID-19 Daily Chartbook.
We are shifting to a 4-day a week publication schedule:
Monday
Tuesday
Wednesday
SKIP THURSDAY
Friday
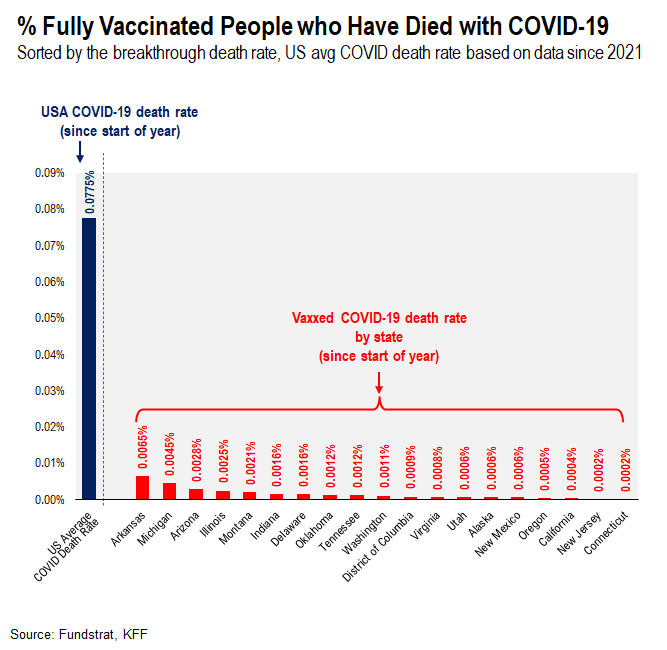
COVID-19 death rate for fully vaccinated Americans is 0.0002% to 0.0065%
There are 19 states that report COVID-19 breakthrough cases and the associated severity and mortality. This was recently summarized by the Kaiser Foundation (see below), and tireless Ken and team compiled this in the chart below.
– total USA death rate since start of 2021 is 0.0775%
– for the 19 states that report “breakthrough” cases
– COVID-19 death rate for vaxxed Americans is 0.0002% to 0.0065%
– USA overall death rate since start of 2021 is 0.0775%
– low but far higher than for vaxxed Americans
– this is far lower than the death rate for the USA overall. In other words, vaccines surely seem effective at limiting severe outcomes. However, this does not mean that fully vaxxed Americans are immune. Delta variant and others can still infect fully vaccinated Americans.
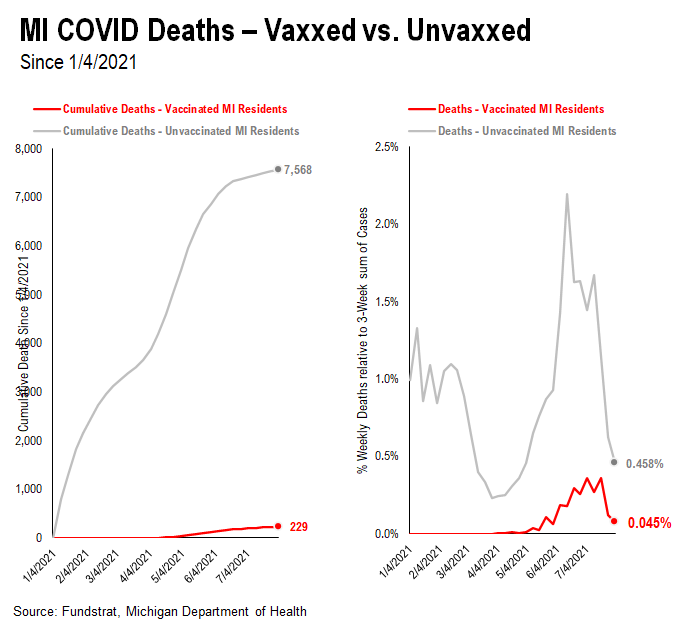
…this bifurcation of death for vax vs unvaxxed is more clear looking at a time series
COVID-19 is a tragedy leading to senseless and needless death. Nearly every American knows someone who has perished in the past two years from this disease. And the differences between those vaccinated (vax) versus non (unvaxxed) is stark.
Take a look at Michigan. Michigan has the largest number of vaxxed Americans perishing (% of population and large numbers):
– Since January 4, 2021
– Unvaxxed MI residents 7,568 deaths
– Death rate 0.458%
– Vaxxed MI residents 229 deaths
– Death rate 0.045%
This is 1/10th the death rate for Vax vs Unvaxxed. In other words, this is a dramatic decline in the risk from perishing from COVID-19. Although, the unvaxxed death rate of 0.458% is still low.
– unvaxxed in MI, risk of death if infected is 1 in 218
– vaxxed in MI, risk of death if infected is 1 in 2,222
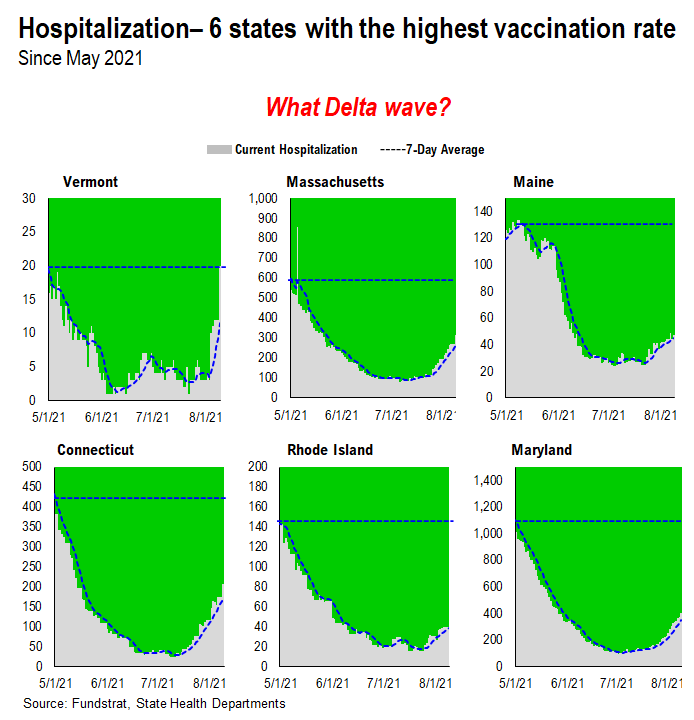
…Hospitalizations still muted for states with ‘high vax’ but soaring in ‘low vax’ states
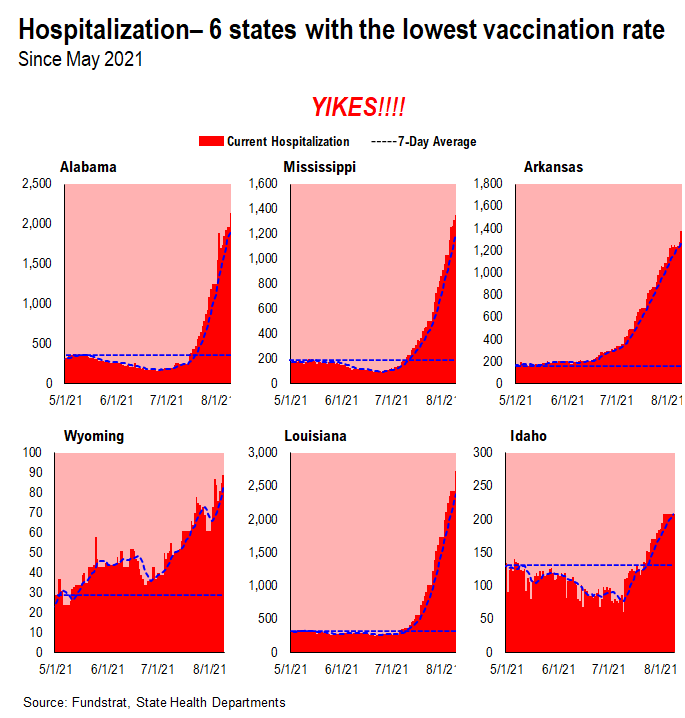
We wanted to update the charts showing hospitalizations for US states and highlight the differential between the 6 states with the highest and lowest vaccination rates.
– the charts are shown in sequence below
– the 6 states with the highest vax rates are seeing a modest tick up in hospitalizations vs 3 months ago
– the 6 states with the lowest vax rates are seeing a 10X-20X surge in hospitalizations vs 3 months ago
The delta variant is creating breakthrough cases, but again, the key is that the severity of cases is being mitigated whether measured by deaths or by hospitalizations.
– even highest vax states do not have 90% or even 80% vax rates
– so there is still a vulnerable cohort who will get infected
– and as Dr. Gottlieb notes, this could be the final wave, infecting all those ‘unvaxxed’
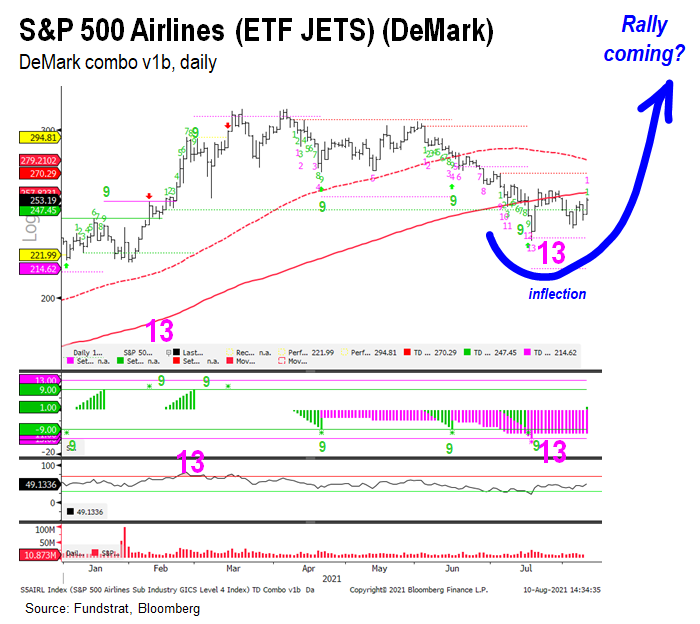
STRATEGY: Per DeMark ’13’: If S&P 500 does not sell-off starting Wednesday, we expect FULLER “risk-on” into YE
Last week, a number of our clients raised concerns because CNBC’s Mad Money flagged the dreaded DeMark ’13 sell setup’ (CNBC video here). And the ’13’ setups matter, because this indicates the exhaustion of a trend to a larger degree — meaning either “good news is baked in” or “bad news” (if a ‘buy setup’).
We did not spend a lot of time highlighting the risks associated with this setup for two reasons:
– CNBC flagged this on Tuesday, and the ’13’ did not appear yet
– ’13 sell setups’ have been mostly not actionable in 2021
– Prior to last week, four ’13’s have appeared (see below) and only 1 led to a sell-off approaching 5%
…as our clients are aware, over the same period, we shifted our view to “full risk-on” from “July/August chop”
During this same period of time, our clients are aware, we have shifted our view on markets to “full risk on” from “July/August chop” — so while we were keeping an eye askance at the ’13 sell setup,’ a constellation of other factors were making us more constructive on equity markets overall.
Why we rally into YE?
– Delta variant peaks this week
– This is last COVID-19 wave into YE, no Fall surge
– 10-year is rising = risk-on signal
– US infrastructure deal in place
– Bitcoin is rallying and was first to selloff = risk-on signal
– Seasonals kicking in early
…Wednesday is key day if DeMark ’13 has impact’
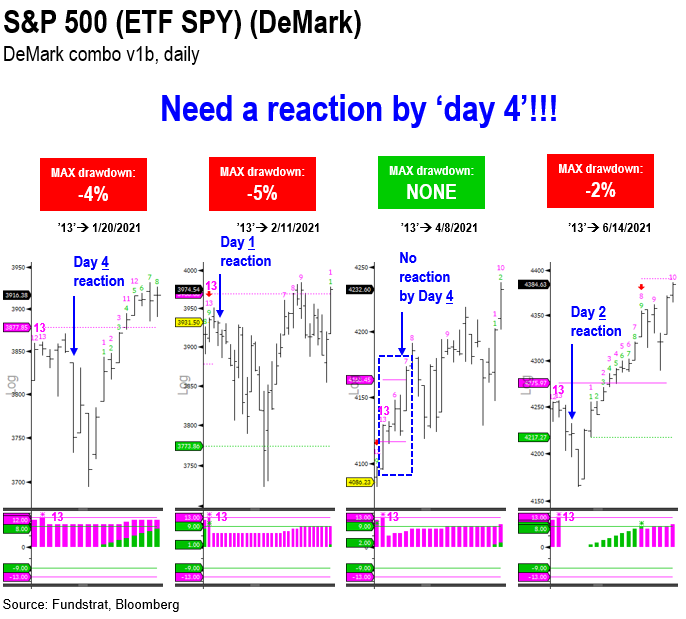
Well, the ’13 sell setup’ appeared on Thursday (8/5), and per the mechanics of the DeMark indicators (as developed by Tom DeMark, founder of DeMark Analytics):
– a reaction (“sell off”) needs to happen within 4 periods
– Day 4 is Wednesday August 11th
– If no selling on ‘day 4’ we get a ‘recycled 13’
– this is akin to what happened on April 8, 2021
– Equities since gained another +8% over 3 months
In other words, Wednesday is an important day if one is a DeMark analytics user.
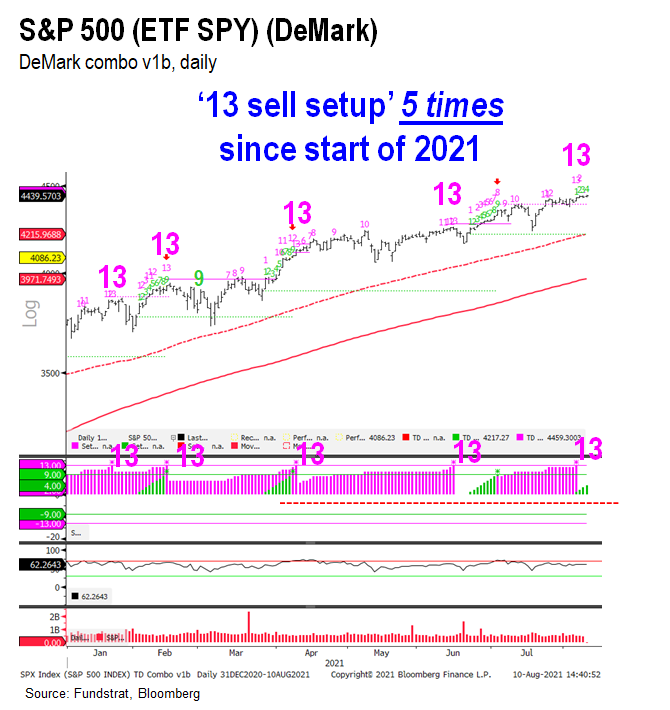
4 precedent ’13 sell setups’ since the start of 2021, and only 1 sees 5% drawdown
The prior 4 ’13 sell setups’ are shown below and we have annotated the key reaction window, by ‘day 4’:
– 3 of 4 had selling start by ‘day 4’
– decline was 2%, 4% and 5%
– 1 had no selling start by ‘day 4’
– April 8th, 2021, this was a ‘recycled 13’
– 3M later, +8% rally
So, ’13 sell setups’ have not been major turning points for the S&P 500 in 2021 as none of these led to a 10%-plus correction. And this is a reason we did not spend too much time last week talking about a possible ’13 sell setup’ in the S&P 500.
…Wednesday August 11th is Day 4
So, to reiterate, Wednesday is the key. As shown below, this would be ‘day 4’ — the future is uncertain
– so while nobody can say what markets will do on any single day
– we think the key is to watch markets Wednesday
– hopefully, there are no ‘tape bombs’
– if such takes place, this could lead to a larger sell-off
If not, this is more data supporting our view that “everything rallies into YE”

…10-year yields surging higher after ‘double bottom’
Several of our clients flagged the potential 10-year double bottom last week (BB of NYC), and indeed, this seems to be the case. Notice the symmetry?
– a rise in yields = economic growth prospects strengthening
– rising yields = risk-on
– rising yields = rotate into Epicenter
Hence, our rationale for upgrading Financials to OW from N on Tuesday.

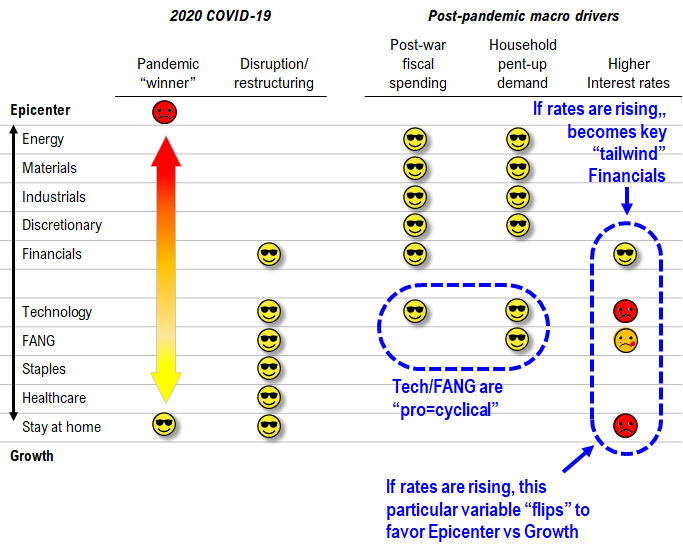
…Epicenter likely to lead the “everything rallies into YE”
Our rationale for recommending Epicenter stocks is shown below. Post-pandemic drivers favor Epicenter, particularly if we are going full risk-on.
– the key inflection in the past 10 days is the reversal higher in interest rates
– this becomes a big tailwind for Financials
– this also is a tailwind for Energy XLE -0.27% OIH 0.55% (see note from yesterday)
– we still like FAANG because there is a pro-cyclical element to FAANG
– there is also a catch-up trade for AMZN -0.44% AAPL 1.74% which are up a mere 2%/9% versus 18% for S&P 500
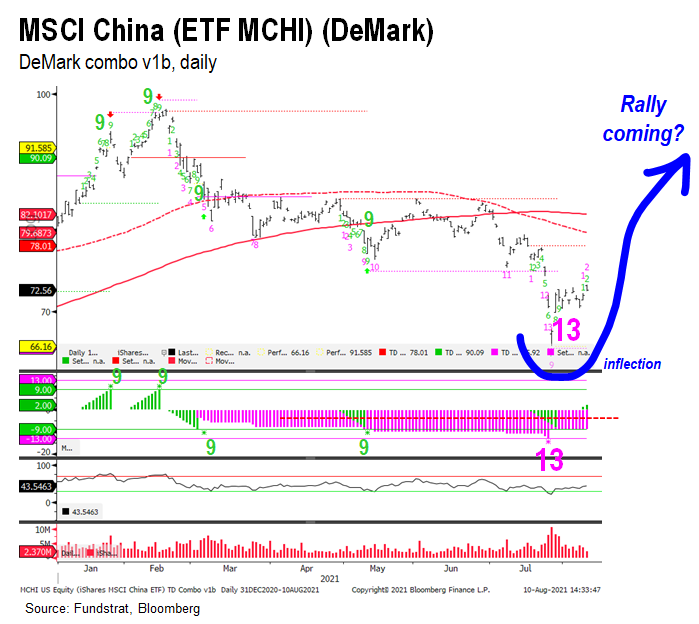
…and key groups are indeed turning higher
As we flagged last week, 3 key groups are also inflecting higher. The 3 charts are shown below in sequence:
– China MCHI 2.04% has inflected higher
– Airlines JETS 1.55% is nearing the 200D
– Casinos BETS is showing an impulsive rally higher
These were among the first groups to sell-off, peaking between February and April. Thus, their reversal higher is a sign of renewed Epicenter leadership.

__________________________
26 Granny Shot Ideas: We performed our quarterly rebalance on 07/30. Full stock list here –> Click here
___________________________
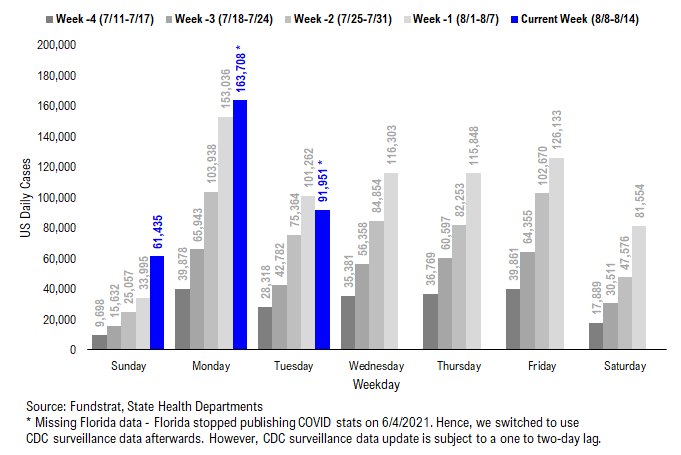
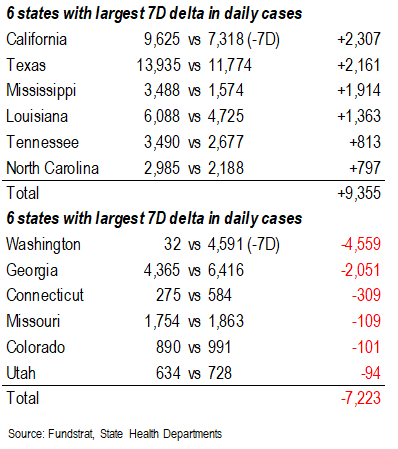
POINT 1: Daily COVID-19 cases 91,951, up +7,624 (ex-FL&NE) vs 7D ago… 7D delta seems to roll over now… If so, early sign of case figure rollover…
_____________________________
Current Trends — COVID-19 cases:
– Daily cases 91,951 vs 101,262 7D ago, down -9,311
– Daily cases ex-FL&NE 91,951 vs 84,327 7D ago, up +7,624
– 7D positivity rate 8.6% vs 8.0% 7D ago
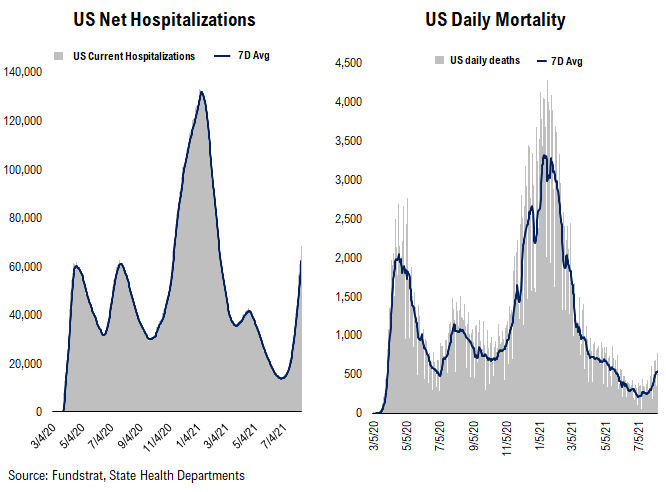
– Hospitalized patients 68,451, up +26% vs 7D ago
– Daily deaths 541, up +32% vs 7D ago
_____________________________
*** Florida and Nebraska stopped publishing daily COVID stats updates on 6/4 and 6/30, respectively. We switched to use CDC surveillance data as the substitute. However, since CDC surveillance data is subject to a one-to-two day lag, we added a “US ex-FL&NE” in our daily cases and 7D delta sections in order to demonstrate a more comparable COVID development.
The latest COVID daily cases came in at 91,951, up +7,624 (ex-FL&NE). The 7D delta in daily cases trend has turned downwards in the past few days – the 7D average of 7D delta has declined from ~26,000 on Sunday to ~21,000 Tuesday. As we noted previously, both IHME’s forecast and the COVID patterns in UK and India point to a case rollover by mid-August. If this is truly going to happen, we should see the 7D delta start to roll over first as an early indicator. Hence, the recent 7D delta trend reversal seems to confirm the case rollover by mid-August. That said, we also need more data points to validate. If this decline persists, we will also see the case figure start to peak (and roll over) very soon.
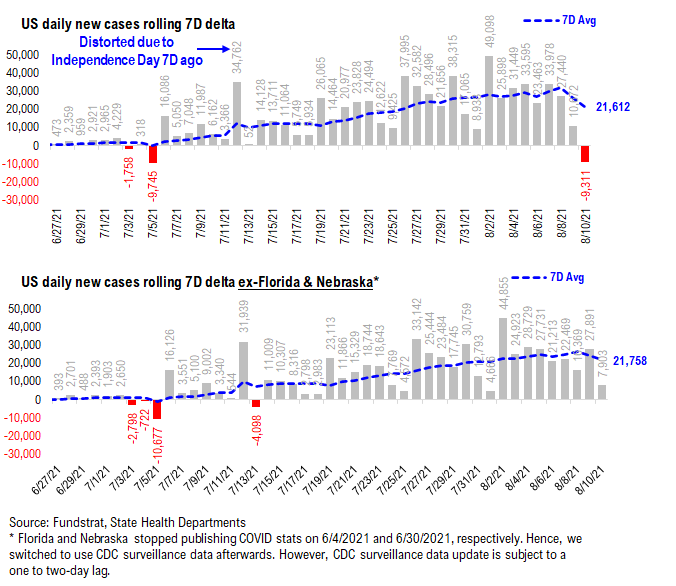
7D delta in daily cases seems to be rolling over now…
As shown in the chart below, the 7D delta in daily cases seems to be rolling over now – down from ~26,000 two days ago to current level at 21,758. However, we do need more data points to confirm this roll over. If this decline in 7D delta persists, we should see the daily cases apex soon.
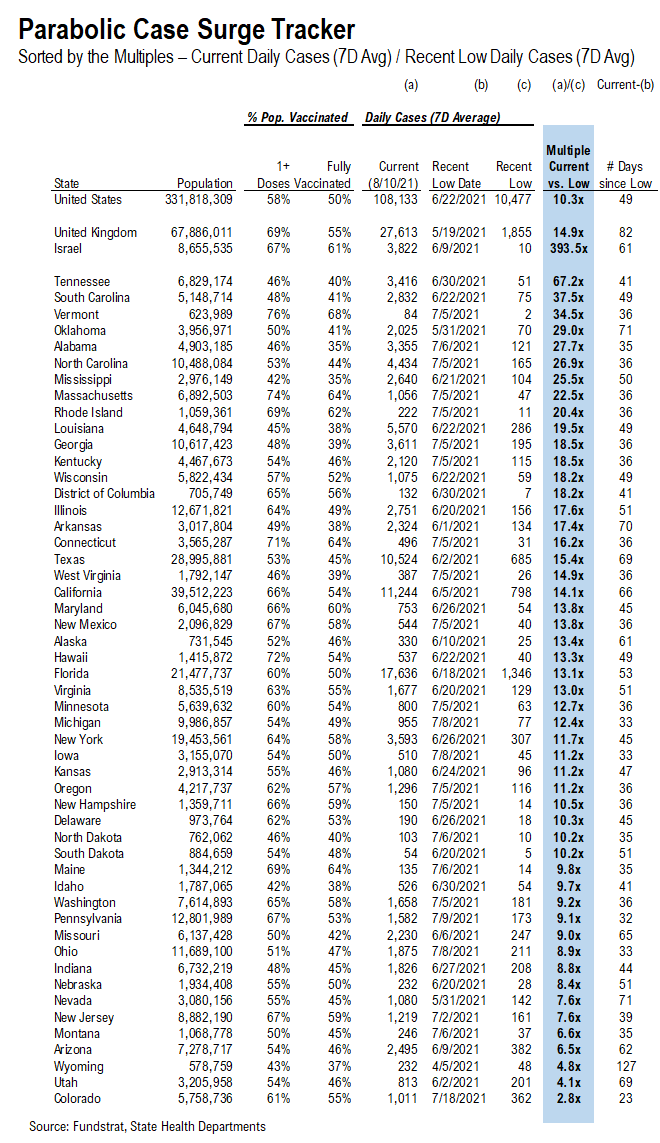
Low vaccinated states seem to have a larger increase in daily cases compared to their recent low…
Below, we added a new section called “Parabolic Case Surge Tracker” to monitor the possible parabolic surge in daily case figures. In the table, we included both the vaccine penetration and the recent case trend for 50 US states + DC. The table is sorted by the multiple of their current daily cases divided by their recent low in daily cases.
– The states with higher ranks are the states that have seen a more significant rise in daily cases
– We also calculated the number of days between now and the recent low date; a state with a high multiple but low number of days since its low means the state is facing a relatively rapid surge in daily cases
– The US as a whole, UK, and Israel are also shown at the top as a reference
Hospitalization and positivity rate continue rising… Daily deaths is also trending upwards now…
Below we show the aggregate number of patients hospitalized due to COVID, daily mortality associated with COVID, and the daily positivity rate for COVID.
As you can see, hospitalization and positivity rate have exceeded the peak level we’ve seen in April’s “mini” wave. Daily deaths have been trending upwards recently, but far less “dramatic” than the cases or hospitalization trends.


POINT 2: VACCINE: vaccination pace has been gradually rising over the past three weeks… Over half of Americans are fully vaccinated…
_____________________________
Current Trends — Vaccinations:
– avg 0.7 million this past week vs 0.7 million last week
– overall, 49.9% fully vaccinated, 58.4% 1-dose+ received
_____________________________
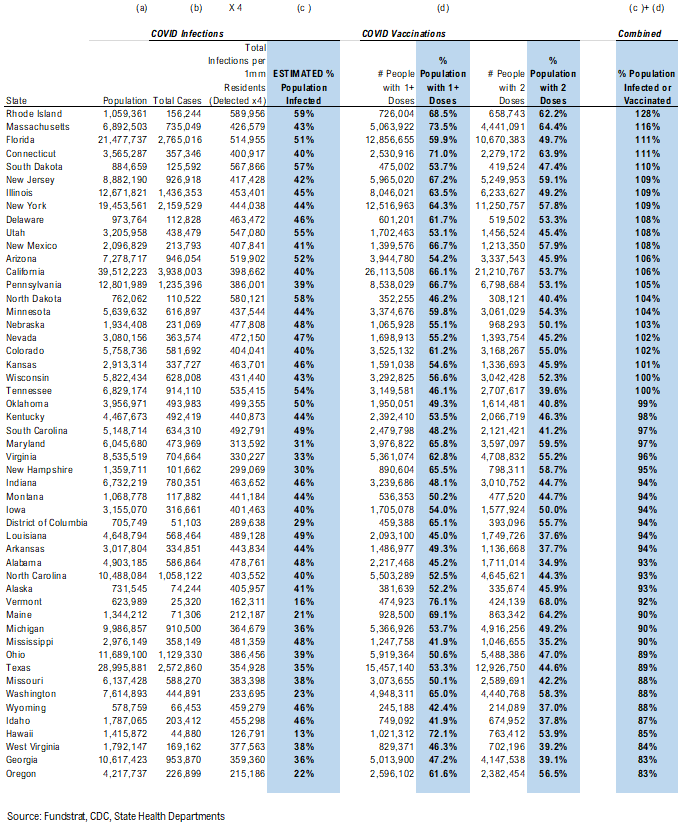
Vaccination frontier update –> all states now near or above 80% combined penetration (vaccines + infections)
Below we sorted the states by the combined penetration (vaccinations + infections). The assumption is that a state with higher combined penetration is likely to be closer to herd immunity, and therefore, less likely to see a parabolic surge in daily cases and deaths. Please note that this “combined penetration” metric can be over 100%, as infected people could also be vaccinated (actually recommended by CDC).
– Currently, all states are near or above 80% combined penetration
– RI, MA, SD, CT, NJ, IL, NY, DE, NM, UT, PA, ND, AZ, MN, CA, FL, NE are now above 100% combined penetration (vaccines + infections). Again, this metric can be over 100%, as infected people could also be vaccinated. But 100% combined penetration does not mean that the entire population within each state is either infected or vaccinated.
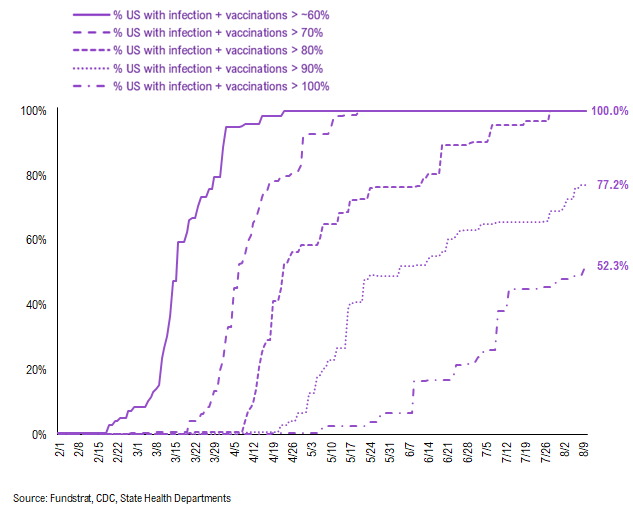
Below is a diffusion chart that shows the % of US states (based on state population) that have reached the combined penetration >60%/70%/80%/90%/100%. As you can see, all states have reached 80% combined vaccination + infection. 77.2% of US states (based on state population) have seen combined infection & vaccination >90% and 52.3% of US states have seen combined infection & vaccination >100% (Reminder: this metric can be over 100%, as infected people could also be vaccinated. But 100% combined penetration does not mean that the entire population within the state is either infected or vaccinated).
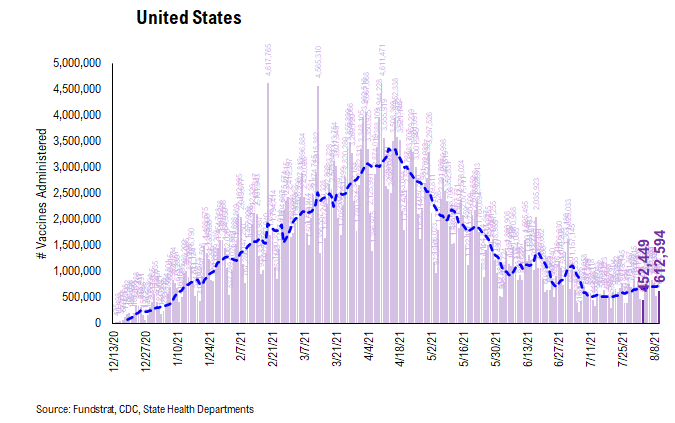
There were a total of 612,594 doses administered reported on Tuesday. The vaccination pace apparently has improved over the past three weeks (although slowly). As we noted earlier this week, it seems that people are becoming more inclined to get vaccinated over growing Delta variant concerns. Especially, the states with lower vaccine penetration appear to have a greater improvement. This is a great sign. Currently, over half of Americans (50.3% according to CDC) have been fully vaccinated. Although vaccine breakthroughs still happen, we continue to believe that vaccination is the key to combatting the pandemic.
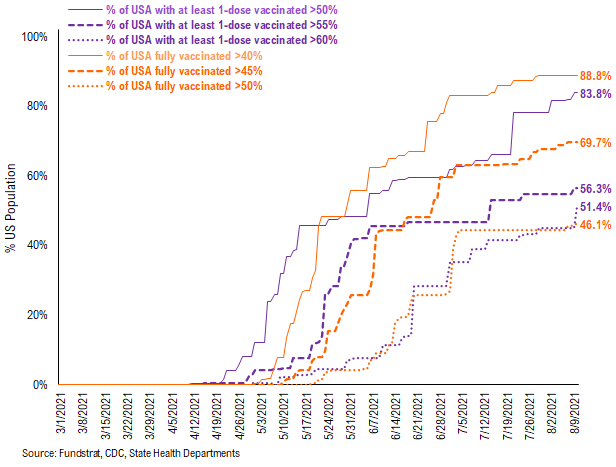
51.4% of the US has seen 1-dose penetration >60%…
To better illustrate the actual footprint of the US vaccination effort, we have a time series showing the percent of the US with at least 45%/45%/50% of its residents fully vaccinated, displayed as the orange line on the chart. Currently, 88.8% of US states have seen 40% of their residents fully vaccinated. However, when looking at the percentage of the US with at least 45% of its residents fully vaccinated, this figure is 69.7%. And only 46.1% of US (by state population) have seen 50% of its residents fully vaccinated.
– While 83.8% of US states have seen vaccine penetration >50%, 56.3% of them have seen 1 dose penetration >55% and 51.4% of them have seen 1 dose penetration > 60%.
– 88.8% of the US has at least 40% of its residents fully vaccinated, However, only 69.7% of US has fully vaccinated >45% and 46.1% of US has fully vaccinated >50%.
This is the state by state data below, showing information for individuals with one dose and two doses.

The ratio of vaccinations/ daily confirmed cases has been falling significantly (red line is 7D moving avg). Both the surge in daily cases and decrease in daily vaccines administered contributed to this.
– the 7D moving average is about ~10 for the past few days
– this means 10 vaccines dosed for every 1 confirmed case

In total, 351 million vaccine doses have been administered across the country. Specifically, 194 million Americans (58% of US population) have received at least 1 dose of the vaccine. And 166 million Americans (50% of US population) are fully vaccinated.

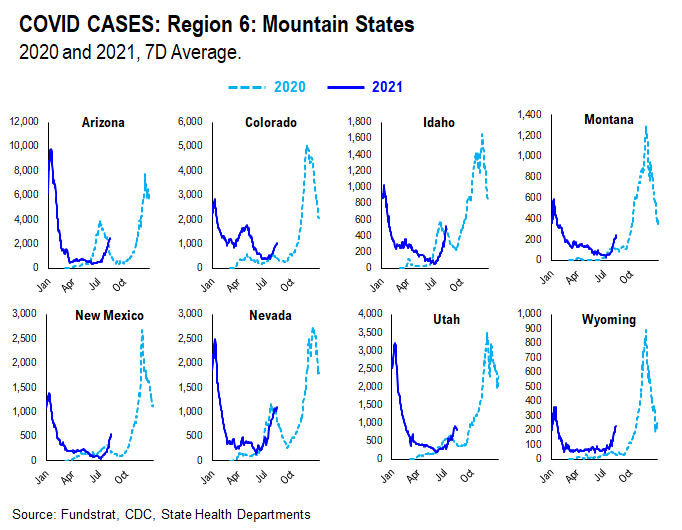
POINT 3: Tracking the seasonality of COVID-19
In July, we noted that many states experienced similar case surges in 2021 to the ones they experienced in 2020. As such, along with the introduction of the more transmissible Delta variant, seasonality also appears to play an important role in the recent surge in daily cases and hospitalization. Therefore, we think there might be a strong argument that COVID-19 is poised to become a seasonal virus.
The possible explanations for the seasonality we observed are:
– Outdoor Temperature: increasing indoor activities in the South vs increasing outdoor activities in the northeast during the Summer
– “Air Conditioning” Season: similar to “outdoor temperature”, more “AC” usage might facilitate the spread of the virus indoors
If this holds true, seasonal analysis suggests that the Delta spike could roll over by following a similar pattern to 2020.
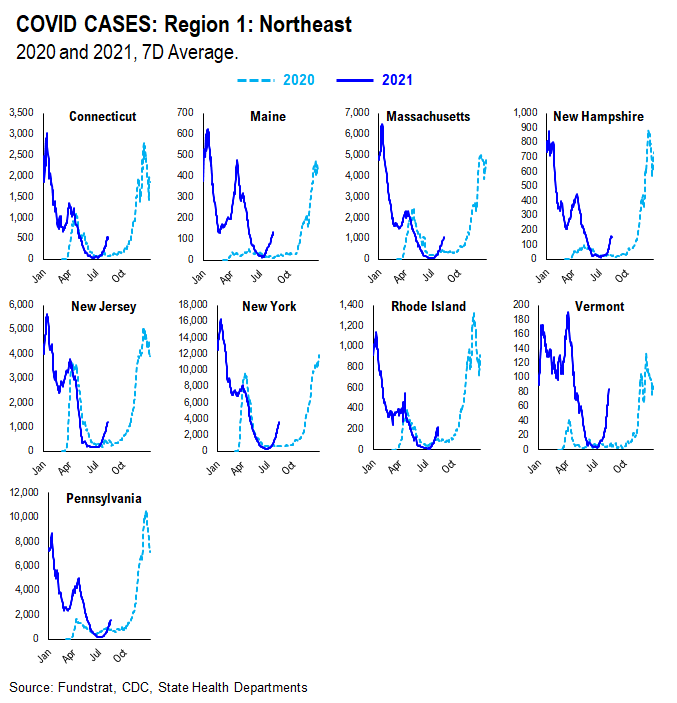
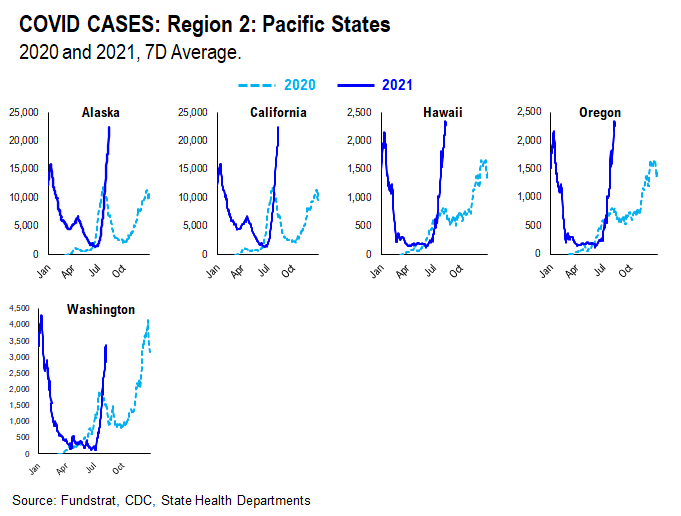
We created this new section within our COVID update which tracks and compare the case and hospitalization trends in both 2020 and 2021 at the state level. We grouped states geographically as they tend to trend similarly.
CASES
It seems as if the main factor contributing to current case trends right now is outdoor temperature. During the Summer, outdoor activities are generally increased in the northern states as the weather becomes nicer. In southern states, on the other hand, it becomes too hot and indoor activities are increased. As such, northern state cases didn’t spike much during Summer 2020 while southern state cases did. Currently, northern state cases are showing a slight spike, especially when compared to Summer 2020. This could be attributed to the introduction of the more transmissible Delta variant and the lifting of restrictions combined with pent up demand for indoor activities.


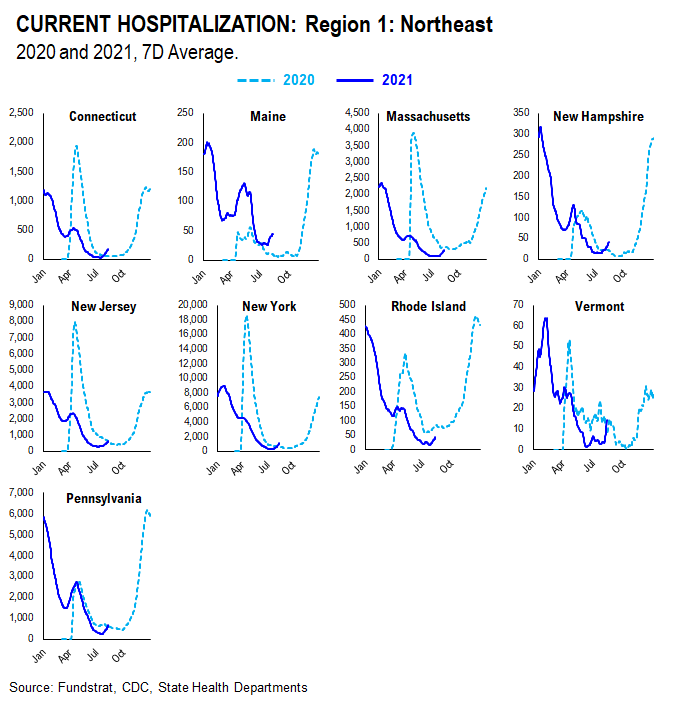
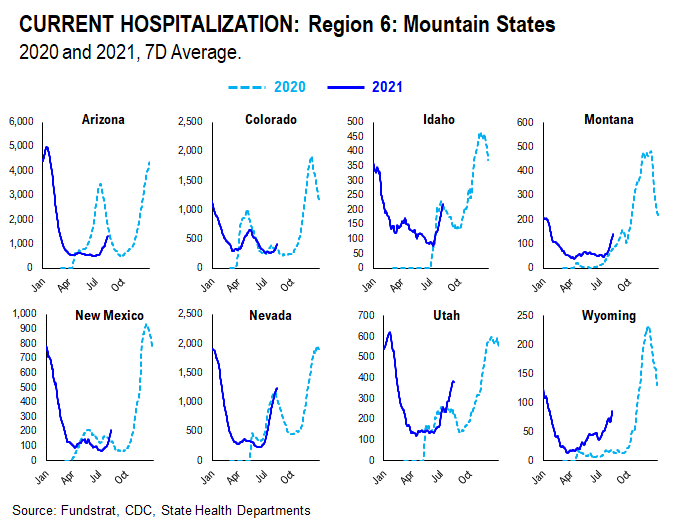
HOSPITALIZATION
Current hospitalizations appear to be similar or less than Summer 2020 rates in most states. This is likely due to increased vaccination rates and the vaccine’s ability to reduce the severity of the virus.


More from the author
Articles Read 1/2
🎁 Unlock 1 extra article by joining our Community!
Stay up to date with the latest articles. You’ll even get special recommendations weekly.
Already have an account? Sign In 5ff483-49d277-27e0c9-580d88-8ff720
Already have an account? Sign In 5ff483-49d277-27e0c9-580d88-8ff720

