

MAKE OR BREAK WEEK: JOLTS show the "bro"-cession becoming more visible in data and possibly April jobs (this Fri). Despite market weakness past few days, risk/reward positive on Fed "dovish" +25bp hike.

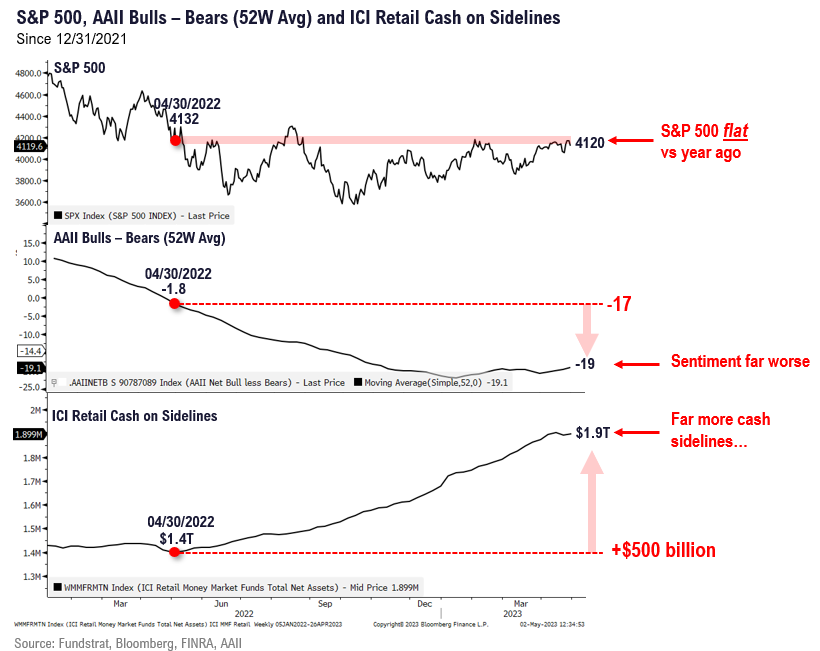
The S&P 500 closed a year ago (4/30/22) at 4,132 and closed April 2023 at 4,169. Yes, the S&P 500 is exactly flat with where it was one year ago. This surprised me but was pointed out by ES in SF. As we discuss below (see Strategy section), the fact the market is flat vs year ago contrasts with a massive de-leveraging of investors that has since taken place. Will investors further “disown” stocks? Or will they begin to re-acquire equities (our view)?
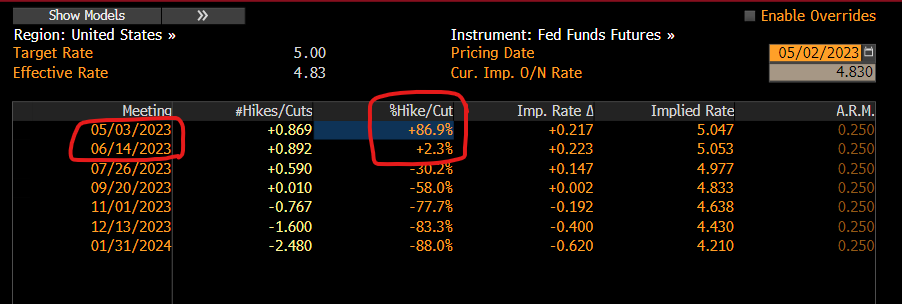
We are approaching the consequential May Fed FOMC rate decision at 2pm ET (5/3), and our view into this meeting has been the Fed would do a “dovish” +25bp hike (futures see 86% probability) and this would be followed by a pause (futures see 2.3% chance of a hike in June).
- To us, this “pause” is potentially a “make or break” moment for investors. We believe this possibility of a pause comes in the context of 3 developments:
– sufficient progress on the war on inflation to warrant stopping and looking around
– signs of a sustained softening of labor demand, tackling key Fed concern
– mounting risks of financial instability from festering regional bank crisis - How will the market interpret this? For those in the “higher for longer” camp, this pause arguably is counter to the idea that the Fed will continue raising through year-end. And to an extent, we believe this would also signal the Fed similarly tolerates the current easing of financial conditions that has taken place (10Y + VIX lower, etc). And further easing possibly, given the hesitance of private capital to hold regional bank paper.
- There is the possibility that intermediate/longer term rates also fall (5Y/10Y at 3.455%/3.422% now) and any decline in rates (sustained) would mitigate the mounting troubles for regional banks. The conversation of regional banks has spread beyond holding onto deposits, and shifted to include mounting credit risk from CRE (commercial real estate) and tightening credit conditions. Regional banks facing higher costs are going to rationalize/reduce credit activities. This will not be lost on Fed.
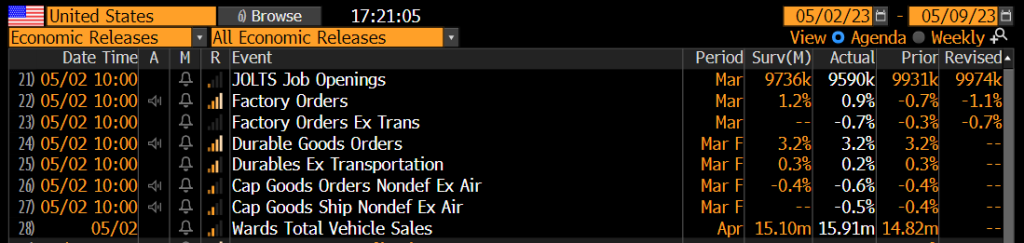
- When word of layoffs was seen earlier in the year, it was mostly viewed as a “bro-cession” as it was mostly Tech/software layoffs (tech bros) and fallout from regional bank jobs (finance bros). The incoming data on the job market has been pointing to a deepening retrenchment, aside from the 1Q23 ECI index (employment cost index). Tuesday’s JOLTS report (job openings) showed a steeper than expected decline for March (6 week lag, so not April) openings to 9.59 million (Street 9.736) and this softening only partially reflects fallout from the failure of SIVB 0.00% and regional banks. But JOLTS is only beginning to reflect what we are seeing in jobless claims and in company announcements.
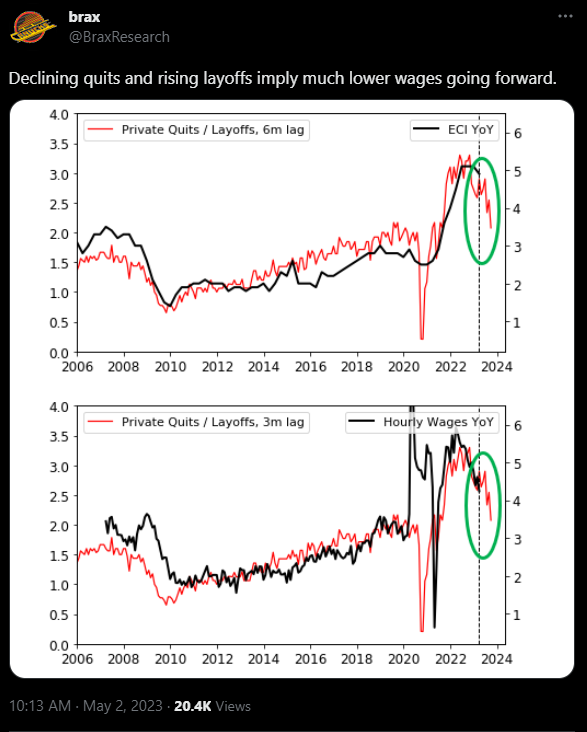
- @BraxResearch on twitter shared a chart (see below) comparing private quits/layoffs ratio, and its relationship to wage pressures. It does seem to suggest there is 3-6 month lead time of softer JOLTS and and a subsequent rollover in wage pressures. Again, more reason for Fed to consider a pause
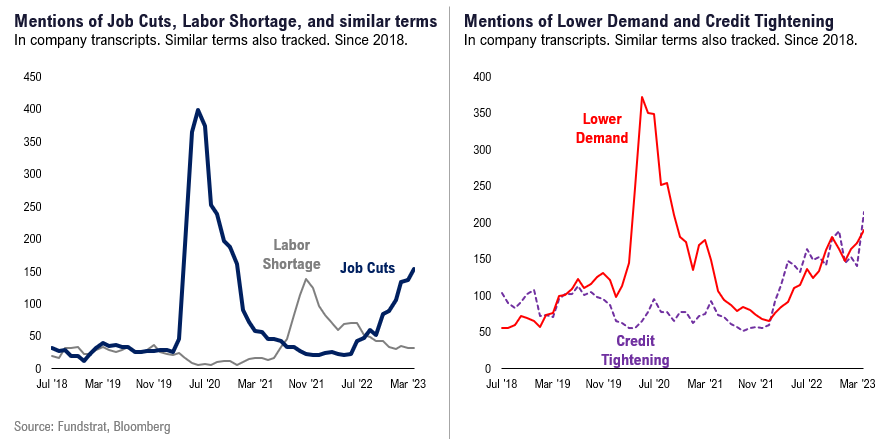
- Using Bloomberg data (TA [GO]), the announcement rate of “job cuts” has risen to 154 on earnings calls (1/3 S&P 500) while “labor shortage” has plunged to 31. Labor shortage references peaked at 138 in December 2021. So, the rise in job cuts is surpassing the level of opposing labor shortage at its peak (see below). And this comes at a time when over 200 references have been made to “credit tightening” so this doesn’t point to a job market that will strengthen.
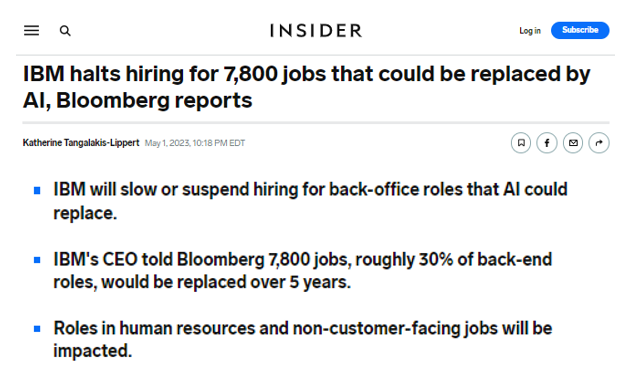
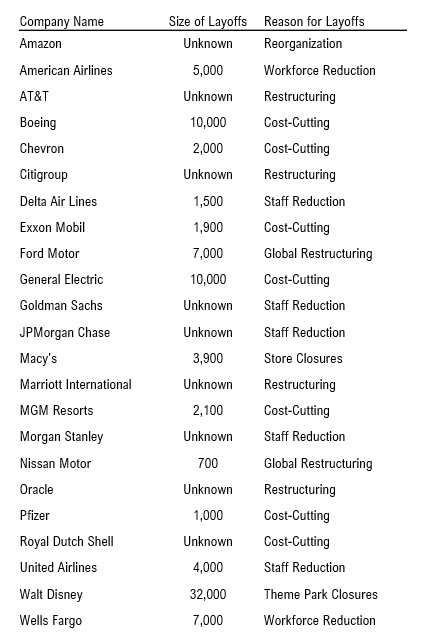
- We have a table compiled from the WSJ that shows announced layoffs are widespread. And on Monday, IBM 0.42% halted hiring for 7,800 jobs due to AI replacing jobs (mostly backoffice in next 5 years). The Fed has repeatedly referred to the need to soften the labor market, meaning drive up unemployment rates, to contain wage pressures seen driving services inflation. It certainly seems the momentum of the labor market shows that wage pressures should be quickly diminishing.
- This Friday, we get the April jobs report, and consensus is looking for +180k NFP (non-farm payrolls), a downshift from +236k last month. This pace would be enough to lift the unemployment rate as there are about 200k per month increase in the “available workforce” from the net effect of those turning 18, less retirements, plus net impact of immigration.
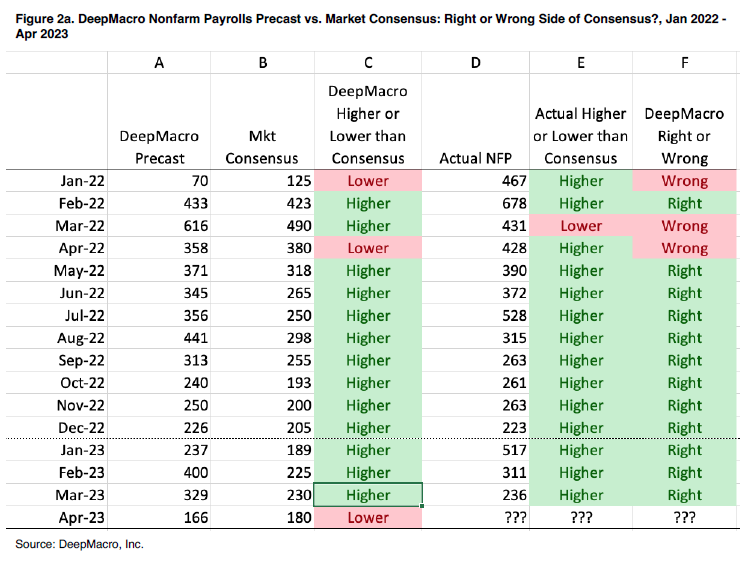
- Deep Macro, the machine-learning/alternative data macro research firm, expects a below consensus figure of +166k. This is the first time in 13 months that Deep Macro sees a miss on jobs. Of course, wages will also be in focus and consensus is looking for average hourly earnings to be +0.3% MoM, which is flat with last month’s gains. But softer jobs would also support the picture that the labor market is visibly on its way to softening.
- Does the Fed have to wait until it sees the “whites of the eyes” in falling inflation? This is the obvious question and will be answered on Wed at 2pm ET. But the constellation of data is already pointing to a softening of labor market demand, jobs itself and eventually wages. And as such, the sticky part of inflation, core services ex-housing, will see a tailwind diminish. The Fed’s view is wage pressures are driving inflation in the services economy.
STRATEGY: If Fed delivers dovish +25bp, could be positive for risk assets, even with festering debt ceiling/regional banks
The S&P 500 closed a year ago (4/30/22) at 4,132 and closed April 2023 at 4,169. Yes, the S&P 500 is exactly flat with where it was one year ago.
- Change April 30, 2022 to April 30, 2023
- S&P 500 +1%
- AAII % net bulls -17% <– far lower
(-1.8 to -19) - Retail money market cash +$500 billion <- massively higher
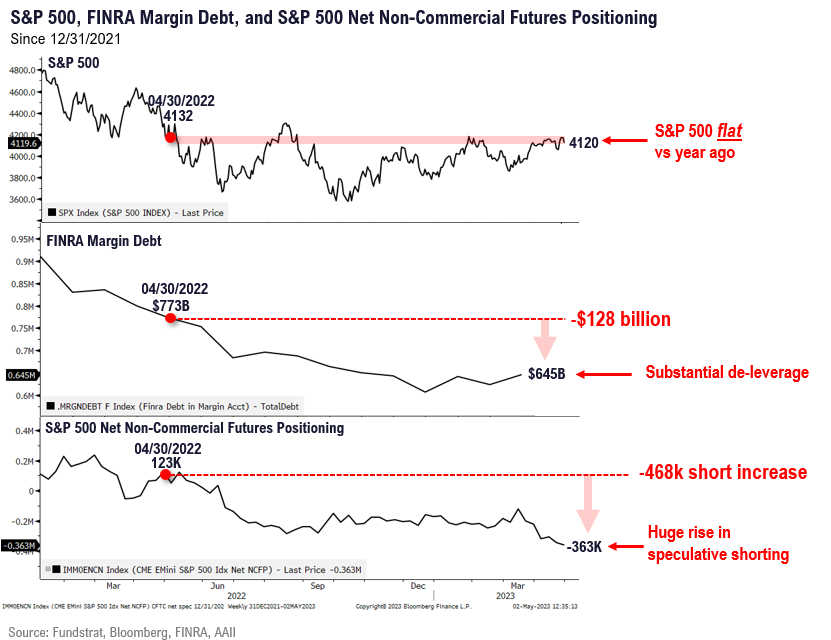
($1.4T to $1.9T) - FINRA Margin Debt -$128 billion <- far lower
($773b to $645b) - Spec net SPX future -464,000 contacts <- far greater short
(+123k to -363k)
So you get the picture. Equity markets are actually up slightly YoY, but investors are far more negative (AAII) and have deleveraged significantly. So the natural question is what is the next move? We think this is why this week could be a “make or break” week.
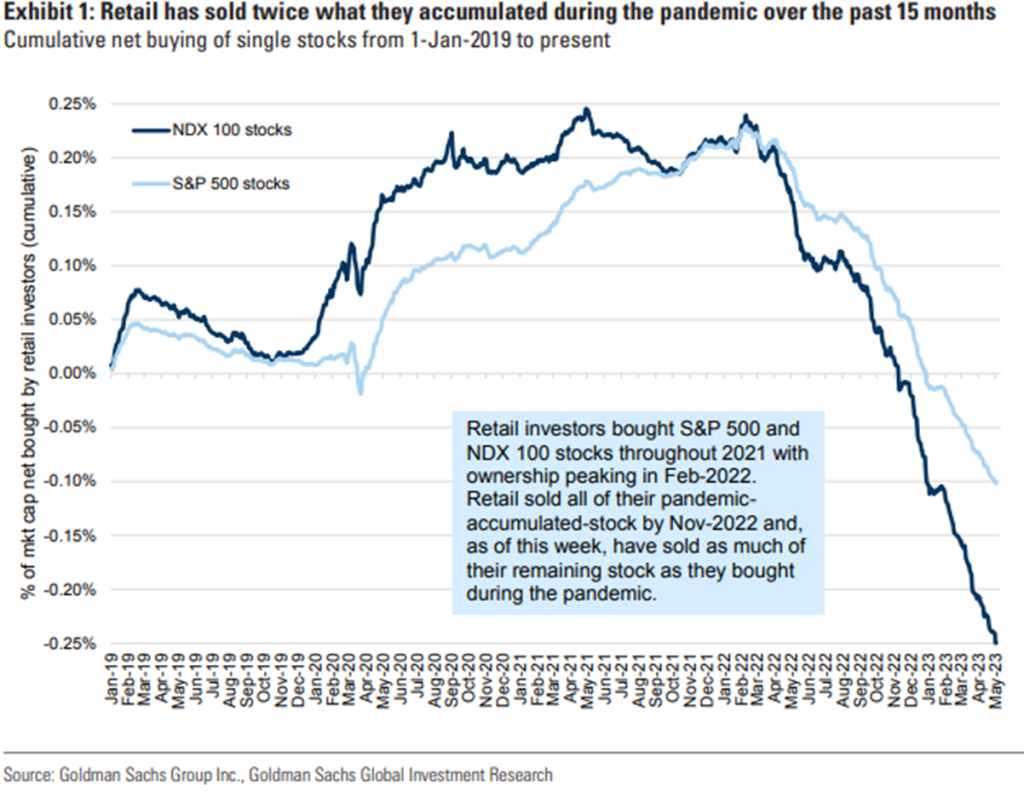
The retail investor has rage sold out of the stock market
And as Goldman Sachs data shows, retail investors have completely unwound their long position in equities. This shows that cumulative current flows into equities are BELOW where they were in 2019:
- this speaks to the above analysis
- the equity markets are actually 1% higher versus a year ago (April 2022 to April 2023)
- and this occurred when retail equity investors literally exited the market
MAY FOMC DECISION: Futures markets see 87% chance of a hike
This table shows the implied probabilities of a Fed hike. And markets see 87% chance of a hike Wed. I would think this seems conditionally low.
- and only a 2% chance of a hike in June
- so the pause is the question
APRIL JOBS REPORT (5/5): Deep macro sees a miss vs consensus
Deep Macro, founded by Jeffrey Young, does great work on compiling bottoms-up alternative data. They have been very good at forecasting the labor report.
- for past 13 months, they saw a strong job market and “beats”
- but they now see a “miss” on Friday for the April report
- we think this would support a Fed pause, as it would further support the notion the job market is softening
BRO-CESSION: Started with Tech layoffs, but it is broadening
When word of layoffs was seen earlier in the year, it was mostly viewed as a “bro-cession” as it was mostly Tech/software layoffs (tech bros) and fallout from regional bank jobs (finance bros).
- this chart from Revelio Labs show that 19% of the layoffs this year have been software engineers, so this label is correct
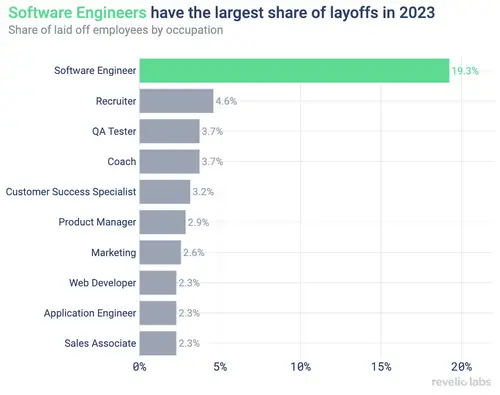
And that is before AI might be amplifying those reductions. For instance, IBM 0.42% announced Monday that it would pause hiring due to expectation that roles could be filled by AI.
…But now beyond a “bro-cession”
But this now seems to be more than just a bro-cession. Looking at transcript data from Bloomberg (TA [GO]), we see that there is a sharp increase in companies announcing job cuts:
- the references to job cuts surpasses the magnitude peak of “labor shortage” in 2021
- meaning, the amplitude suggests that job cuts could become a bigger issue than labor shortage, potentially
- this hardly points to wage inflation pressures continuing.
And as the table from the WSJ article below highlights, there are many companies announcing substantial layoffs.
JOLTS: Showing the spreading of softer labor markets… not quite at level Fed wants to see
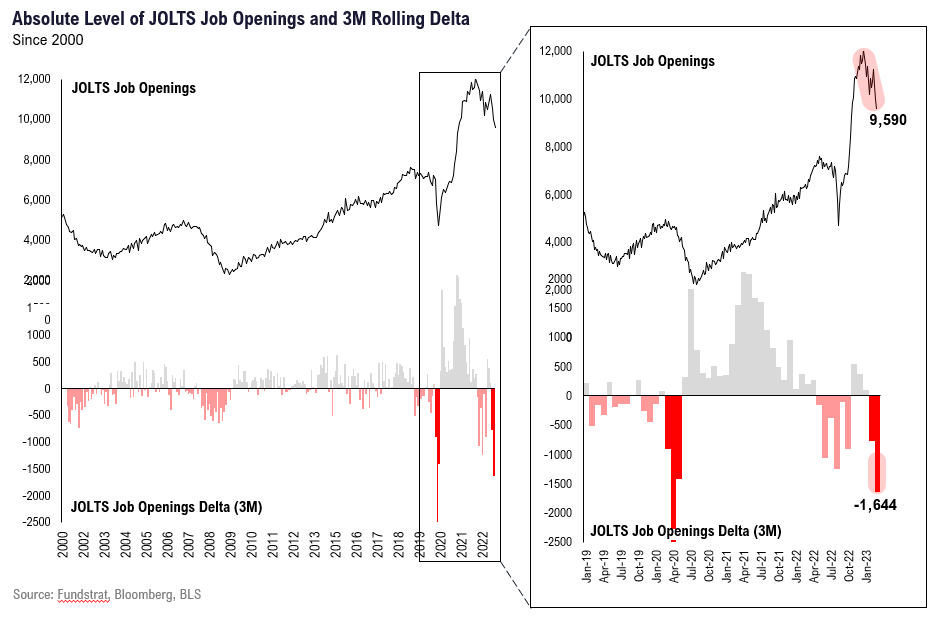
Tuesday’s JOLTS report (job openings) showed a steeper than expected decline for March (6 week lag, so not April) openings to 9.59 million (Street 9.736):
- this softening only partially reflects fallout from the failure of SIVB 0.00% and regional banks. But JOLTS is only beginning to reflect what we are seeing in jobless claims and in company announcements.
- The 3M decline in openings is -1.644 million and as shown below, is the steepest only surpassed by the 2020 pandemic.
- so the magnitude of drop in JOLTS is jarring
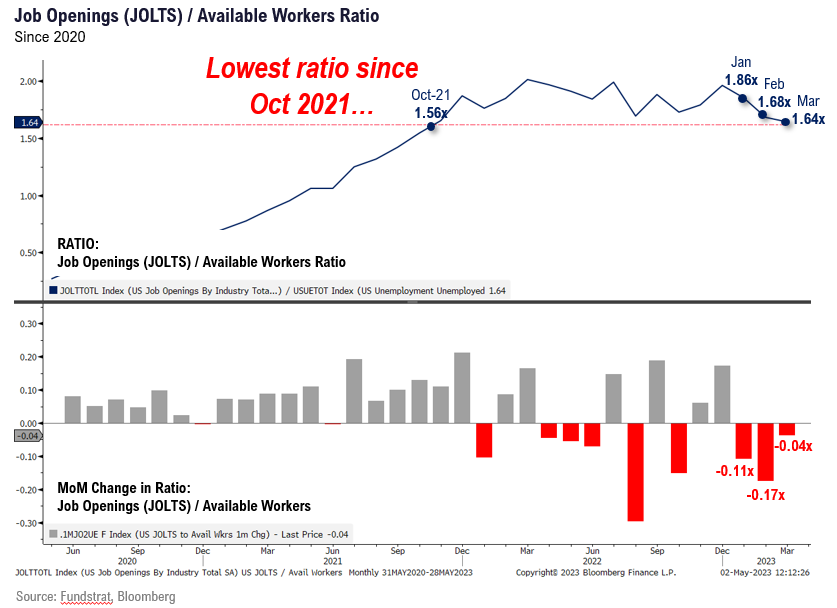
The ratio of job openings per available worker is back to 1.64:
- this is the best level since Oct 2021
- but the Fed would like to see this at 1.25 or lower, so there is progress here
- another 2 months of this and the job openings ratio would be right where Fed wants it
- the Fed cites this figure often and the only issue is JOLTS has an overall short history
@BraxResearch on twitter shared a chart I found interesting. This is the private quits/layoffs ratio and its relationship to wage pressures:
- it does seem to suggest there is 3-6 month lead time of softer JOLTS
- and a subsequent rollover in wage pressures.
- again, more reason for Fed to pause
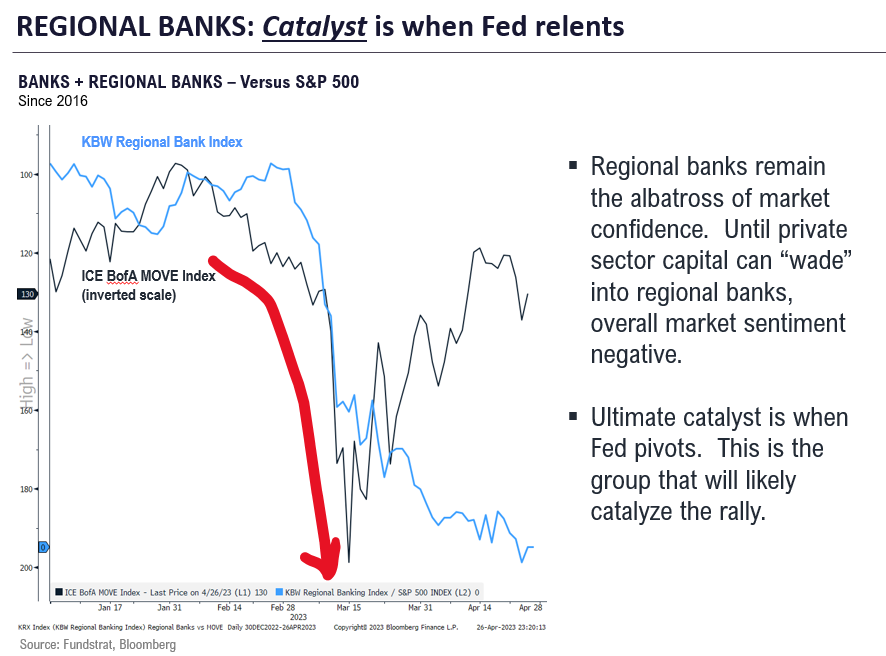
REGIONAL BANKS: Still festering and adding to uncertainty, but when Fed pauses, this group could rise
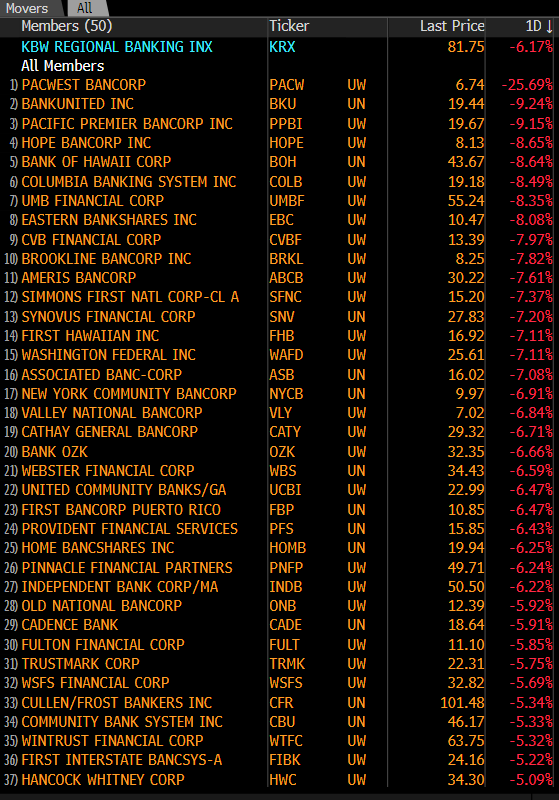
The rescue of First Republic did not convince investors that other regional banks are not at risk. As shown below, these stocks came under pressure again on Tuesday, led by declines in Pacwest (PACW) and multiple others.
Given the concerns around regional bank “held to maturity” portfolios and the losses in the Treasury holdings (from higher rates), we can see why regional banks would see relative stability when the Fed pauses. Of course, the credit cycle and higher cost of funding and shrinking balance sheets all challenge the regional bank model.
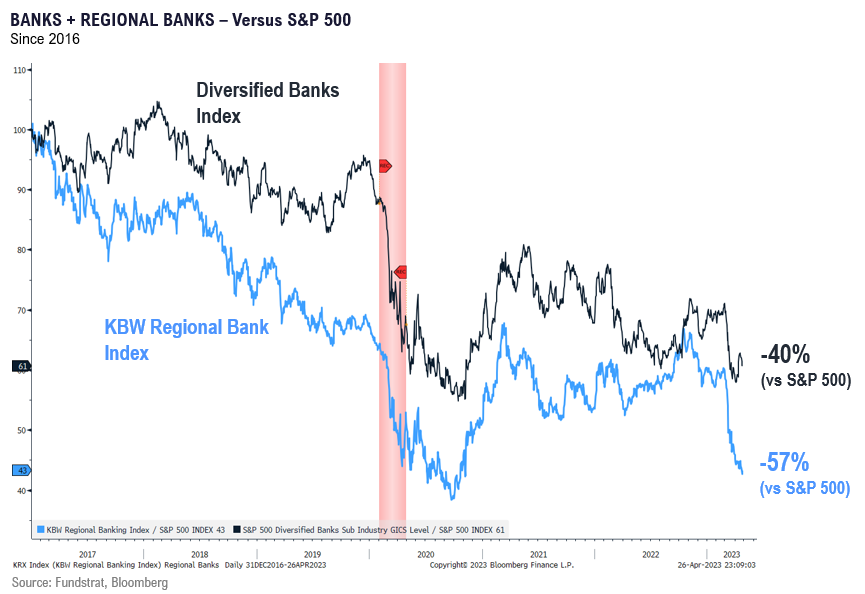
But we see this as a strong setup eventually, as the regional banks have massively underperformed the broader market since 2017.
ECONOMIC CALENDAR: Key May data is inflation and ISM, and April was overall “tame”
Key incoming data May
5/1 10am ET April ISM Manufacturing (PMIs turn up)Positive inflection5/2 10am ET Mar JOLTSSofter than consensus- 5/3 10am ET April ISM Services
- 5/3 2pm Fed May FOMC rates decision
- 5/5 8:30am ET April Jobs report
- 5/5 Manheim Used Vehicle Value Index April
- 5/10 8:30am ET April CPI
- 5/11 8:30am ET April PPI
- 5/12 10am ET U. Mich. April prelim 1-yr inflation
- 5/12 Atlanta Fed Wage Tracker April
- 5/24 2pm ET May FOMC minutes
- 5/26 8:30am ET PCE April
- 5/26 10am ET U. Mich. April final 1-yr inflation
- 5/30 Conference Board Consumer Confidence
Key data April
4/3 10am ISM Manufacturing Employment/Prices Paid MarchTame4/4 10am ET JOLTS Job Openings (Feb)Tame4/7 8:30am ET March employment reportTame4/12 8:30am ET CPI MarchTame4/12 2pm ET March FOMC MinutesTame4/13 8:30am ET PPI March Tame- 4/14 7am ET 1Q 2023 Earnings Season Begins Better than feared
4/14 Atlanta Fed Wage Tracker MarchSemi-strong4/14 10am ET U. Mich. March prelim 1-yr inflationHawkish4/19 2:30pm ET Fed releases Beige BookTame4/28 8:30am 1Q23 Employment Cost IndexSemi-strong4/28 8:30am ET PCE MarchTame4/28 10am ET UMich April final 1-yr inflationHawkish
STRATEGY: Focus on Industrials, a week to make a tactical positive bet
Both the ISM PMI and S&P Global US PMIs are released on Monday:
ISM Manufacturing PMI has been better than consensus.
- Actual 47.1 vs Street 46.8 and last month 46.3
S&P Global US PMIs has come in slightly lower than consensus, but remains above 50.
- Actual 50.2 vs Street 50.4 and last month 50.4
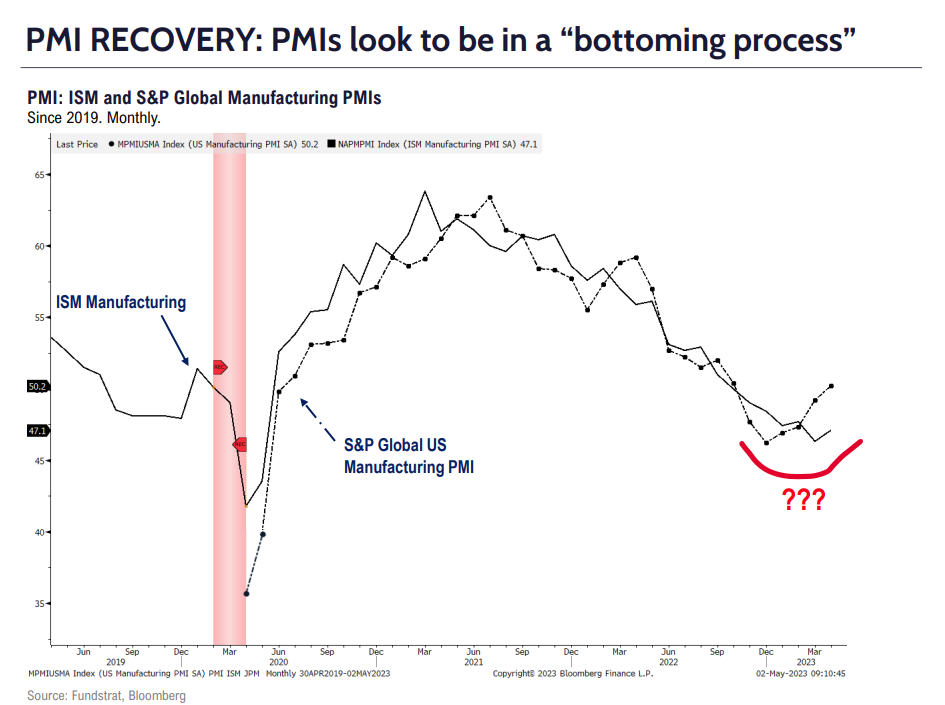
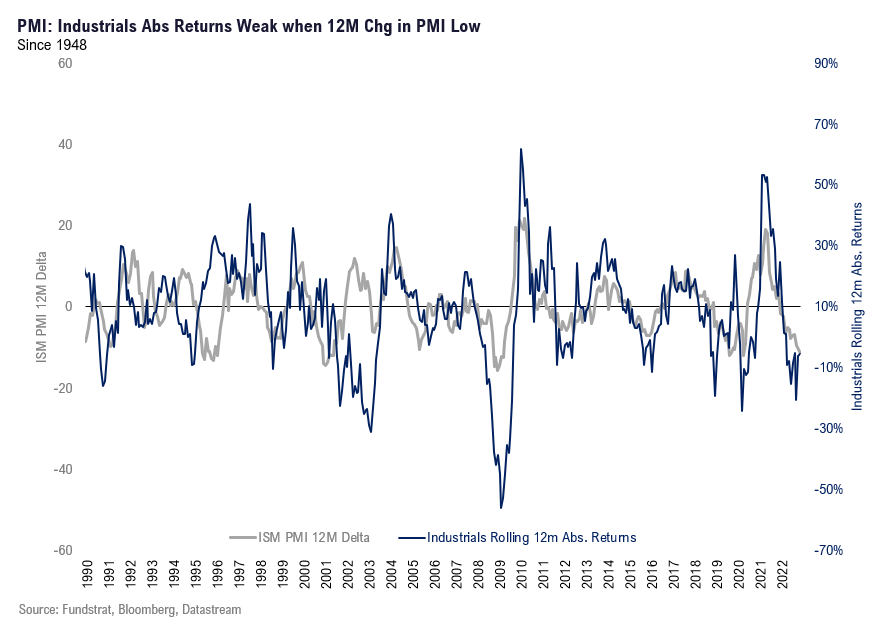
Whenever PMIs bottom (see below), Industrials tend to bottom. This first chart shows rolling change for US PMIs and US Industrials returns.
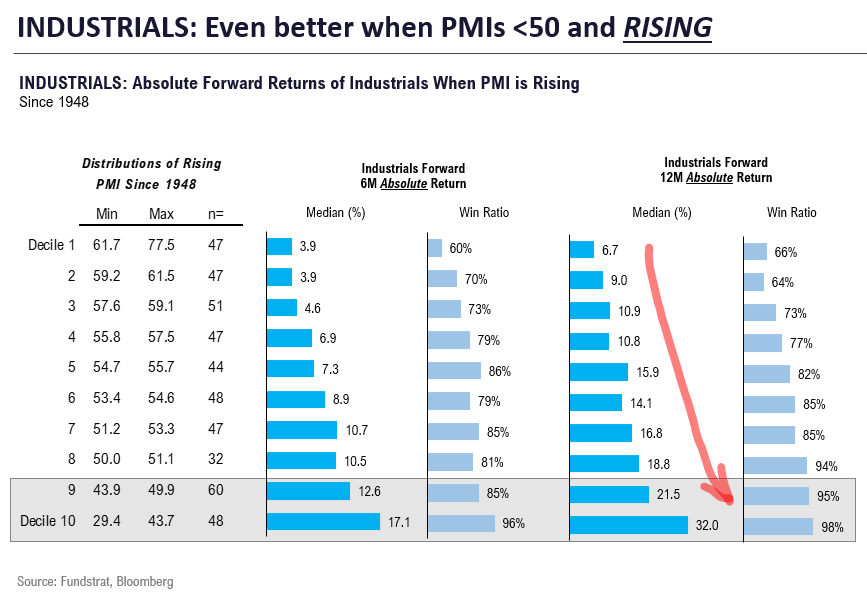
This distribution table puts this in a clearer light. When PMIs are rising and from low levels, Industrials see strong gains.
- Since 1948, when PMIs are over 50 and are rising (n=60), Industrials see positive forward 6M and 12M gains of 85%/95% of the time with median gains of +12.6%/21.5%, respectively.
- Those are very favorable risk/reward and high absolute return opportunities.
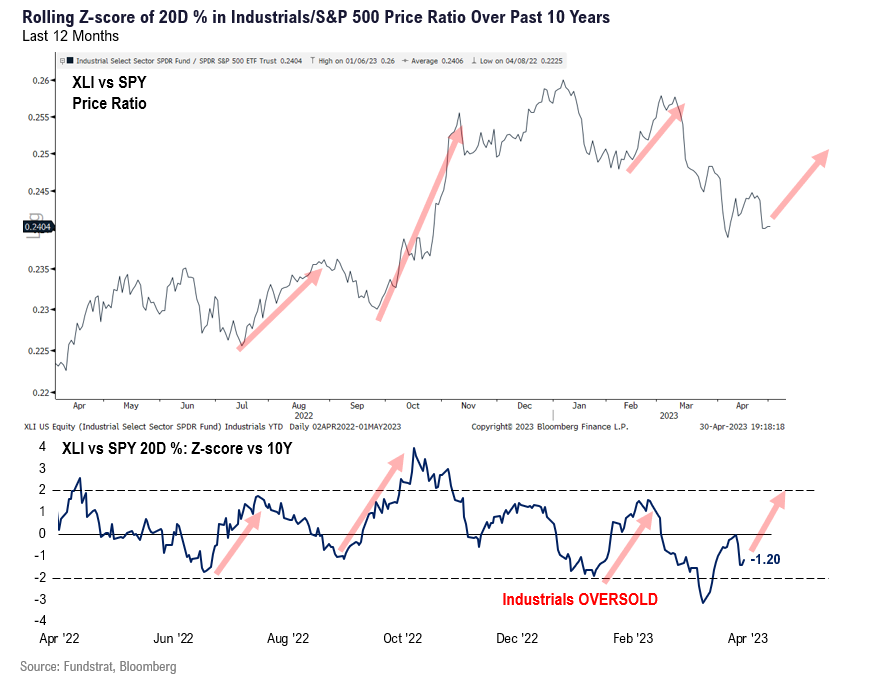
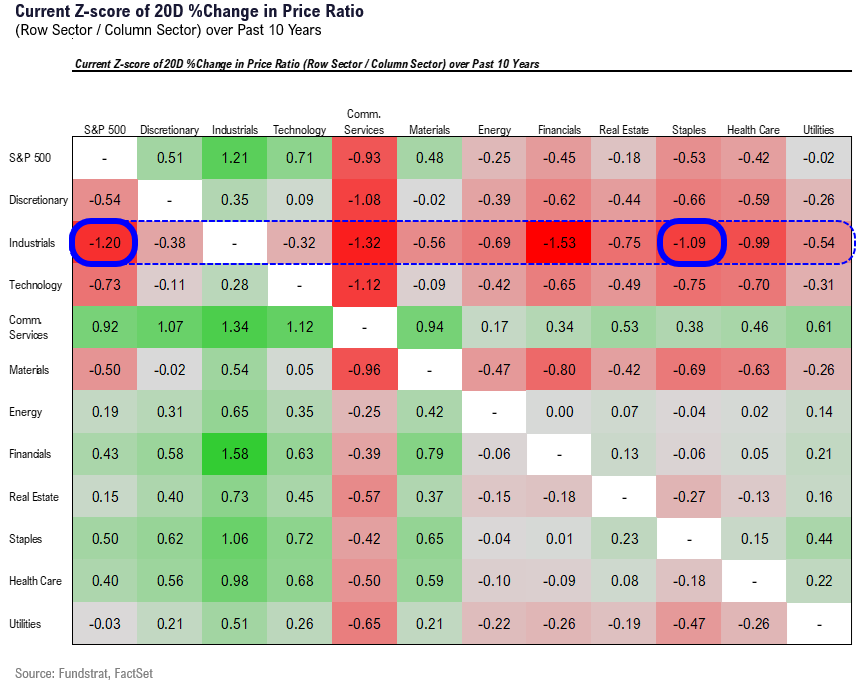
Industrials are oversold vs S&P 500 on 20D %-change, with a z-score of -1.2.
- The top chart is the relative price ratio of Industrials vs S&P 500
- The bottom is the z-score of the 20D % change.
- The most recent 4 times this was seen, Industrials staged strong rallies vs the broader market.
- This is not that different than the signal we highlighted two weeks ago regarding FAANG/Technology. And we know that FAANG powered higher in the past two weeks
And Industrials are the most oversold vs other sectors, particularly against Staples.
_____________________________
34 Granny Shot Ideas: We performed our quarterly rebalance on 4/26. Full stock list here –> Click here
______________________________
We publish on a 3-day a week schedule:
Monday
SKIP TUESDAY
Wednesday
SKIP THURSDAY
Friday

