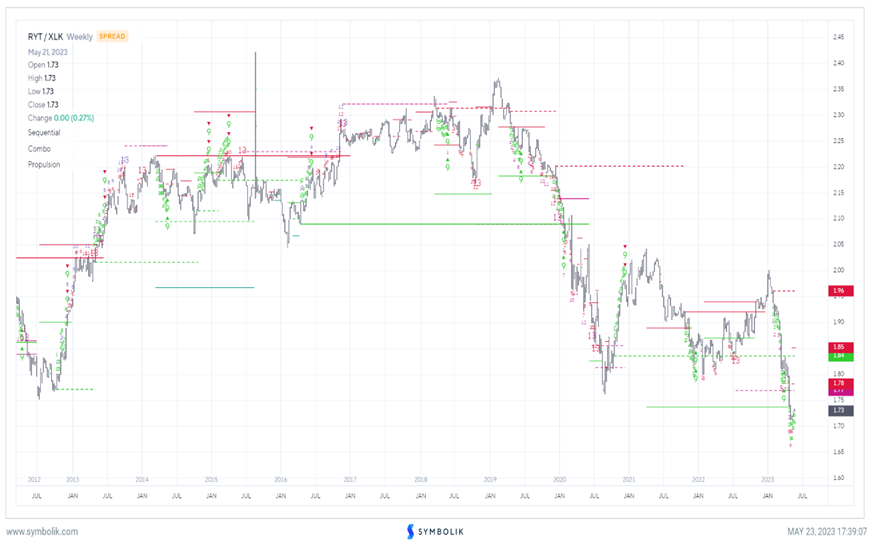
Equal-Weighted Technology vs. XLK has broken to the lowest levels since ’09

- Minor SPX weakness hasn’t caused much damage; Rally back up above 4235+ likely
- Equal-weighted Technology has hit the lowest levels relative to XLK since 2009
- FXI breakdown could lead to near-term underperformance for China until June

Trend still bullish – Expecting upcoming push back above SPX-4200 –
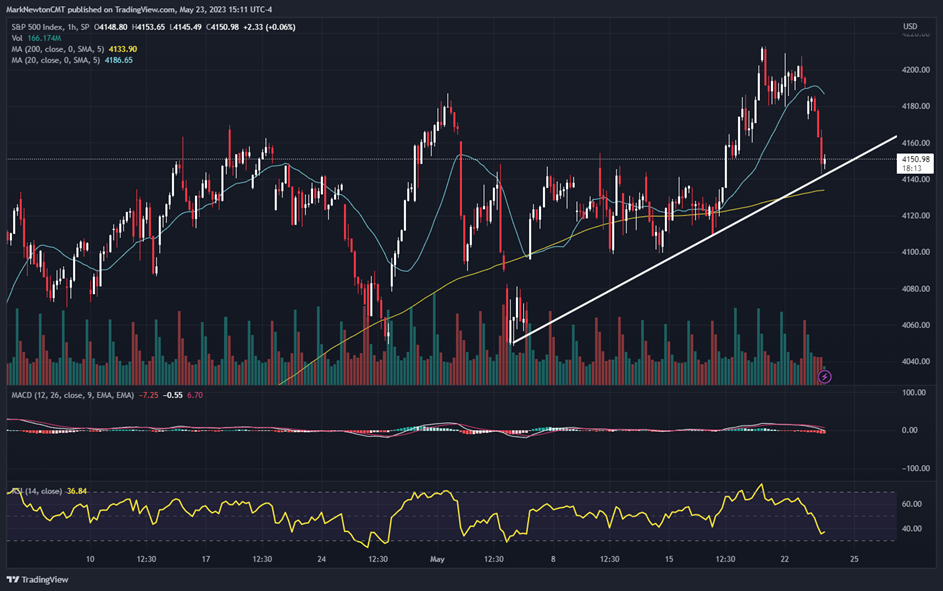
Tuesday’s minor pullback hasn’t caused much technical damage. While prices did pull back to multi-day lows, this area of support near 4140 lines up with the uptrend from early May along with the initial peaks of the first rally off early May lows. (5/5-5/15).
Five sectors fell more than 1% in Tuesday’s trading: Healthcare, Industrials, Discretionary, Technology, and Communication Services. On an Equal-weighted basis, Technology was Tuesday’s worst performing sector.
Over the last month, only three Equal-weighted sectors have beaten the Equal-weighted S&P in performance: Technology, Industrials, and Discretionary. Meanwhile, Energy, Utilities and Materials have been the worst performing. Some evidence of Energy starting to stabilize is noticeable in recent days, and this sector should be one to favor for strength into June.
Two levels are key to watch on the downside for the weeks to come. 4098 lines up with lows from 5/10-5/12. Until this area is broken, the trend remains in good shape. If 4098 is broken, this will result in a retest of 4048, which remains May low, and the larger “line in the sand.”
At present, as the hourly SPX chart shows below, this weakness looks to have reached an attractive risk/reward spot for S&P and rallies back to test and break out above 5/19 highs at 4219.78 looks likely. DeMark-based TD Propulsion levels on SPX lie at 4237, which I suspect should be tested on strength in the week ahead.
Equal-weighted Technology ETF vs. XLK has sunk to the lowest levels in more than a decade
It’s important to see how dramatically Equal-weighted Tech has been slipping vs. the S&P SPDR Select Technology ETF, XLK -0.25% , which is heavily dominated by AAPL 0.04% , MSFT -0.23% , GOOGL 1.14% and other large-cap Technology.
While Equal-weighted Technology has outperformed SPX over the last month, with returns through 5/23/23 of 1.41%, vs +0.29% in SPX, it lags the XLK -0.25% sharply.
XLK has achieved +5.20% in the rolling 30-day period, which along with XLC, are the only two major S&P SPDR sector ETF’s to be up more than 5% in the last month.
Overall, a plummeting to new relative lows in Equal-weighted Tech vs. XLK to the lowest levels in a dozen years makes it imperative to keep a close eye on Technology in the weeks ahead.
Any hint of AAPL holding former highs at $176, or other key high growth large-cap Tech names like META -0.31% , GOOGL 1.14% , or MSFT -0.23% starting to stall out and consolidate might result in market weakness unless other sectors can come to the rescue.
While Financials and Energy, along with Communication Services, Industrials in Equal-weighted terms are all beating S&P in Equal-weighted terms and cap-weighted form over the last week, more will need to be done to engineer a true breadth surge that can help the market hold up and/or rally if Technology starts to wobble. At present, Tech has recovered its weakness in April on an Equal-weighted basis, but markets seem to be nearing a more meaningful area of resistance, between 4235-4325 which likely holds rallies over the next few weeks.
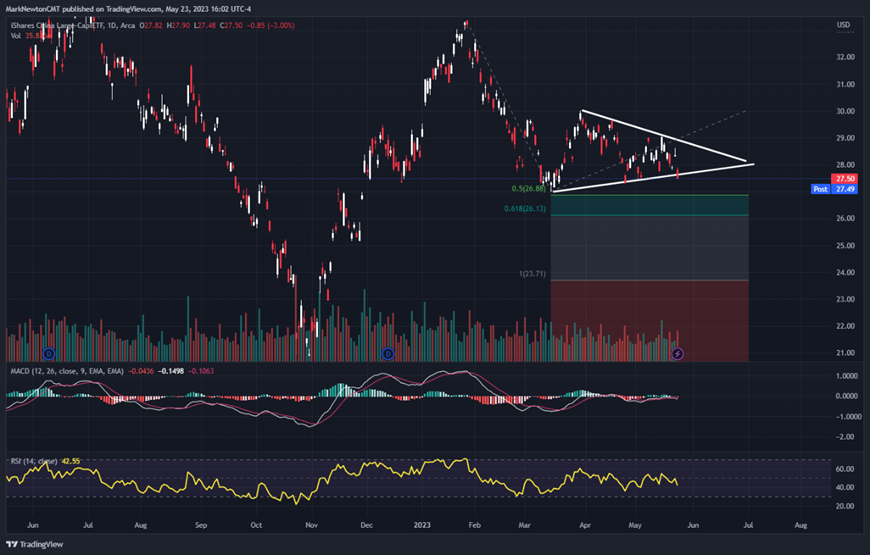
China has broken near-term triangle support and likely underperforms until early June
The two-month triangle pattern for China’s Large-Cap ETF (FXI 0.58% ) has been violated with Tuesday’s close at $27.49. This represents the lowest daily close since late April, suggesting a further period of downside weakness in the days/weeks to come.
Downside technical targets for FXI could first materialize near $25.68-$26, which lies near a 61.8% Fibonacci retracement of the prior October 2022-January 2023 advance.
However, when measuring the most recent decline to the initial 2023 pullback, which began in January, one cannot rule out a breach of $25.68, which might lead a bit lower, to $24.75-$25 before this reaches meaningful support.
Overall, cycle composite studies indicate that China likely should stabilize and start to bounce in June, and ratio charts (shown in this report) also indicate that China might try to stabilize vs. SPX in potentially two-weeks’ time after four months of underperformance.
At present, it appears like FXI likely has a bit more downside technically before this can bottom out. However, June might bring opportunity on weakness. We’ll revisit in two weeks.
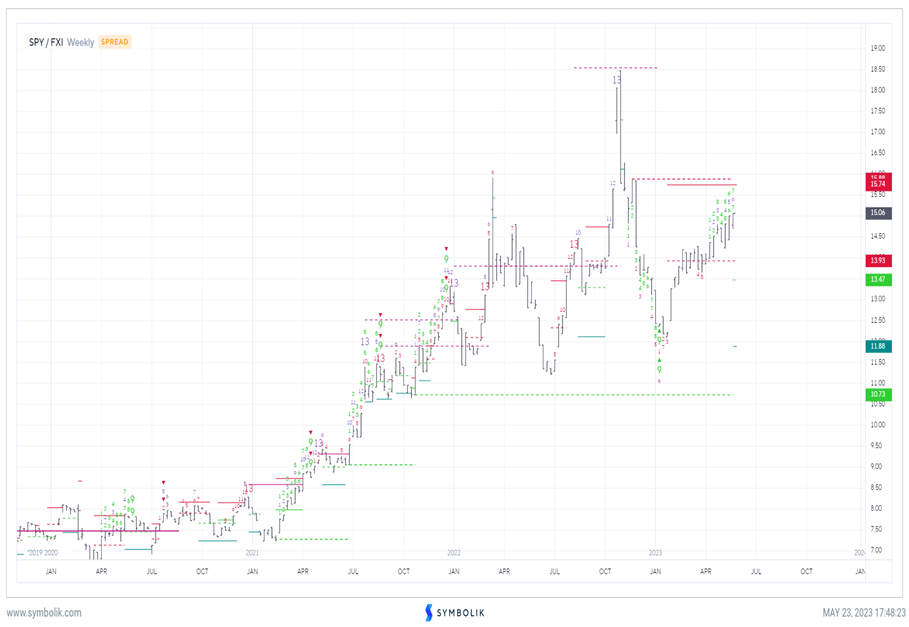
SPY continues to outperform China’s FXI since January; Another two weeks of gains might bring about exhaustion in this ratio
Recent underperformance in China has been nearly the opposite of what occurred from last October into year-end.
Since January of this year, SPX came back with a vengeance, and ratio charts of SPY to FXI have steadily moved higher.
This now looks to be possibly coming to an end as May comes to completion. My DeMark analysis shows a good likelihood of SPX likely stalling out in its uptrend to China’s Large-Cap ETF (FXI 0.58% ) as June gets underway.
Thus, since China has just broken down out of its triangle, while SPX remains trending higher, I anticipate that it’s a bit early to buy dips in Chinese Equities now. However, for those looking, one could have a window of opportunity once the TD Sell Setup materializes on ratio charts of SPY to FXI (this would necessitate another two weeks of outperformance in SPY vs FXI before possibly lining up).
As has been discussed above with absolute charts of FXI, I expect this to decline to $26 at a minimum and potentially $24.75-$25. This would likely represent an attractive risk/reward to buy dips.