Energy nearing an attractive entry point after WTI Crude decline


- SPX, QQQ likely to bottom out into next week as Yields roll over
- Breadth has reached new lows for 2023, and has gotten “So Bad, it’s Good”
- Energy likely will reach an attractive entry point early next week

US Equity markets should be nearing an area of support, and Treasury yields and more meaningful rallies might begin for both Equity indices and Treasuries starting next week, potentially coinciding with weaker economic data and/or more evidence of FOMC pausing their rate hikes. Movement down to SPX-4165-4200 looks important based on a number of different metrics, and might provide some stability into next week.
Technically, it’s hard saying Wednesday’s rebound was all that important technically, but directly coincided with weaker ADP data that resulted in an early sharp bounce for Equities. Downtrends remain intact, and momentum and breadth are downward sloping, but nearing short-term extreme levels.
Importantly, some of the groups which have underperformed dramatically in recent weeks now look to be closing in on support. Regional Banks, DJ Transportation Avg., and Small-cap ETF, IWM 0.92% , are all nearing support which looks to be important.
Overall, despite the ongoing downtrend, a meaningful low appears to be close for Equities and an ideal timeframe for this centers on next week. Equity markets are nearing oversold levels while fear is ramping up just as US Equity indices have entered the notorious “Bear Killer” month of October.
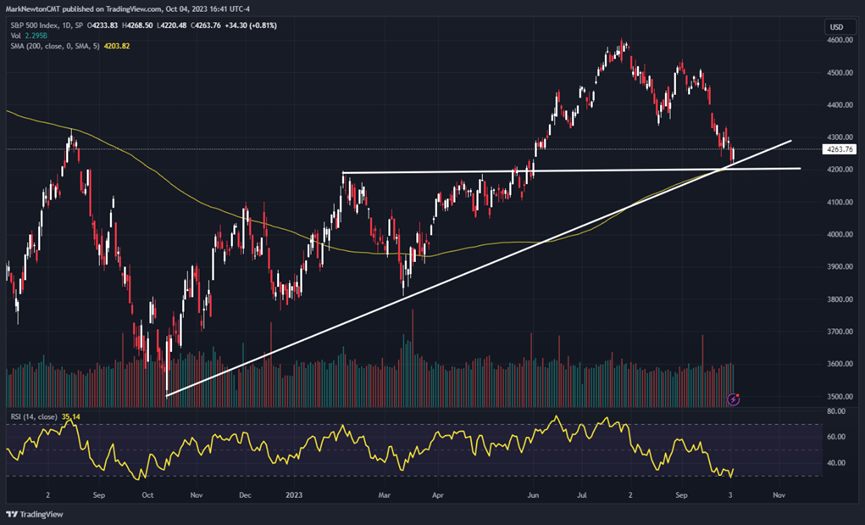
This daily chart shows a couple reasons for optimism structurally speaking. While past reports have concentrated on hourly wave counts, one can take a quick look at the daily S&P 500 chart to see why this area near $4200 might have appeal to buy dips.
Momentum has gotten short-term oversold just as price has neared its prominent uptrend from last October’s 2022 lows. Additionally, the rising 200-day moving average lies just below current levels along with prior peaks from February which should now act as support on weakness.
While I find it quite possible that SPX-4200 might be briefly undercut, which would throw a wrench into the analysis of those eyeing the 200-day m.a., meaningful support lies just below at 4165-85 ( I outlined last night why this area has importance.)
Overall, given fear levels and oversold breadth readings, markets look close to bottoming.
Breadth is now so bad, it’s good
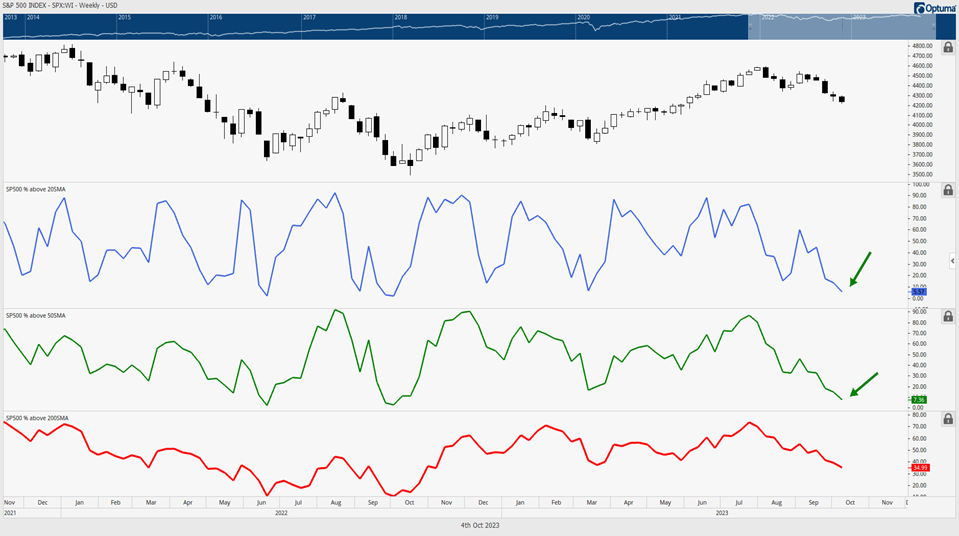
Don’t look now, but the percentage of SPX names above their 20-, 50-, and 200-day moving averages (m.a.) has now fallen to the lowest levels of the year, despite the broader averages having held weekly intermediate-term trendline support.
This is largely due to the bullish influence of Technology (Not just the dominant High Growth Technology stocks that represent big chunks of the indices (FANG, and/or Magnificent 7)
Percentage of SPX > 20 is now just 5.5%, which undercut March 2023 lows to reach new lows for the year (October 2022’s prominent Stock market low registered ~2% at the bottom).
SPX > 50 day is now just 7.36%, very compressed and readings under 10% happened at both of last year’s prominent lows which happened in June and October, not to mention the March 2020 low.
However, given that SPX maintains its intermediate-term uptrend (8% decline from late July has not violated the uptrend from last October, 2022) this weakness makes SPX appealing, as despite all the various sector weakness, US Equity indices have held up, and not violated support. Time wise, a low could happen between 10/6-10/12, lining up closely with last year’s bottom.
The Percentage of SPX constituents above their respective 20-day m.a. (Blue), 50-day m.a. (Green) and 200-day m.a. (Red) are shown below.
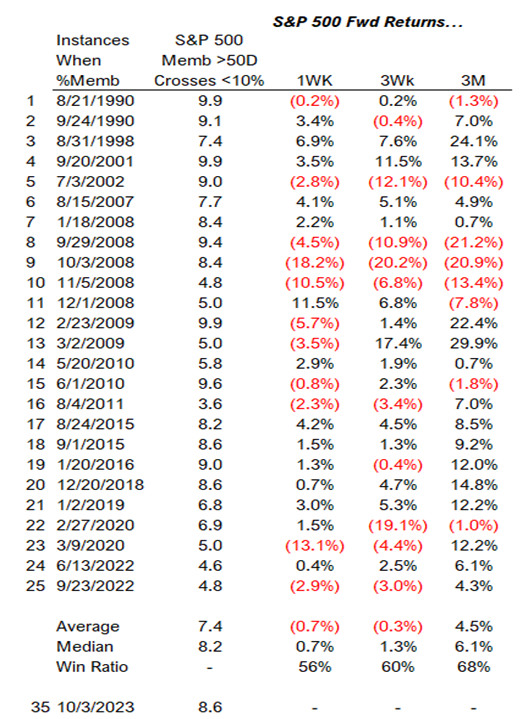
SPX historically has been attractive when breadth readings grow quite low
When SPX’s Percentage of Members which trade above their 50-day m.a. violates 10% it often signals a buying opportunity.
Interestingly enough, the median returns are quite positive, even on a 1-week basis, but more so on a 3-month basis. ( Studies go back over the last 30 years, excluding multiple occurrences in any given month.)
Given that RSI is oversold on daily charts, while the Percentage of SPX names above their 20, and 50-day m.a.’s are quite compressed and both under 10%, it appears like SPX could be getting close yet again.
Combining Elliott-wave patterns with DeMark exhaustion indicators, bullish seasonality and bearish sentiment readings, along with the fact that SPX remains trending higher from last October 2022 lows despite its 8% decline, a market bottom looks near, particularly within the next 3-5 trading days.
Crude Oil looks to be nearing a low; Energy likely will bounce back to highs in October
Recent weakness in WTI Crude to the lowest levels since early September has sounded alarm bells that Crude might be finally starting its seasonal correction.
The EIA crude inventory report highlighted several concerns for Crude, most notably that the four-week average implied gasoline demand fell to the lowest level in 25 years for this time of year (Bloomberg). October is also normally a time for seasonal refinery maintenance which has the potential to reduce demand.
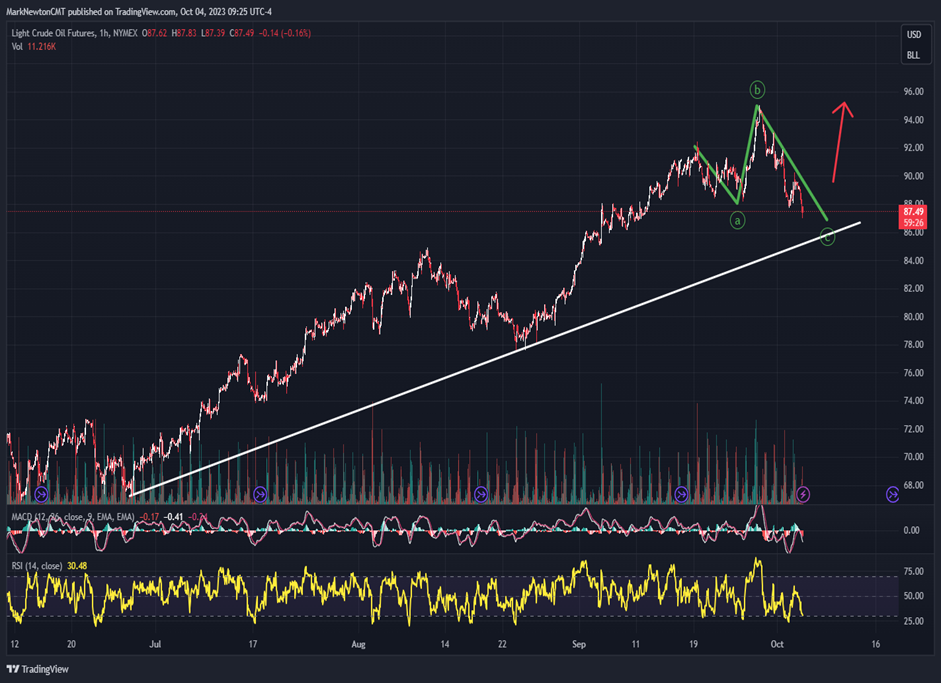
Technically, I expect an upcoming low for Crude which might materialize next week on a bit more weakness. The combination of Elliott-wave patterns along with bullish weekly momentum suggests that this weakness over the last four of five weeks likely won’t pullback too much more before hitting meaningful support.
Front month futures have hit the 38.2% Fibonacci level of support from the rally from late June 2023 into late September. This level also lines up with prior peaks from August 2023 as well as an uptrend from June lows.
However, the extent of the decline based on high to low range on heavier volume and lack of DeMark exhaustion likely could result in another 2-3 more days of weakness before this bottoms out.
My view is that WTI Crude generic contract is unlikely to undercut $81, so any pullback under $84 into end of week/early next week makes this attractive and could represent support on this decline.
The green lines shown below represent the Elliott-wave pattern which looks to represent an ABC pattern which likely is nearing a low before pushing back to fractional new highs.
Overall, while seasonal weakness very well could affect Crude oil from November into January of next year, I’m skeptical that October will show much more weakness. Declines in ETF’s like OIH, XLE and XOP are all nearing initial support, and this should represent opportunity on this first big pullback after this runup.
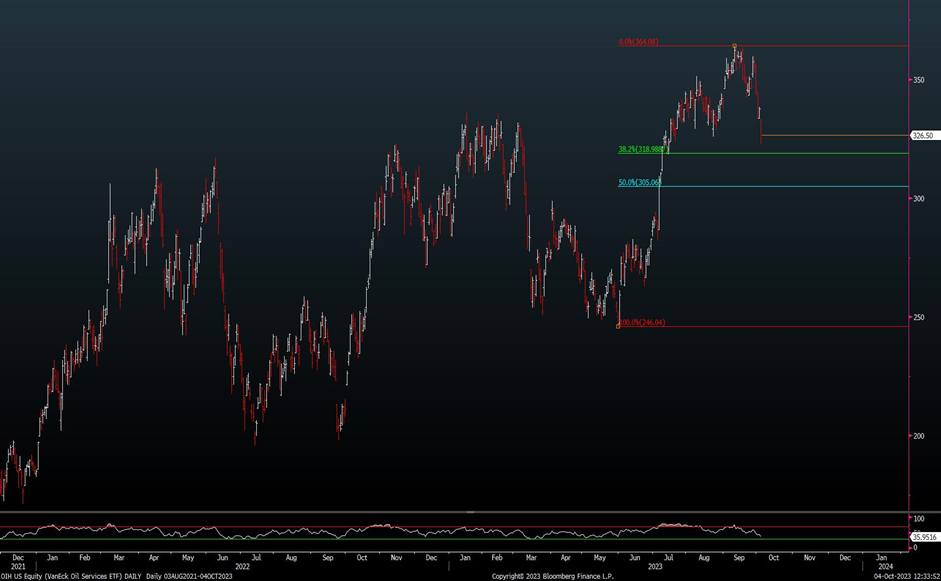
OIH will be attractive on weakness into next week
OIH is my preferred way to play Energy among the major Energy ETF’s and is just nearing its first 38.2% Fibonacci area of support.
I expect that $319 could prove important, but feel that $305-$307 would be a stronger area of technical support before this stabilizes and pushes back 364 and a bit higher.
Key stocks which look technically attractive to buy on weakness include MPC 0.84% , FANG -0.85% , OXY 0.47% , VLO 0.72% , HES 0.34% , and LNG 1.14% .
OIH -0.15% shown below, has lost more than 11% since peaking in mid-September. Momentum is now nearing oversold levels on a daily basis, and DeMark indicators like TD Propulsion seem to indicate that XLE, OIH and XOP are all nearing support.
While I do have some concern about the degree of momentum deterioration on this pullback, which could be a negative for Energy and for Crude oil between November and January unless prices snap back right away, I don’t expect much further weakness on this first pullback from mid-September.
My cycle composite for Crude and XLE which I highlighted last month (and will show again next week) does show the potential for Q4 weakness into early 2024 before Crude turns back to new highs and exceeds $100, but I’m expecting that Energy could be tradable for a low within a week, and it looks wrong to abandon Energy longs here technically for those with a 3-5 week perspective or longer. If this sector fails to bounce back to highs into late October, then I’ll review Energy for additional evidence of potential Q4 weakness.