

“Bad news is good news” for Equities as yields plunge on economic data


- SPX and QQQ still might not be “out of the woods”, but an encouraging rally
- Gold and Silver nearing initial trading areas of importance
- UPTICK long BSX -0.55% gapped higher on good volume. Move to $58 likely

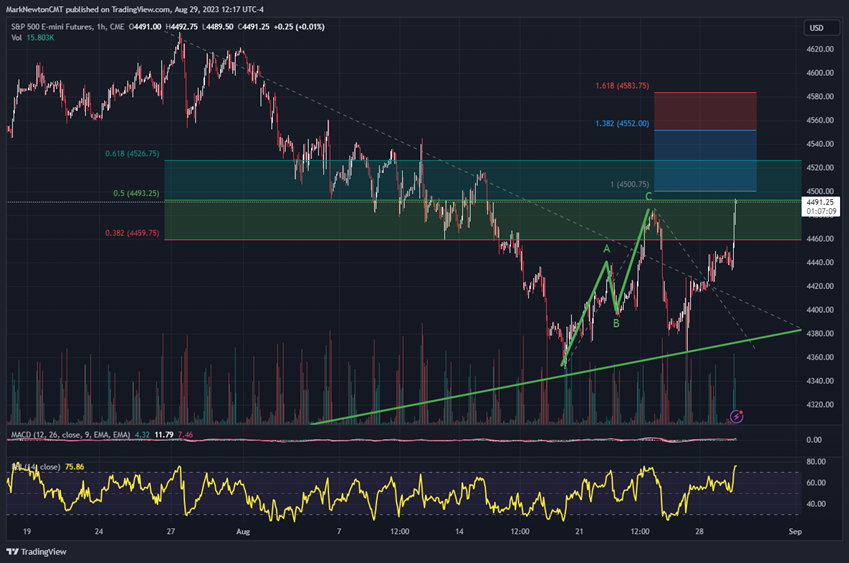
Despite Tuesday’s strong surge, hourly overbought conditions when weekly momentum is negative don’t normally represent the ideal time to chase a three-day rally. While I am bullish for SPX gains in September, it looks like a poor risk/reward in the short run heading into a very busy end of the month.
My bottom line thoughts haven’t changed. “While I suspected a low was close, I cannot yet confirm that it’s “The Low”. Moreover, it’s still tough to rule out weakness over the next week”. However, it’s thought that pullbacks will make SPX and QQQ attractive before kicking off a stronger rally.
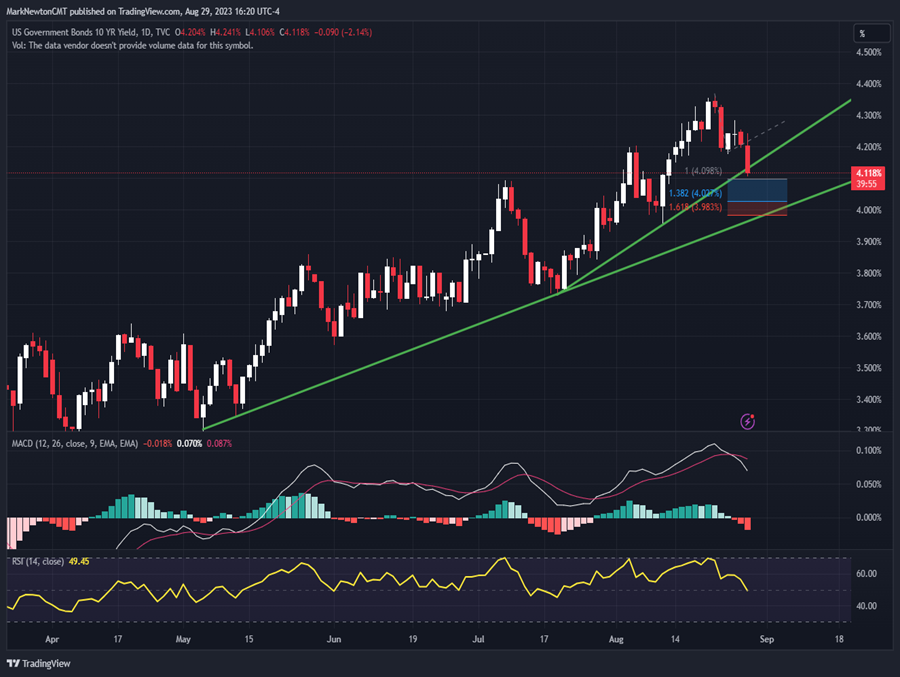
US Treasury yields plunged down to initial support on Tuesday’s JOLTS data. The question most investors have is whether this recent pullback in yields can continue. While I expect further intermediate-term weakness in yields into next Summer, 2024, Friday’s Jobs report will need to also come in weak and join JOLTS to help TNX undercut 4.0%.
Thus, weak economic news has led stocks higher over the last week. However, I’m uncertain that this trend continues uninterrupted. The next 3-5 trading days will be very important in this regard. I don’t mind holding off on jumping to conclusions on this three-day rally, and will either look to wait for pullbacks into next week, or be forced to join at higher levels if/when this trend continues higher.
Elliott-wave projections show the initial move from 8/18 lows is now equal to the rally since last Friday at a price right above SPX 4500. This represents also a Fibonacci-based 61.8% retracement of the entire decline from late July.
Overall, on the upside, SPX has “no business” being over 4550 without expecting a push higher to test all-time highs. At present, I believe this is quite premature, but will respect it if it happens.
Under 4458, the prior peak from last Thursday 8/24, has initial importance as support. Under lies 4417 which was Monday’s intra-day peak. Under this level would result in a retest and likely break of SPX-4350. Overall, I am not fond of the current risk/reward on a 3-5 day basis, but believe US Equity markets will show their hand by Friday’s close. (9/1/23)
Source: Trading View
US Treasury yields have begun the process of rolling over; However, this might not prove linear. Yields near support.
A quick pullback to near-term support for Treasury 10-year yields has many wondering if the economy is in fact, “hitting a brick wall” given the softening in the labor market.
I expect that an immediate break of 4.10% would sound a warning about momentum beginning to roll over. However, it’s the break of TNX 4.00% that has more technical importance, as this not only lines up with the intermediate-term trend from this Spring, but also remains a very important psychological level.
For now, I suspect that the next 3-5 days will answer lots of questions about this trend. Ideally, yields would bottom and turn back higher into early September before a larger pullback gets underway.
TLT has near-term resistance near $97.35 which should prove important into Wednesday’s session. While not shown, former July lows near $98.85 are also important as this adjoins a larger area of former support (now resistance) for TLT and should prove very tough to exceed in the near-term. In the near-term, I suspect that yields are nearing a low (prices nearing resistance) Monthly TD signals of exhaustion remain quite premature, and currently show 10 counts per TD Combo and TD Sequential. This could be a potential problem for those attempting to make the case that TLT has made a long-term bottom just yet.
Trading View charts of TNX are shown below, with 4.10% important and also 4.00%.
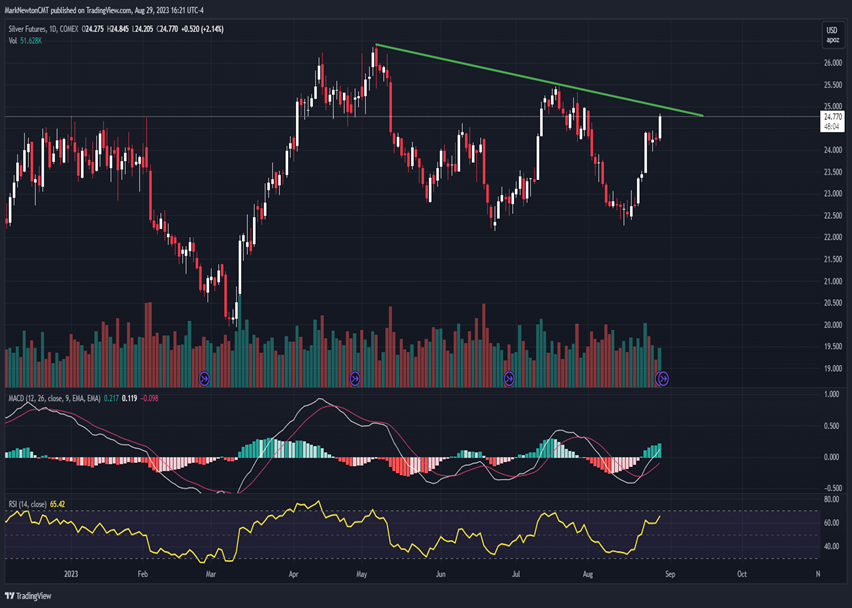
Silver and Gold nearing initial upside targets on first serious rally off the lows
Precious and base metals finally began to show some signs of life during Tuesday’s trading. (One could also say the same about cryptocurrencies and Chinese Equities)
At present, rallies in Silver and Gold both look to be nearing initial resistance. To expect that rallies continue uninterrupted during this seasonally bullish time, real interest rates would likely have to continue to weaken sharply throughout September.
I view Silver to be technically attractive for the last four months of the year. However, the area from $25-$25.50 is going to prove important, and Silver has run up nearly nine percent in the last two weeks of trading.
Bottom line, Silver and Gold are attractive to expect continued advances if $25.50 is exceeded for Silver Futures and 1990 is exceeded for Gold. Until that time, the better risk/reward scenario would call for waiting for either breakouts to occur, or for pullbacks to occur in the next couple weeks. This answer also likely depends on the near-term path for interest rates which we’ll know more about heading into next week.
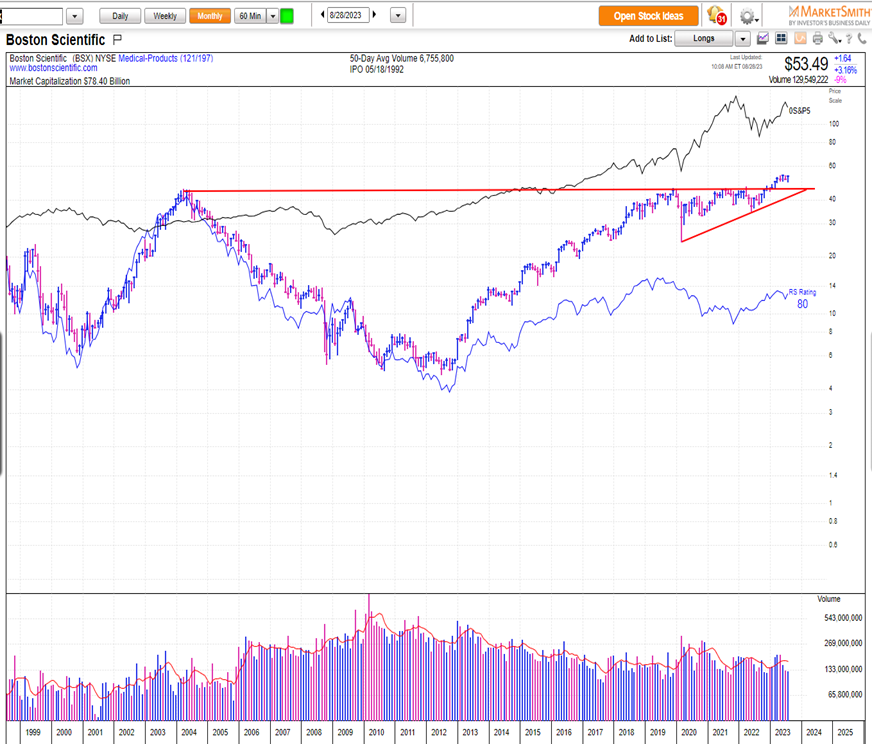
Boston Scientific gained ground on excellent volume
Boston Scientific (BSX -0.55% ) was added to my UPTICKS list back on 2/22/23, but yet largely traded sideways for a few months following its December 2022 breakout before turning up more sharply in February.
Long-term trends look stellar, technically speaking as the pattern from 2004 peaks resembled a large bullish consolidation which many technically inclined investors might correctly label a monthly Cup and Handle pattern.
Fundamental analysts weighed in positively on Tuesday that BSX -0.55% ’s “Pulsed field” ablation technique could help to win FDA approval. BSX promptly jumped nearly 6% on Monday, and volume rose to the highest levels since April 2023.
I expect further technical strength up to $58, which was my secondary resistance target mentioned in my technical research on BSX. Overall, the long-term pattern remains quite positive, and I expect that this weeks’ gains could eventually lead BSX up much higher to $71-$72.
At present, the wave structure from June 2022 shows this recent advance as potentially representing the fifth and final wave higher from last June before consolidation gets underway.
Overall, this remains attractive here technically, and do not expect much resistance to materialize before $58.
More from the author
Articles Read 1/2
🎁 Unlock 1 extra article by joining our Community!
Stay up to date with the latest articles. You’ll even get special recommendations weekly.
Already have an account? Sign In 4e0a5d-11ef68-0bd09e-5cd951-81fe36
Already have an account? Sign In 4e0a5d-11ef68-0bd09e-5cd951-81fe36

