

Acceleration of Selling growing closer to meaningful targets

- SPX could find support between 4300-4330, just fractionally below current levels
- Both AAPL and TSLA look to move a bit lower but both nearing possible support
- Ethereum has joined Bitcoin in violating trendline support; Time-based support in Sept.

US Equity markets likely have another 1-2 weeks of possible losses before a meaningful low; A bottoming post Jackson Hole makes sense from a timing standpoint that could line up with exhaustion signals for Treasuries and Equities.
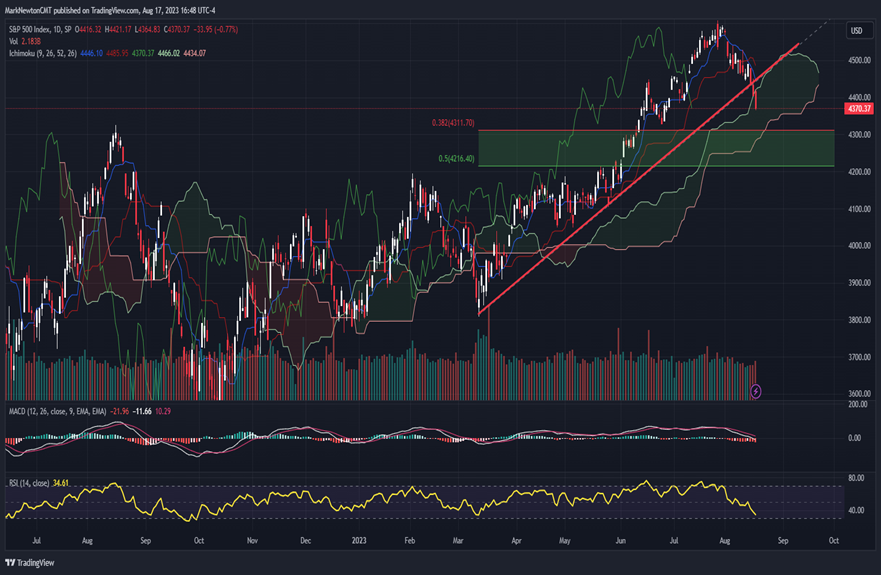
Overall, what started out as a mild, orderly decline has begun to pick up steam as SPX and QQQ both broke support. A couple key points worth noting:
- 4300-4330 stands out as the most probable area for SPX to bottom in the short-run. This lines up with Fibonacci targets from the May-July rally along with Gann-based targets from the 7/27 peak. Under 4300, while not expected, would cause a brief but severe move to 4200, which is the 50% retracement area of the entire rally off March lows and quite important.
- DeMark-based exhaustion for SPX and QQQ on daily charts suggests another week of possible weakness, and weekly TYX charts show a similar timeframe for possible peaks in 30-Year Treasury yields. Both of these could potentially line up by end of August for a low in both Stocks and bonds
- Sentiment polls have turned neutral from bullish readings from the end of July. Note, these haven’t yet gotten bearish, and that might need to happen ahead of any kind of meaningful low.
- Seasonality remains difficult in both August and September in pre-election years. However, price declines for US Indices thus far haven’t proven extreme enough to suggest that the next two months should face ongoing selling pressure. I expect September can be bullish.
- Technology, to its credit, has continued to hold up remarkably well based on relative trends of Equal-weighted Tech vs Equal-weighted SPX and has not broken weekly uptrends. Until/unless this were to change, Tech is thought to be a potential outperformer in September/October and NVDA’s earnings next week very well could serve as a positive catalyst for Semiconductor names.
- Yields on both 10 and 30-year Treasuries have pressed up to, but have not officially broken out above peaks in yields seen last October. While this might happen temporarily, I do not expect that yields have much upside given sentiment, Elliott patterns, DeMark analysis and cycles. However, Yields rising has been the chief culprit (in my view) for why stocks have been falling lately. The correlation remains strongly positive in the short run between stocks and bonds.
- US Equity markets still haven’t been showing much defensive outperformance. Some of this is based on interest rate sensitivity from sectors like Utilities and REITS. However, these sectors failed to strengthen ahead of markets peaking in July, and remain laggards, technically.
- Junk bond spreads haven’t been too adversely affected, and VIX has been remarkably subdued. Even on a rapid yield rise above 4%, the VIX trades at 17, not 35.
–To the bears credit, the following points are worth making:
A) Markets haven’t yet gotten dramatically oversold, though we’re getting much closer. As of Wednesday evening the SPX percentage of stocks > 20-day moving average dipped under 20%. In my experience when this breaches 10%, markets tend to be close to bottoming. RSI levels also aren’t officially oversold.
B) Fear levels aren’t that elevated
C) Yields are still pressing higher and have not peaked
D) Small-caps have rolled back over and Equal-weighted SPX and Russell 2k largely failed to break out above February 2023 peaks
In the bigger picture, the momentum gains and broadening out in US Stock indices from May through July was a bigger positive than the last 2.5 weeks of decline have been in terms of being negative. Moreover, cycles show a bullish 2nd half of 2023. I take this to mean that Stock indices are still showing short-term weakness only as part of a bullish intermediate-term advance that remains ongoing.
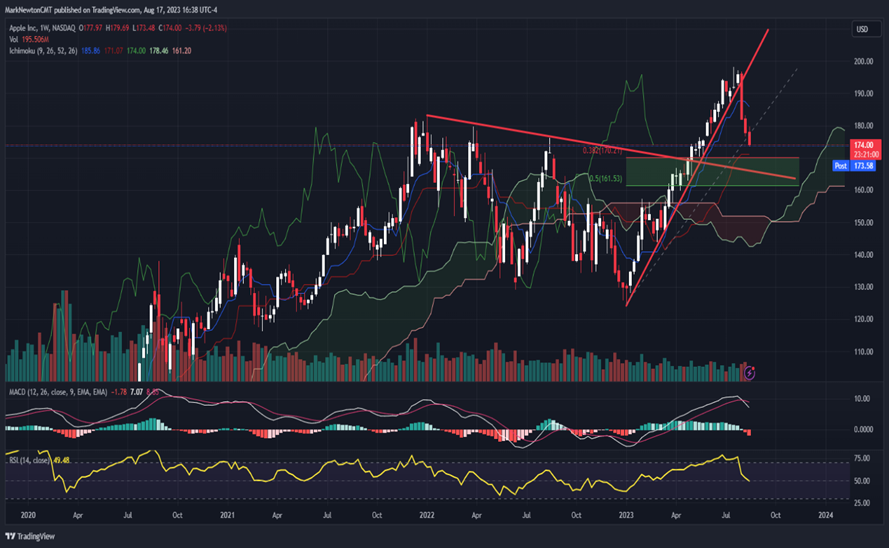
AAPL getting close to initial target at $170-1 (Bullets below)
Short-term negative, but expect bottom happens either near 170 (only $4 down) or 161, or -7%
Bigger picture, AAPL technical not too negative on intermediate-term basis. This rallied 60% from Jan into late July in 6 months before peaking.. So -12% losses off the highs certainly not great but also AAPL hasn’t done much damage.
AAPL still trades near upper quadrant of its range and now revisiting area of its former breakout. Technically that’s a good technical risk/reward following this pullback to the mid-$170’s.
Weekly momentum has rolled over to negative
AAPL not really overbought anymore and this pullback should create opportunity for those looking.
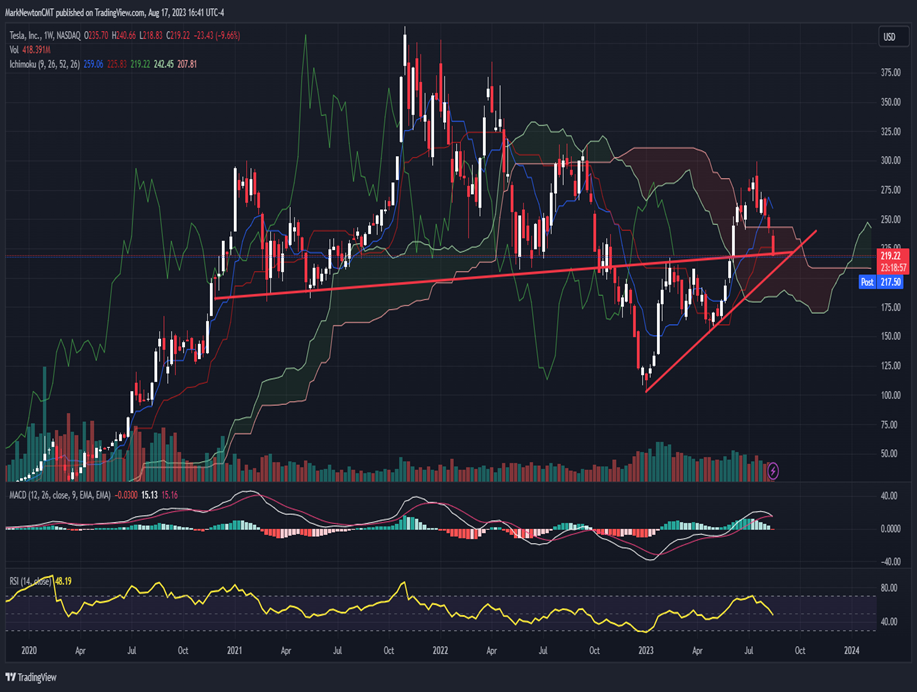
Tesla nearing first important support; However, TSLA cycles show potential for weakness into October
Short-term negative, down last 4 of 5 weeks, has dropped double the amount of what AAPL has, down more than 26% in 5 weeks.
TSLA now approaching a very important area near February 2023 highs. This was a battleground area for TSLA between $195-$205 between March-May 2021, May 2022, Feb. 2023, and now.
This area has proven quite important as an area for both lows and highs for this stock. So I expect technically it has some significance in the next week.
For now, intermediate-term picture in TSLA -2.04% is ok, and not as great as AAPL but needs to hold 200
Under 200 in TSLA would be a difficult drawdown into Sept/Oct where this could reach $152 from April lows 2023.
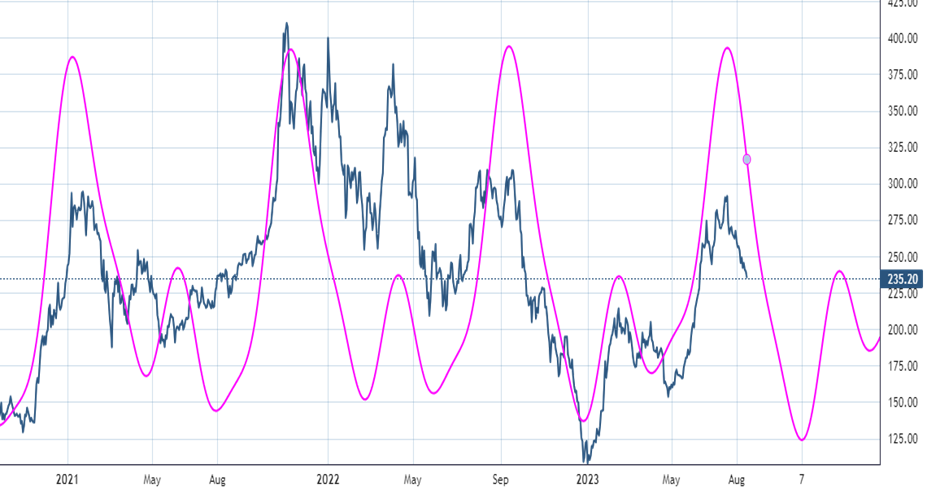
My TSLA cycle composite shows a decline into October, and then sharp bounce
TSLA cycles show a coming low and rally in back half of 2023
One of the key cycles for TSLA revolves around 196 trading days which has proven quite effective in recent years. When adding a few more cycles that show common harmonicity to this first cycle, the composite has worked quite well in determining former peaks and troughs.
This composite peaked this past Spring for TSLA and goes lower into October before bottoming, and a rally potentially ensues.
At present, I expect some kind of short-term low might develop in the next week near $200-205. However, a bounce and then break of $200 would be quite negative and would expect weakness down into October before a bottom happens, technically.
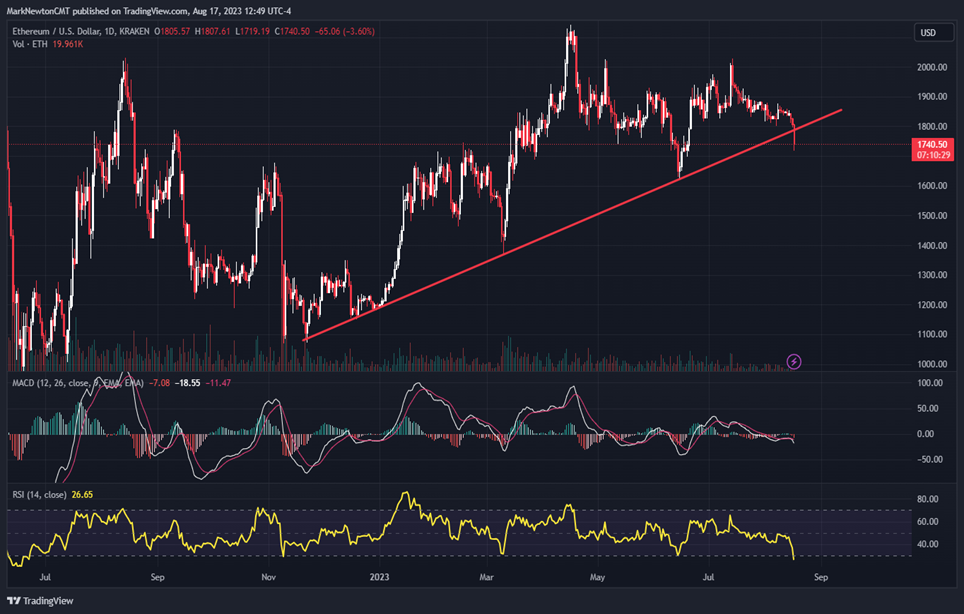
Ethereum joins Bitcoin in breaking its uptrend for 2023. Further weakness likely into late August/early September
(These comments are duplicated from those I wrote for the Cryptocurrency team headed by Sean Farrell today, Thursday 8/17/23. For those who desire daily Crypto technicals, please visit the website to find more info on how you can obtain this each weekday.)
Ethereum looks vulnerable to weakness in the short run following Thursday’s break of the uptrend which has guided ETHUSD since November lows of last year. The technical violation of support at $1800 is important as this has been successfully tested already twice since late last year, with each former test leading to a meaningful rebound.
In this instance, Thursday’s weakness likely results in an upcoming test and break of June lows, as Cryptocurrencies slowly but surely have begun to join in the weakness being seen in US Equities. Downside technical targets for support lie between $1485-$1520 which would represent an alternative wave extension from April 2023 highs along with a 61.8% Fibonacci area of support of the entire rally since last November.
Overall, this could take the shape of an ABC-type corrective pattern that should present opportunities to buy once this selloff is complete. Given that the advance from 11/21/22 lows to 4/16/2023 peaks, we’ve seen consistent turns at Fibonacci ratios of this former rally, with 38.2% arriving at mid-June bottoms while 61.8% time retracement happened right at the peak in mid-July.
If this plays out, then a bottom might happen near 9/10/23, which would be a 100% time-based retracement of this former rally, providing an attractive risk/reward entry for longs. Finally, it’s worth noting that Ethereum’s market-cap dominance chart is also breaking down and ETHBTC is lower by 1%. Thus, a defensive near-term stance makes sense unless ETH can regain $1900 or it moves down to areas of support at/near $1520 on the high end.
More from the author
Articles Read 1/2
🎁 Unlock 1 extra article by joining our Community!
Stay up to date with the latest articles. You’ll even get special recommendations weekly.
Already have an account? Sign In 86184c-350712-884dcc-37df1c-393168
Already have an account? Sign In 86184c-350712-884dcc-37df1c-393168

