


June 2023 Upticks

I will not be publishing a Daily Technical Strategy report today. Instead, in addition to this Upticks report, please find my Daily Technical Strategy Video update (6/29/2023) below.

Update
The 2nd quarter is drawing to a close, with price action having provided a lot more clarity than has been seen in months. While many fundamentally oriented still harbor concerns about earnings or the endgame for Fed rate hikes, the broadening out of the market which started a month ago cannot be denied. Technology’s dominance remains a common theme, yet Industrials, Consumer Discretionary, and Financials have turned up sharply in recent weeks. Moreover, breadth indicators have reflected this broadening and for the first time in months, many have seemingly begun to “throw in the towel” on shorts. With just a few days left in the month and quarter, NASDAQ 100 index is set to turn in potentially the best performance ever for the first half of a year.
Importantly, while sentiment has gradually improved over the last month, it remains early to say investors are greedy or complacent, and many institutional investors have refused to capitulate on defensive views. The market having suddenly “shown its hand” has produced quite a few Naysayers technically speaking which formerly was reserved just for fundamental and/or macro-oriented analysis. Those commenting on ‘overbought” conditions, or low volume, or selective participation provide some interesting insight to the rest of the investing public that’s invested in large-cap Technology. This initial skepticism is a far cry from “irrational exuberance” and/or speculative fervor that normally coincides near market tops. Moreover, this initial burst through resistance coinciding with skepticism allows one to remain invested with the idea of buying dips.
Overall, gains are still expected into mid-to-late July, but It’s doubtful that rallies will continue to surge higher uninterrupted with little to no consolidation into the Fall. Specifically, five factors typically warn of an impending correction and are important to keep an eye on in the weeks to come: First, evidence of complacency and/or rampant bullishness normally return to suggest an era of speculation has returned. While this recent rally has caused a few to abandon shorts, the bullishness hasn’t reached levels of concern. Some mild improvement in a few investor polls and/or a falling VIX doesn’t imply sentiment has turned all that optimistic, merely that prices have been rising. Furthermore, when investors and the Financial media are all talking about how bullish sentiment has become on a widespread basis, this doesn’t typically imply sentiment is all that bullish. When the naysayers abandon cautionary remarks about what “could” go wrong and decide to start buying massive amounts of upside call options, I think “That’s” the time to worry.
Second, defensive positioning normally always comes back with a vengeance prior to major market tops. This happened in late 2021, early 2020, and also was present heading into last August(2022). At the present, strong relative strength in Utilities, Staples, REITS and Healthcare, remains lacking. These groups have been the weakest performers over the last month. Third, evidence of negative momentum and breadth divergences normally always crop up before markets peak out. Prices push higher to new weekly or monthly highs, yet momentum does not follow. If anything, the last few weeks have brought about the opposite. Fourth, DeMark indicators normally will begin to signal evidence of upside exhaustion, with counter-trend TD Sequential and/or TD Combo “13 Countdown” signals present on weekly charts of SPY, or QQQ along with larger stocks like AAPL. This also remains premature, in my view, but could be in place by mid-July. Finally, cycles and pre-election year seasonality is turning more negative from May into October. The 1st and 2 quarters of 2023 represented the best six month stretch of the entire four-year cycle. This is now coming to a close. Historically, while the month of June and July typically have shown stellar performance in pre-election years, the months of August and September have not.
With regards to other factors outside of Equities which might help to corroborate this scenario, it’s important to point out that the US Dollar’s decline also could be supportive as to why rallies are possible over the next month. The US Dollar index (DXY) has consistently shown negative correlation with Equities and the most recent peak in the Dollar in late May directly coincided with rallies in Equities. Both the Dollar and also US Treasury yields look to have a negative technical trajectory for the month of July, and should pull back to new monthly lows. This specifically looks to be helpful for the possibility of further equity gains.
Style-wise, Growth has maintained its upward trajectory vs. Value, thanks to Large-cap Technology working well, while Energy and Financials have proven sub-par. Small-caps and mid-caps have both stabilized this past week and have shown some evidence that these can outperform into mid-July given price action of this past week. Thus, Small-cap strength might take the form of bounces in Financials and also Consumer Discretionary continuing higher, despite the latter showing overbought momentum.
Overall, bullish positioning continues to look correct into the start of Q3, despite ongoing economic, geopolitical and earnings-based concerns. Barring evidence of any technical deterioration, it’s likely that markets will push even higher into mid-to-late July ahead of a possible minor correction into August. Until evidence of more rampant overbought conditions joins forces with more bullish sentiment and some evidence of defensive strength and/or waning technical breadth, it’s arguably wrong to consider abandoning this rally based on overbought conditions alone when technical trends remain very much intact.
Methodology
- Relative strength vs. sector and index At/near 26-week and/or 52-week highs
- Positive momentum and/or Upward sloping moving averages on multiple timeframes
- Lack of DeMark exhaustion on daily, weekly, monthly and/or in combination based on TD Sequential and/or TD Combo indicators
- DeMark “TD 13 countdown Buys” utilizing TD Sequential and/or TD Combo indicators at/near lows on multiple timeframes
- Elliott-wave theory
- Positive momentum divergences (at/near lows for buy candidates), Lack of deterioration within its sector and at/near upper quartile of its annual range
- Above-average bullish bases for lengthy timeframes which might precede technical breakouts
Additions
Advanced Micro Devices (AMD 3.56% – $110.81)
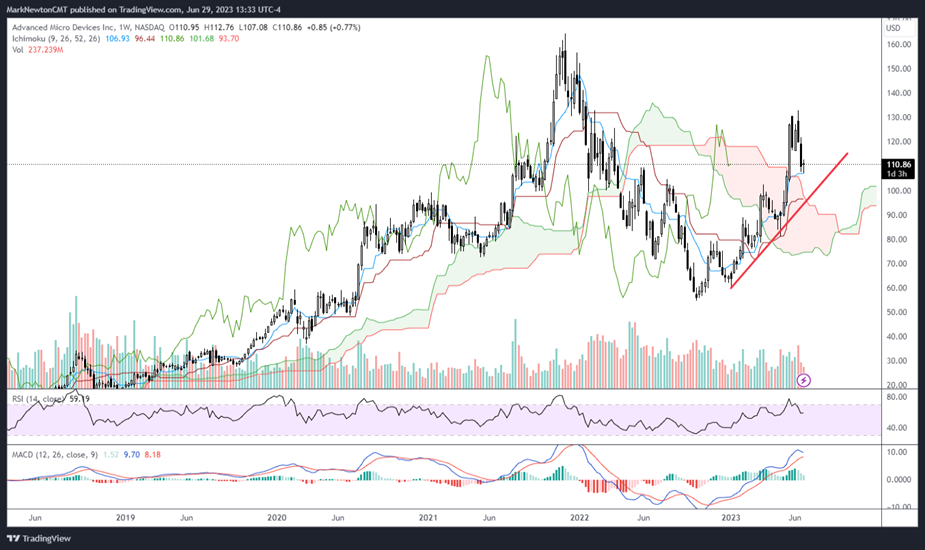
Recent consolidation creates what I view as an attractive risk/reward for AMD 3.56% which has outperformed all but one member of the 30 members of the Philadelphia Semiconductor index in Year-to-Date (YTD) performance. However, despite an 18% drawdown over the last few weeks, AMD remains very much within the ongoing uptrend from last year’s lows and still shows positive weekly momentum. DeMark-based exhaustion indicators have not yet given much of a reason for concern, and the until there’s evidence of trend deterioration and/or negative momentum divergence at work, it’s appealing to consider AMD 3.56% at current levels for a rise to test and potentially exceed recent June highs. Eventual upside targets lie near $132, then $140 which could prove important on a rally into mid-to-late July. Conversely, weekly closes back under $102, while not immediately expected, would serve as warning sign regarding the above-average chance of additional consolidation. Overall, AMD looks to be one of the better Semi names from a risk-reward perspective following its recent consolidation as part of its existing sharp uptrend.
Freeport McMoran (FCX -1.18% – $39.40)
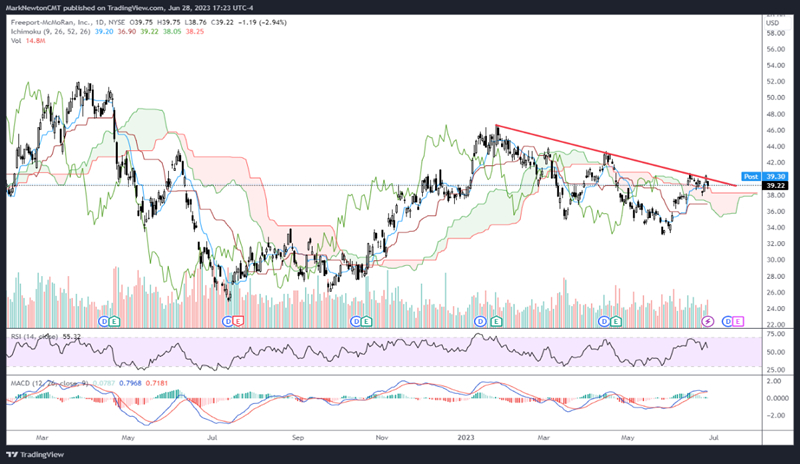
FCX -1.18% stands out as one of the better liquid names which tracks the price of Copper fairly closely. Recent gains since late May have challenged the larger downtrend from early 2023,and this pattern very much resembles a three-wave corrective pattern from an Elliott-standpoint. While the stock might seem to be up against fairly prominent resistance, a breakout of this $42 level looks probable in the near-term given Copper’s technical prospects and cycles. This should result in an upcoming push higher to $44 and then eventually to test and exceed March 2022 peaks near $52. Momentum indicators like MACD are just crossing back to positive on weekly charts, while RSI is mid-range and not overbought. Bottom line, given FCX’s uptick in momentum of late and China’s talk of possible stimulus which could positively affect Copper, FCX looks appealing to position long here and then add on a move over $44 in the weeks/months ahead.
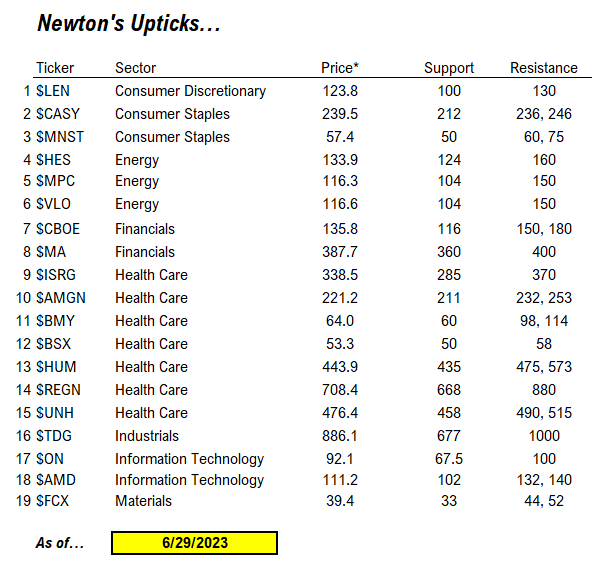
Upticks
More from the author
Articles Read 1/2
🎁 Unlock 1 extra article by joining our Community!
Stay up to date with the latest articles. You’ll even get special recommendations weekly.
Already have an account? Sign In e732ec-0aa686-233e28-4c17e9-8fd6a3
Already have an account? Sign In e732ec-0aa686-233e28-4c17e9-8fd6a3

