

Cases getting obliterated in US states with high vaccine rates... 7 reasons stocks are "well bid" into Fed testimony this week

Click HERE to access the FSInsight COVID-19 Daily Chartbook.
We are shifting to a 4-day a week publication schedule:
- Monday
- Tuesday
- Wednesday
- SKIP THURSDAY
- Friday
STRATEGY: 7 reasons stocks are “well bid” into Fed testimony this week
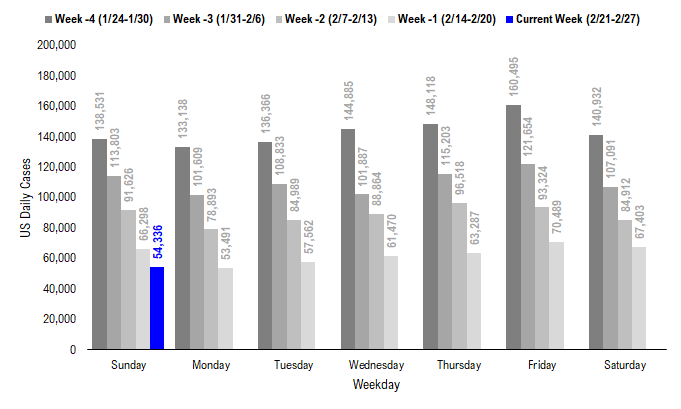
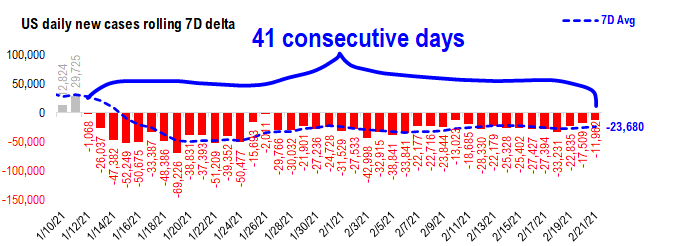
The case trends in the US remain positive and daily cases on Sunday came in at 54,336, and for 41 consecutive days, the cases are lower vs 7D ago. So barring a sudden surge, cases are set to fall below 50,000 either Monday or Tuesday this week. As far as numbers go, that is a big deal. At this pace of improvement:
– US daily cases less than 50,000 this week
– US daily cases less than 25,000 early March
– trajectory is very good
– still seems like a perception gap between policymakers/media/public vs incoming data
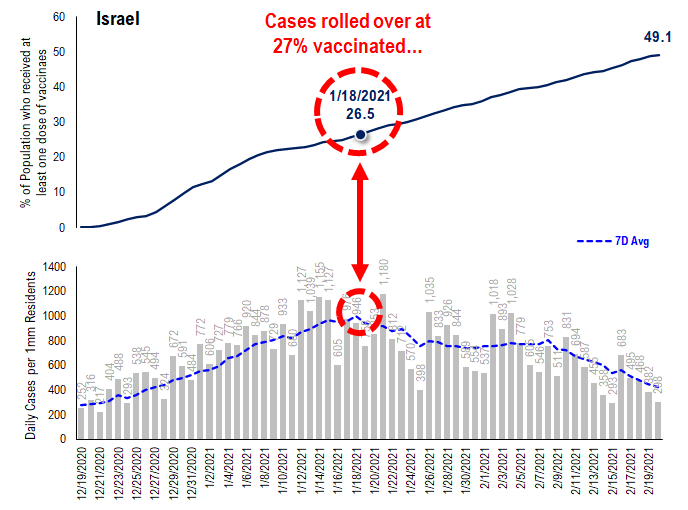
Israel cases started to rollover HARD after 25% of residents vaccinated…
Israel is proof positive that the Pfizer COVID-19 vaccine is effective. Last week, another study by Sheba Medical Center showed dramatic efficacy of the PFE vaccine. But the reported case data is already showing the effectiveness of the vaccine in slowing cases.
– at this point, about 50% of Israel’s population has received at least 1-dose.
– the vaccine effectiveness rises over time
– but cases started to rollover hard once about ~25% of the population was vaccinated (see below)
– thus, we should be watching this figure in the US closely.
Source: Fundstrat and Worldindata.org
Daily cases are getting obliterated in states with high vaccination rates…
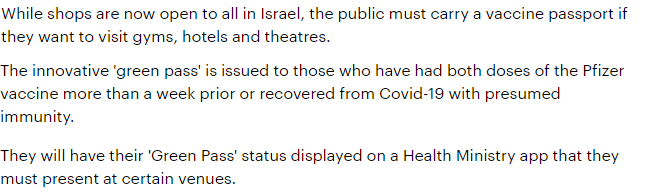
In the US, no state has 25% of its residents getting 1-dose, but the aggregate combined vaccine + infection is ~60% for 4 state states now:
– South Dakota
– North Dakota
– Rhode Island
– Arizona
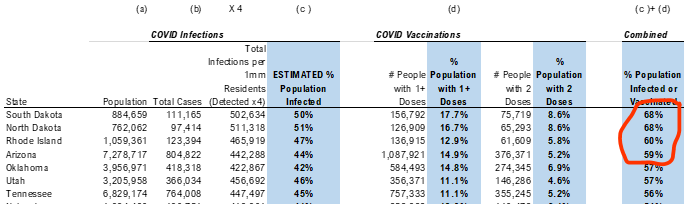
Source: COVID-19 Tracking, World in data and Fundstrat
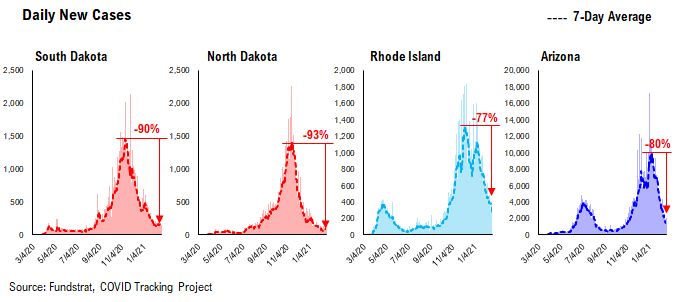
The daily case trends show COVID-19 cases utterly collapsing in these states. While this may be a “loaded word,” herd immunity certainly looks like it has been reached in these states:
– SD down 90%
– ND down 93%
– RI down 77%
– AZ down 80%
Wow.
STRATEGY: 7 reasons stocks are “buy the dip” even as the bond market is on “edge” with Fed Chair Powell set to speak…
Fed Chair Powell is set to speak before Congress this week. And many of our clients have already expressed some apprehension about this week. Part of this reflects the fact that bond yields have been steadily rising and equity investors are nervous that the bond market might reach some sort of “breaking point” next week during the testimony. The report by the Fed was published on Friday (see link below).
Source: https://www.federalreserve.gov/monetarypolicy/files/20210219_mprfullreport.pdf
So it is possible that stocks could act nervously into and during this testimony. The larger story arc, in our view, is that equities have multiple positive supports and this constructive backdrop likely prevents a larger risk-off spillover. In fact, this past week is evidence of this. Despite the surge in the VIX and the rollover of technology stocks, the indices actually were flat and Epicenter stocks were positive.
More specifically, we see 7 positive supports for stocks in the near-term:
1. Washington is moving forward with passing a large fiscal relief package, and Treasury Sec. Yellen has made a forceful case for it
2. Fed has been vocal in policy stance (last week’s minutes affirmed) and Fed is patient
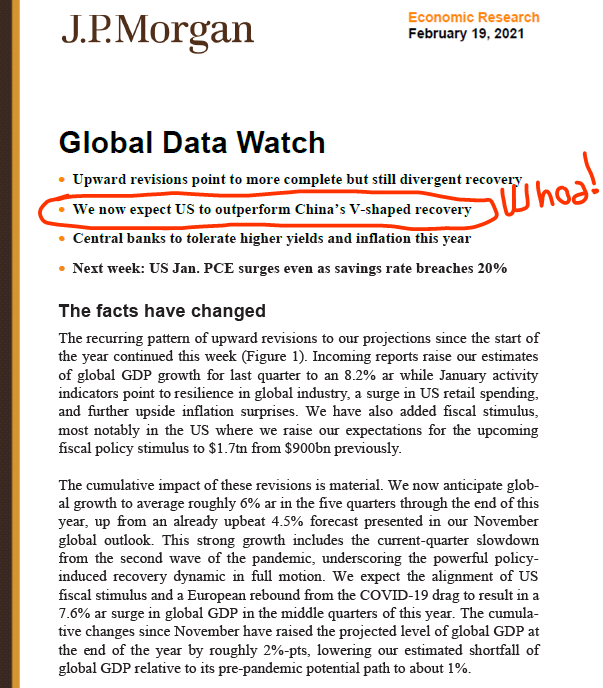
3. US economy is re-opening and economic momentum is strong — so strong, JPMorgan’s Chief Economist, Bruce Kasman, says US V-shape recovery will soon surpass China. Wow (see below).
4. There remains a substantial perception gap between policymakers/media and COVID-19 realized data, and a closing of this gap is positive for risk assets.
5. Millennials are steadily allocating assets toward equities, and the surge in retail brokerage account openings is evidence of this.
6. Bonds are becoming less attractive total return vehicles as inflationary expectation are increasing, boosting the attractiveness of equities
7. VIX is steadily declining, and as we pointed out in our 2021 Outlook, periods of declining volatility historically led to big equity gains, particularly for cyclicals.
Regarding US economic momentum, this bullet point from JPMorgan Economists really underscores the improving US economic momentum. Of course, a big part of this is JPMorgan’s expectation that fiscal relief package is substantially larger than their original expectations.
Source: JPMorgan
STRATEGY: Still a lot of runway for Epicenter stocks to catch-up… aka, still OW Epicenter
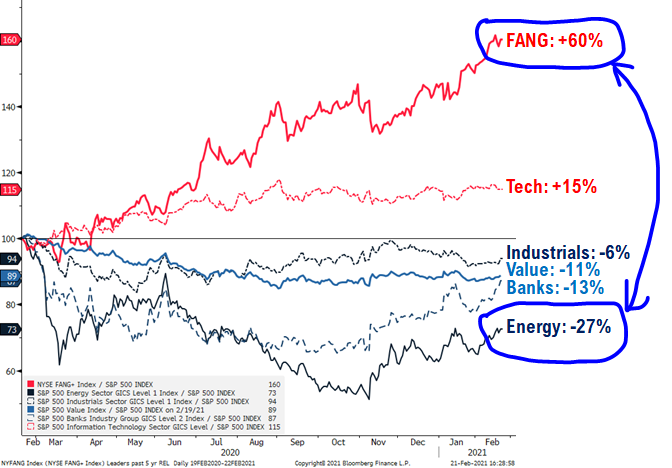
For now, we still see the stronger risk/reward in Epicenter stocks (aka Cyclicals aka Energy, Industrials, Discretionary, Materials, Financials). Below the relative performance in the past 12 months.
– FANG and Technology outperformed by +6,000bp/ +1,500bp respectively
– Look at the awful relative returns of Industrials, Value, Banks and Energy
– If economy is re-opening, many of these Epicenter groups will rally
But the case for Epicenter is not simply just “mean reversion” — it is also both a fundamental and a valuation re-rate argument:
– Epicenter stocks dramatically rationalized costs in the past year –> higher operating leverage
– Pent-up demand exists –> revenue beats
– Cost of debt is lower –> equity risk premia falls –> higher P/E
– Epicenter cos have become “unkillable” –> P/E goes up as risk premia falls
So you see, there are multiple factors suggesting this Epicenter catch-up trade has long legs.
Source: Fundstrat
STRATEGY: Epicenter Trifecta List 121 stocks
The case for being Cyclically-tilted is strengthening:
– Vaccine rollout set to accelerate
– US cases collapsing
– US economy set to re-open
– US corporates reset cost structures = strong operating leverage
– US credit markets strong = cost of capital falling
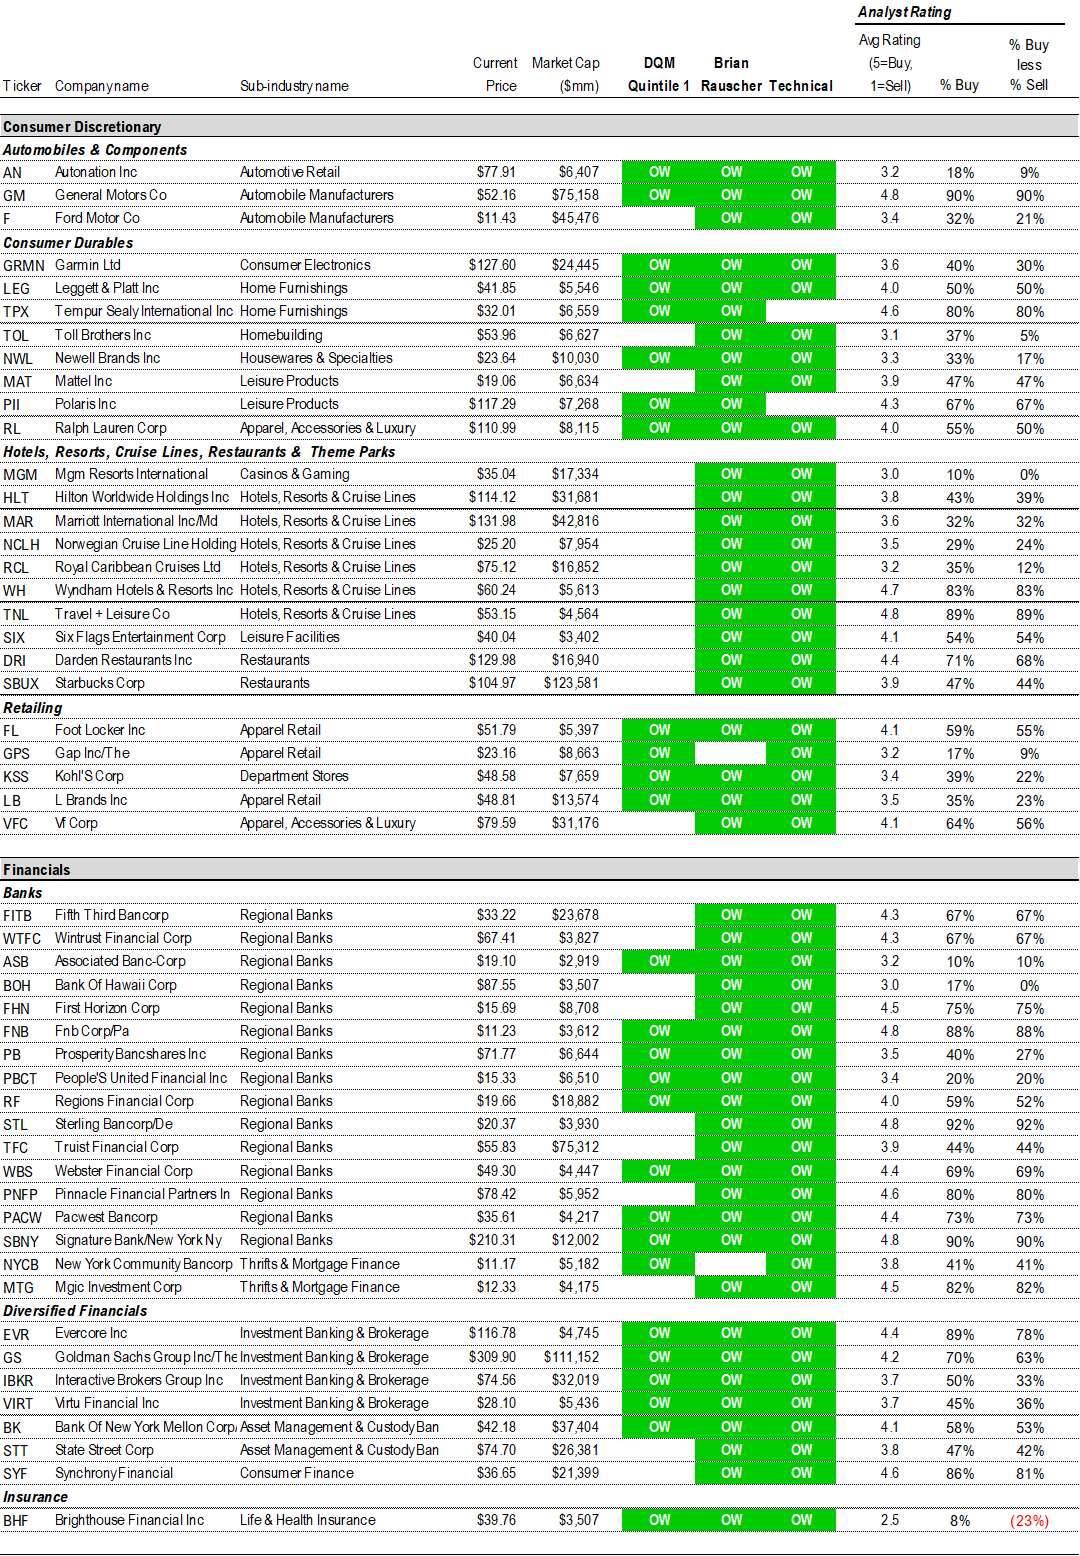
Below is our updated “Trifecta” epicenter stock list. These are the stocks which were hit the hardest by the pandemic and have the greatest operating leverage to a re-opening. And we like the earnings upside in these stocks, because of the massive cost reset. The stocks are based on positive views coming from the trifecta of: (i) Quant (tireless Ken), (ii) Global Portfolio Strategy (Brian Rauscher, aka Rocky) and (iii) Technicals.
Consumer Discretionary:
AN, GM, F, GRMN, LEG, TPX, TOL, NWL, MAT, PII, RL, MGM, HLT, MAR, NCLH, RCL, WH, TNL, SIX, DRI, SBUX, FL, GPS, KSS, LB, VFC
Financials:
FITB, WTFC, ASB, BOH, FHN, FNB, PB, PBCT, RF, STL, TFC, WBS, PNFP, PACW, SBNY, NYCB, MTG, EVR, GS, IBKR, VIRT, BK, STT, SYF, BHF
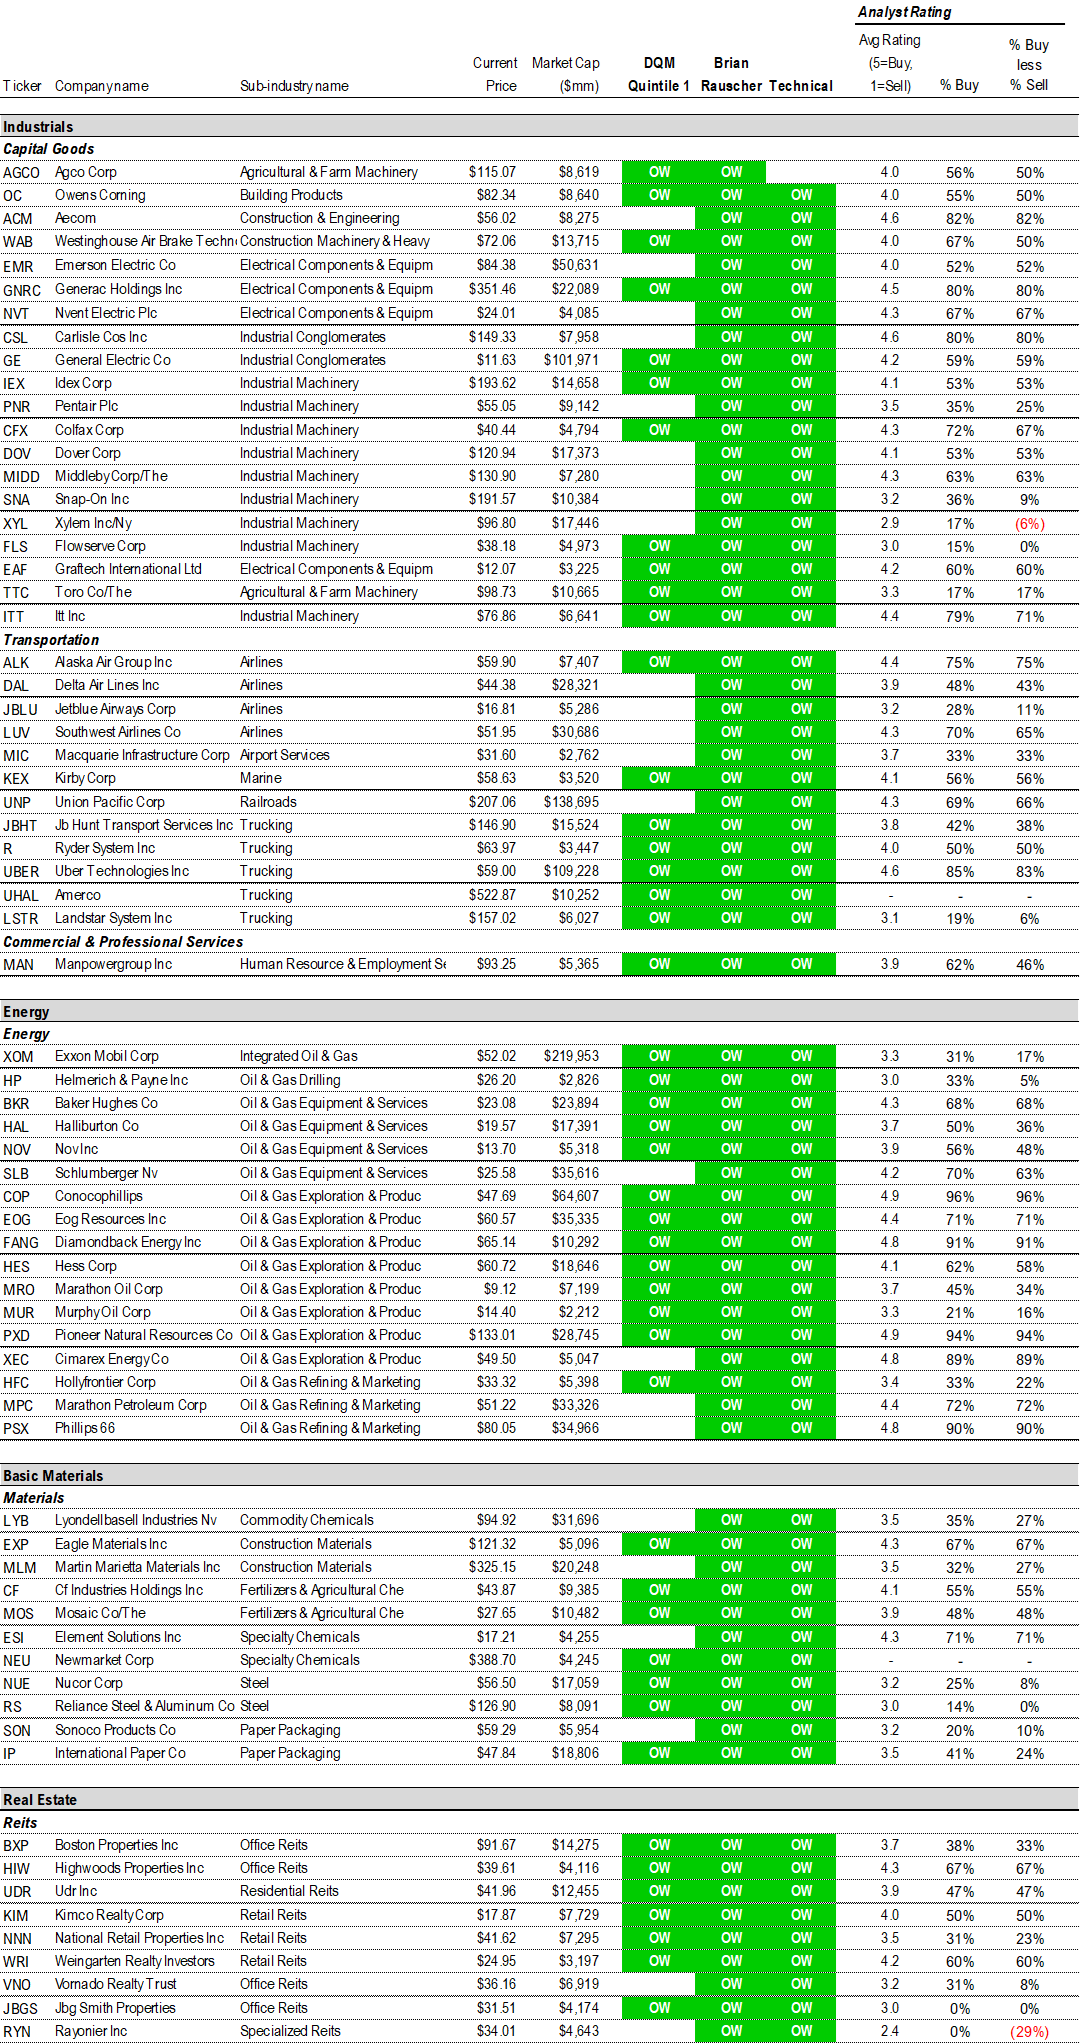
Industrials:
AGCO, OC, ACM, WAB, EMR, GNRC, NVT, CSL, GE, IEX, PNR, CFX, DOV, MIDD, SNA, XYL, FLS, EAF, TTC, ITT, ALK, DAL, JBLU, LUV, MIC, KEX, UNP, JBHT, R, UBER, UHAL, LSTR, MAN
Energy:
XOM, HP, BKR, HAL, NOV, SLB, COP, EOG, FANG, HES, MRO, MUR, PXD, XEC, HFC, MPC, PSX
Basic Materials:
LYB, EXP, MLM, CF, MOS, ESI, NEU, NUE, RS, SON, IP
Real Estate:
BXP, HIW, UDR, KIM, NNN, WRI, VNO, JBGS, RYN
Source: Fundstrat, Bloomberg
(*) Please note that the stocks rated OW on this list meet the requirements of our investment theme as of the publication date. We do not monitor this list day by day. A stock taken off this list means it no longer meets our investment criteria, but not necessarily that it is neutral rated or should be sold. Please consult your financial advisor to discuss your risk tolerance and other factors that characterize your unique investment profile.
ADDENDUM: We are attaching the stock lists for our 3 portfolios:
We get several requests to give the updated list for our stock portfolios. We are including the links here:
– Granny Shots –> core stocks, based on 6 thematic/tactical portfolios
– Trifecta epicenter –> based on the convergence of Quant (tireless Ken), Rauscher (Global strategy), Technicals
– Violence in USA –> companies that are involved in some aspect of home or personal security. We are not “recommending” these stocks, but rather, bringing these stocks to your attention.
Granny Shots:
Full stock list here –> Click here
Tickers: AAPL, CSCO, INTC, MXIM, NVDA, EBAY, KLAC, GRMN, GOOG, MNST, MSFT, AMZN, QCOM, TSLA, PYPL, AXP, BF/B, PM, XLNX, TGT, PG, XOM, VLO, GL, RF, ATVI, BBY, GE, AMAT, LRCX, MU, HPQ
Trifecta Epicenter (*):
Full stock list here –> Click here
Tickers: AN, GM, F, GRMN, LEG, TPX, TOL, NWL, MAT, PII, RL, MGM, HLT, MAR, NCLH, RCL, WH, TNL, SIX, DRI, SBUX, FL, GPS, KSS, LB, VFC, FITB, WTFC, ASB, BOH, FHN, FNB, PB, PBCT, RF, STL, TFC, WBS, PNFP, PACW, SBNY, NYCB, MTG, EVR, GS, IBKR, VIRT, BK, STT, SYF, BHF, AGCO, OC, ACM, WAB, EMR, GNRC, NVT, CSL, GE, IEX, PNR, CFX, DOV, MIDD, SNA, XYL, FLS, EAF, TTC, ITT, ALK, DAL, JBLU, LUV, MIC, KEX, UNP, JBHT, R, UBER, UHAL, LSTR, MAN, XOM, HP, BKR, HAL, NOV, SLB, COP, EOG, FANG, HES, MRO, MUR, PXD, XEC, HFC, MPC, PSX, LYB, EXP, MLM, CF, MOS, ESI, NEU, NUE, RS, SON, IP, BXP, HIW, UDR, KIM, NNN, WRI, VNO, JBGS, RYN
Violence in USA:
Full stock list here –> Click here
(*) Please note that the stocks rated OW on this list meet the requirements of our investment theme as of the publication date. We do not monitor this list day by day. A stock taken off this list means it no longer meets our investment criteria, but not necessarily that it is neutral rated or should be sold. Please consult your financial advisor to discuss your risk tolerance and other factors that characterize your unique investment profile.
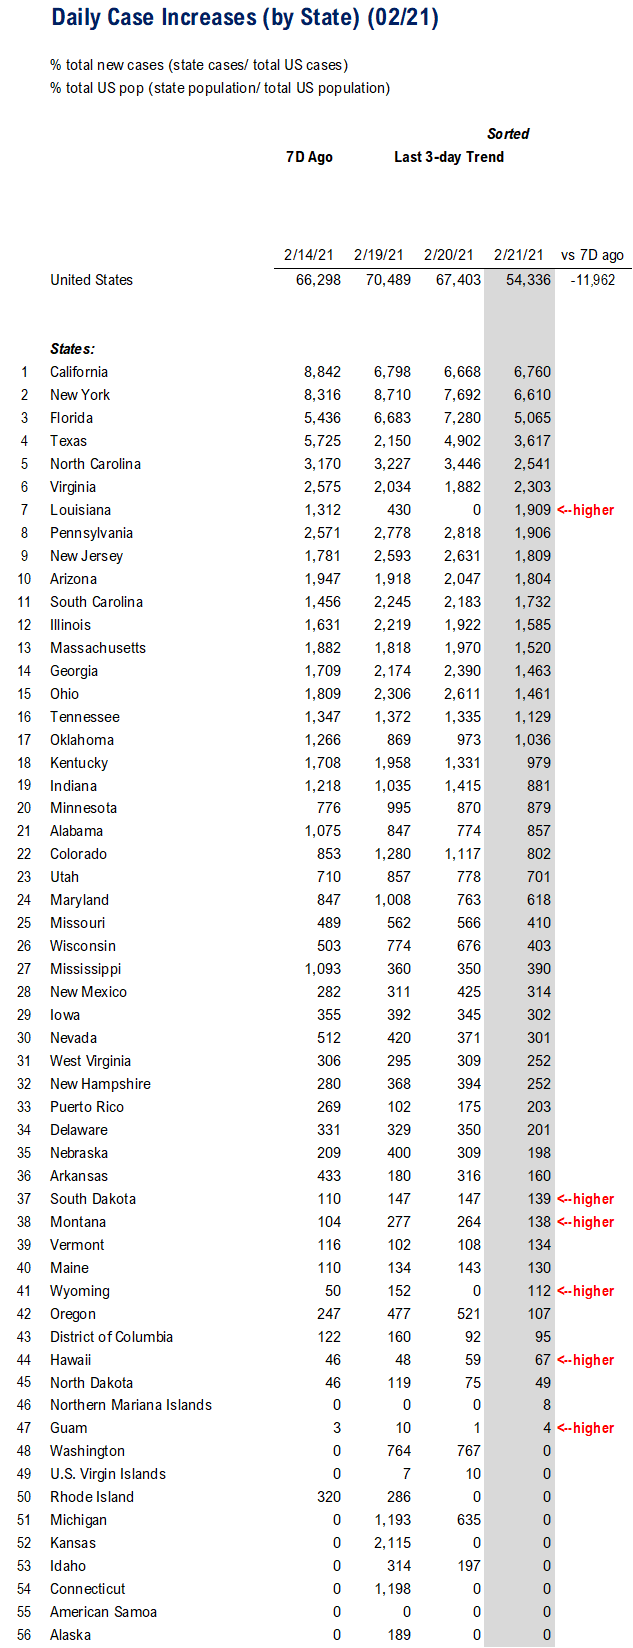
POINT 1: Daily COVID-19 cases 54,336, -11,962 vs 7D ago… tracking sub-50,000 this week
_____________________________
Current Trends — COVID-19 cases:
– Daily cases 54,336 vs 66,298 7D ago, down -11,962
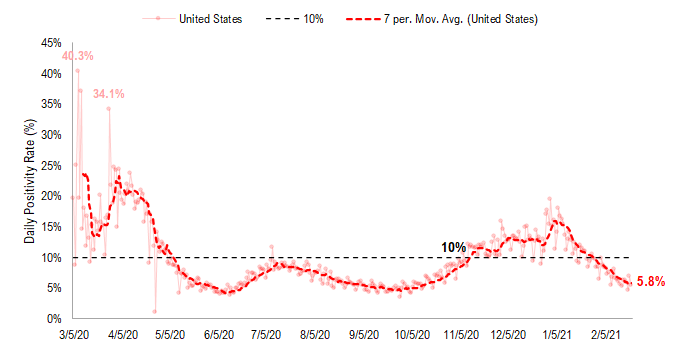
– 7D positivity rate 5.8% vs 6.4% 7D ago
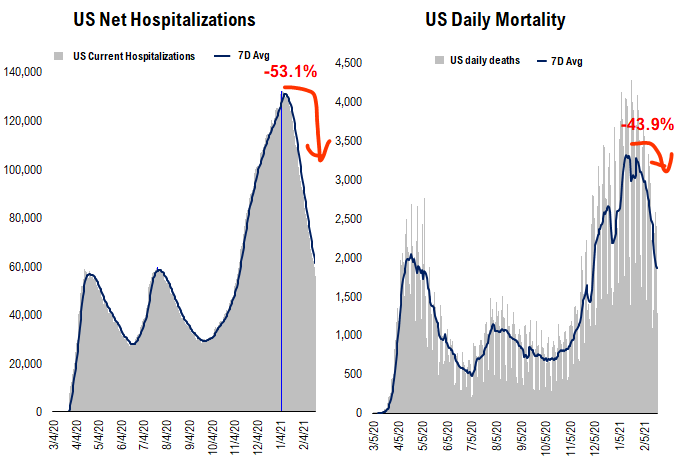
– Hospitalized patients 56,159, down -16% vs 7D ago
– Daily deaths 1,861, down -24% vs 7D ago
_____________________________
The latest COVID-19 daily cases came in at 54,336, down 11,962 vs 7D ago.
– US cases could fall 50,000 this week and set to fall further
– COVID-19 cases have declined (vs 7D ago) for 41 consecutive days
Source: COVID-19 Tracking Project and Fundstrat
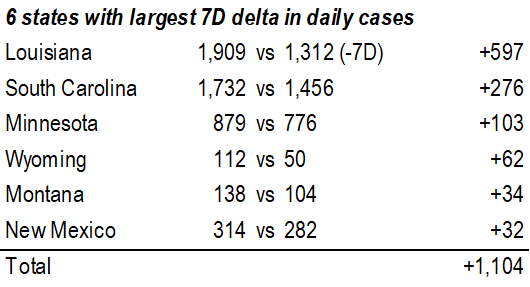
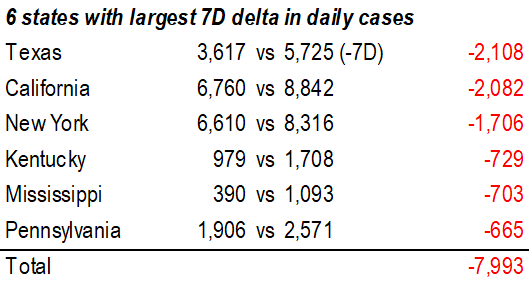
Daily cases are falling by ~25,000 vs 7D ago (7D delta, see below)… Wow
The 7D delta has turned negative for the past 41 days consecutively. This is impressive and the rate of change is accelerating to the downside.
– this is contributing to the sense that this receding of cases is a much faster retreat than seen in the past few months
Source: COVID-19 Tracking and Fundstrat
US hospitalization still rolling over … and even US deaths seem to be rolling over…
Below we show the aggregate patients who are currently hospitalized due to COVID. It certainly seems to be rolling over = good sign.
Source: COVID Tracking Project and Fundstrat
Source: COVID Tracking Project and Fundstrat
Source: COVID-19 Tracking and Fundstrat
Source: COVID-19 Tracking and Fundstrat
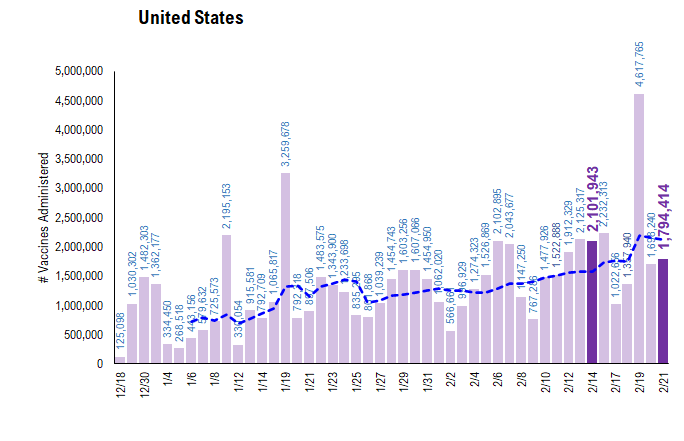
POINT 2: VACCINE: Pace vaccinations not improved … 1.8mm vs 2.1mm (7D avgs)
_____________________________
Current Trends — Vaccinations:
Vaccinations ramping steadily
– avg 1.8 million this past week vs 1.6 million last week
– overall, 5.7% have 2-doses, 13.1% 1-dose
_____________________________
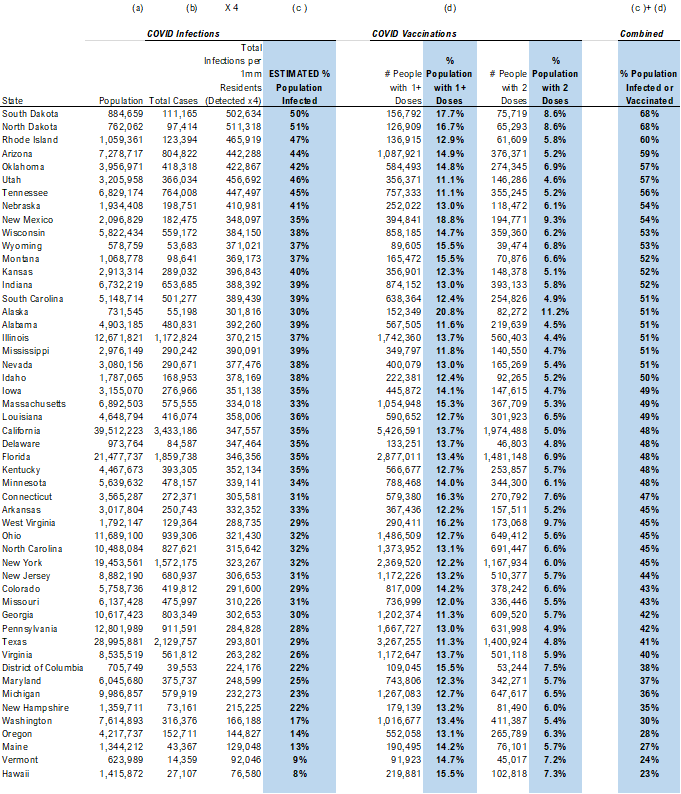
Vaccination frontier update –> only ND + SD + RI > 60% combined penetration (vaccines + infections)
Below we sorted the states by the combined penetration (vaccinations + infections). As we commented in the past, the key figure is the combined value >60%, which is presumably near herd immunity. That is, the combined value of infections + vaccinations as % population > 60%.
– Currently, only ND + SD + RI are at this level
– nearly half of the states are approaching this, such as UT, AZ, TN, OK at >55%
– So slowly, the US is getting to that threshold of presumable herd immunity
Source: CDC, COVID Tracking Project and Fundstrat
While 1,794,414 doses were administered today, down from 2,101,943 a week ago, the pace overall is steadily rising, as evidenced by the 7D moving average (see blue line).
Source: CDC, COVID-19 Tracking Project and Fundstrat
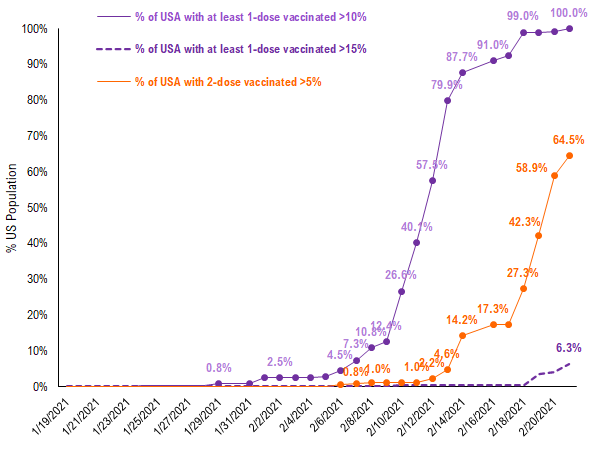
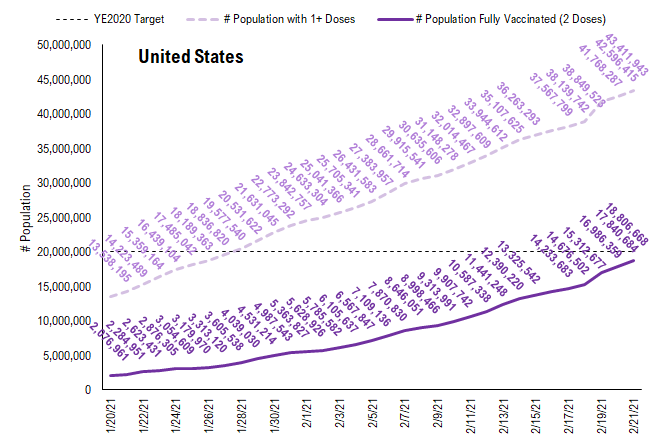
~6% of the US has seen 1-dose penetration >15%… still not wide geography
To better illustrate the actual footprint of the US vaccination effort, we have a time series showing the percent of the US with 2-doses covering at least 5% of its residents, displayed as the orange line on the chart. This figure is 64.5% (orange line). That means, while 5.7% of the US overall has received 2 doses, 64.5% of US states has US citizens with >5%.
– While all US states have seen vaccine penetration >10%, only 6.3% of them have seen 1 dose penetration >15%. Not a lot of geography.
– Now 65% of the US has at least 5% of its residents with the full 2 doses
– This is still a small figure (5% of residents with 2 doses) but this figure is rising sharply now
– the takeaway is the vaccination efforts are unlikely to be having much of an effect on case figures, currently
Source: CDC, COVID-19 Tracking Project and Fundstrat
This is the state by state data below, showing information for states with one dose and for those with two doses.
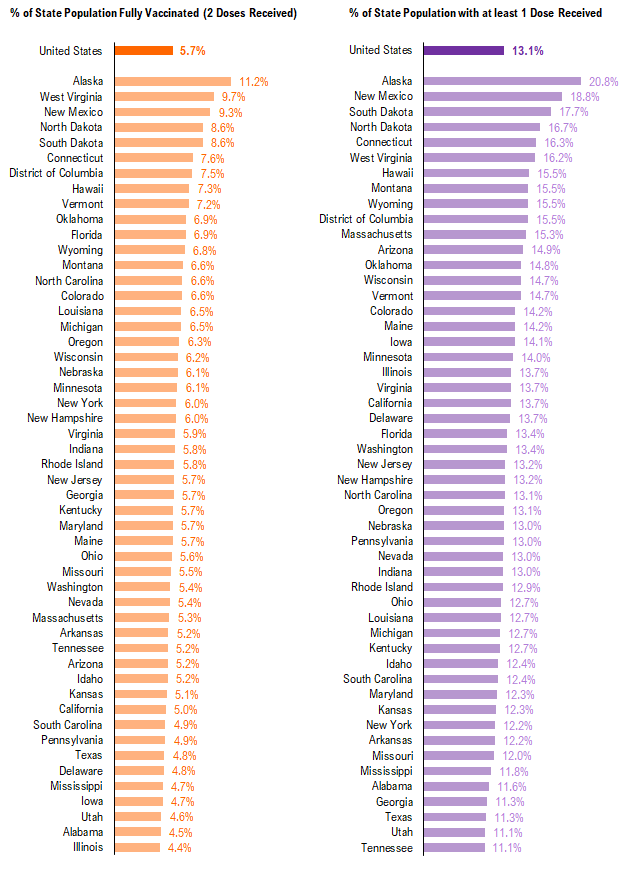
Source: CDC, COVID-19 Tracking Project and Fundstrat
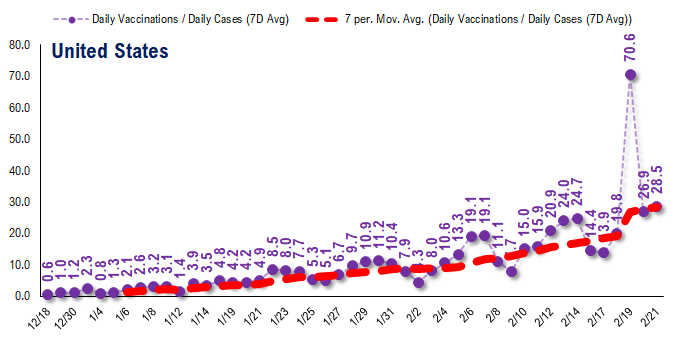
The ratio of vaccinations/ daily confirmed cases is generally trending higher (red line is 7D moving avg) and this is the most encouraging statistic.
– the 7D moving average is about ~25 for the past few days
– this means 25 vaccines dosed for every 1 confirmed case
This figure is rising nicely and likely surges in the coming weeks
Source: CDC, COVID-19 Tracking Project and Fundstrat
In total, about 43 million Americans have received at least 1 dose of a vaccine. This is a good pace and as we noted previously, implies 30% of the population by April.
Source: CDC and Fundstrat
POINT 3: Israel cases rolled over when vaccination ~25% of Pops. Vaccine passports
As reported by the UK’s Daily Mail, Israel has re-opened its economy, in the sense that shops, theaters, gyms and hotels have re-opened. The citizens frequenting these places need to carry a form of “vaccine passport” aka green pass. It looks like it is some sort of app on a smartphone and must be presented at certain venues.
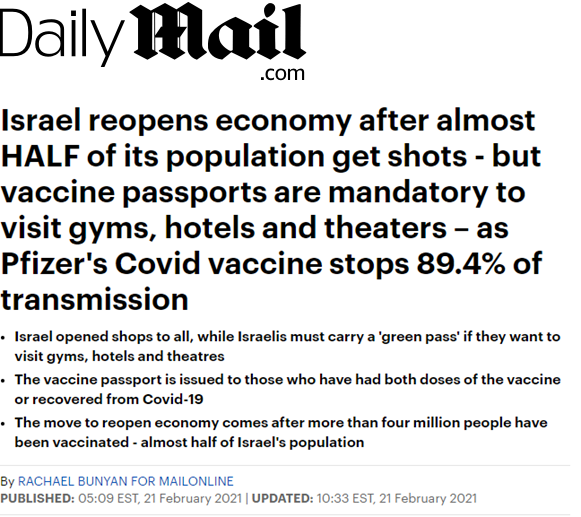
Source: https://www.dailymail.co.uk/news/article-9283395/Israel-reopens-economy-HALF-population-jabs-second-Pfizer-dose-cuts-Covid-risk.html
Israel cases started to rollover after 25% of residents vaccinated…
Israel daily cases started to rollover on 1/18/2021, based upon the 7-day moving average (see lower half of chart). The percentage of the population vaccinated was 26.5% when daily cases started to fall. Israel is using the Pfizer vaccine exclusively.
– in round numbers, it looks like this figure is approximately 25%
– thus, we should be watching this figure in the US closely.
– what percentage of the US has 25% of its residents with 1-dose.

Source: Fundstrat and Worldindata.org
As you can see, none of the US states is near the 25% level yet. But even so, many US states are seeing a collapse in cases.
Source: Fundstrat and Worldindata.org

