

COVID-19 UPDATE: Groundhog day... another day, another +5% for mega-caps

Click HERE to access the FSInsight COVID-19 Daily Chartbook.
FYI, we will be following a shortened publication schedule this week:
– Wednesday morning (today)
– Thursday morning (9/3)
– Friday morning (9/4) NO REPORT
Weekend
– Monday morning (9/6) NO REPORT
– Tuesday morning (9/7)
STRATEGY: Another day, another big move in mega-caps
On the first day of the month equities were up ~1%, but the move was entirely led by the mega-caps.

Source: Groundhog Day
This feels like a scene straight from “Groundhog Day” and we are waking up to another day of Apple rising 4% (see below).
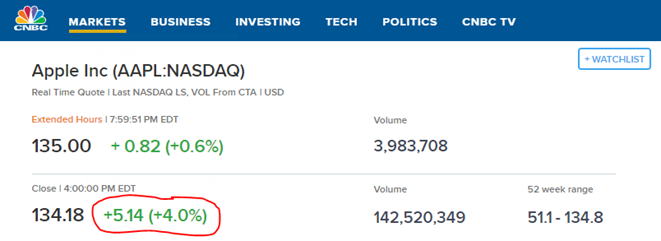
Source: CNBC
The reason this surprises me is that we have been getting good COVID-19 case data and pretty decent economic data. Today’s ISM manufacturing came in at 56.0 which is well above the 54.2 last month and 54.8 Street consensus. So the economic recovery is still seeing momentum, even in August. And daily cases are flat vs 7D ago, which is not bad.
The only negative development that bears watching is the divergence with VIX rising and stocks rising. This is pretty unusual, as falling VIX = rising stocks. So this bears watching.
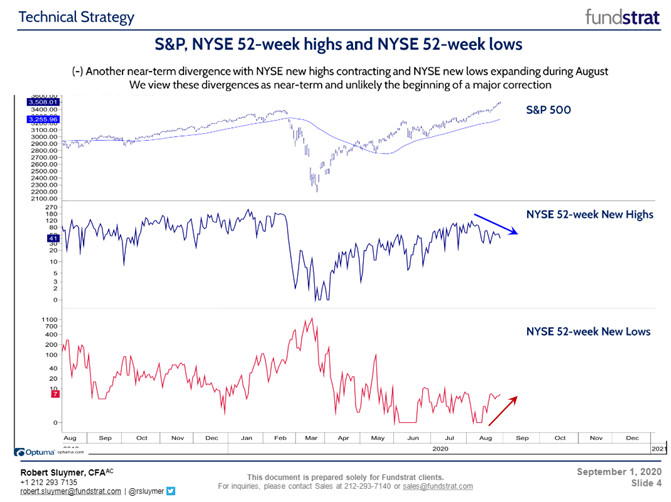
And something Rob Sluymer, our head of Technical Strategy, has flagged is the fact that the S&P 500 is making new highs but the number of 52 week highs is actually falling. Hmmm…. keep an eye on this.
In the meantime, we still see the best risk/reward with the epicenter stocks and believe these stocks are the biggest beneficiaries of:
– vaccine
– cure/ treatment
– case data improving
– Congress passing stimulus
– economy improving
But the outperformance of mega-caps suggests the market is not believing this is the path forward.
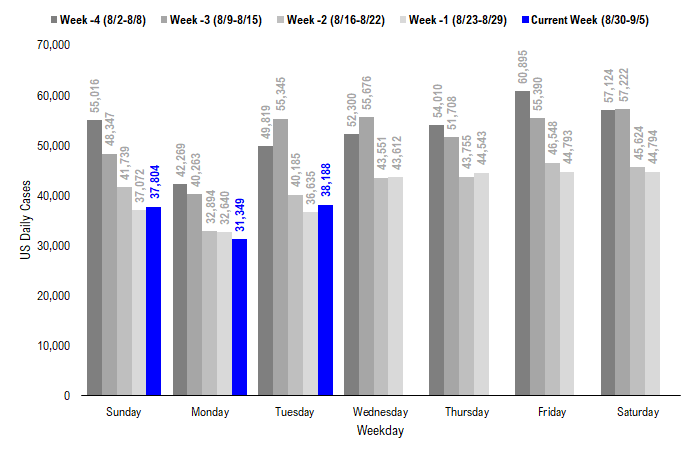
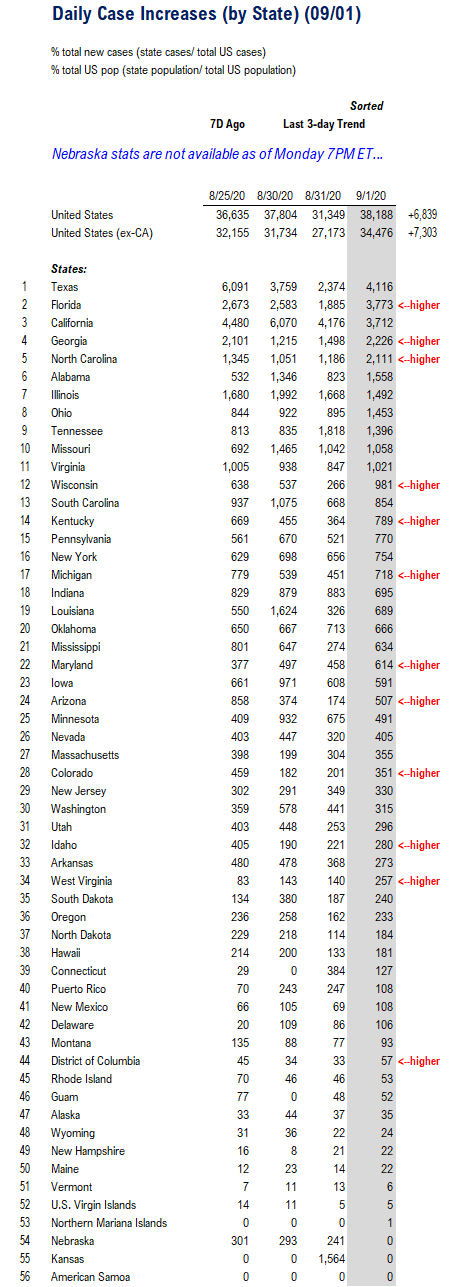
POINT 1: Daily cases fall to 38,188, up ~1,500 vs 7D ago as improvements stall…
The rapid improvement in daily cases we were seeing a few weeks ago has turned into a stall. This is not because of any new outbreaks in key states:
– no new outbreak in NY tristate nor Northeast
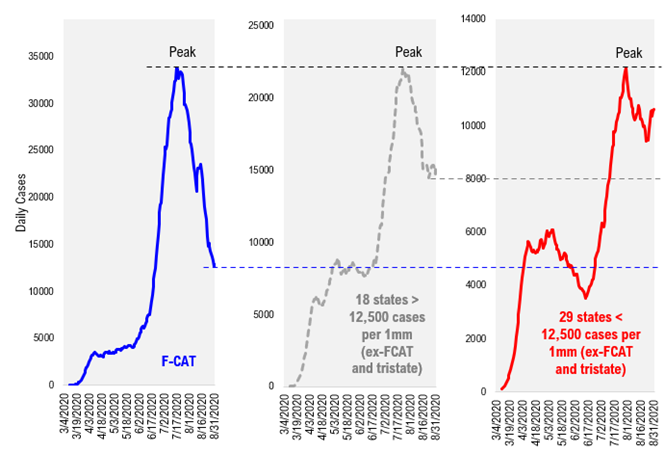
– no new outbreak in 4 epicenter states, FL, CA, AZ, TX, or F-CAT
– but continuing rise in cases from states with low case prevalence
Source: COVID-19 Tracking Project
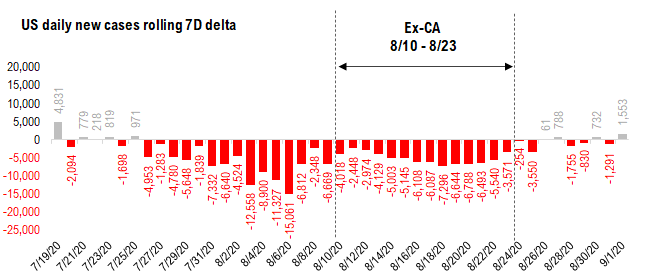
Again, the daily change vs 7D ago, in our view, is the leading indicator as it is what influences the 7D moving average. After seeing daily cases essentially flat for the last few days, today saw daily cases rise +1,553 and this is after adjusting for a backlog of cases from FL.
Source: COVID-19 Tracking and Fundstrat
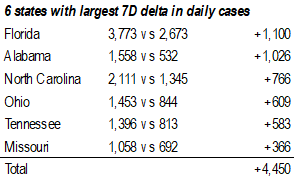
The two states with the largest jumps are FL and AL. And NC is not far behind. These are states with large universities and this is where cases are rising.
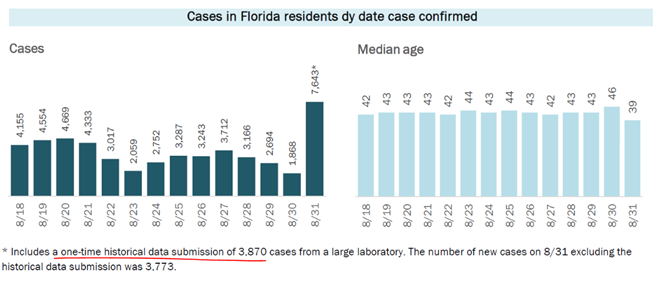
The “reported” figure for FL today was +7,643 but as the footnote highlights, 3,870 are cases from a laboratory reporting a backlog. This is what makes tracking daily cases tricky — fortunately, our data science team, led by tireless Ken, caught this.
Source: COVID-19 Tracking and Fundstrat
POINT 2: F-CAT accounts for 3 of 4 largest daily cases… so it is still the key
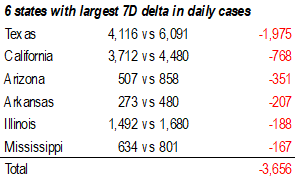
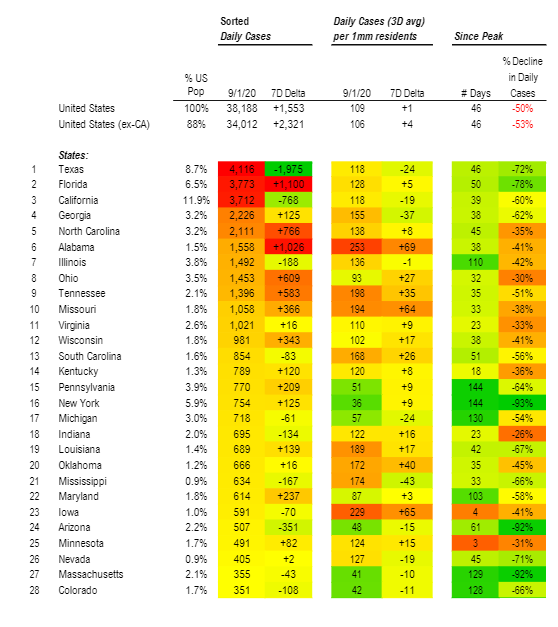
We have listed the daily cases reported by states, sorted from highest to lowest. And as you can see below, the top 3 of 4 states are F-CAT. Arizona has seen cases fall off a cliff — but that state was also hit the hardest.
– but the fact that TX, FL, CA are top 3 shows how much these states are key to an overall decline in cases.
– in total, these 3 states are 11,000 cases per day, or 33% of the total.
– and fortunately, these are 60% to 78% off their highs (see right column).
Source: COVID-19 Tracking Project
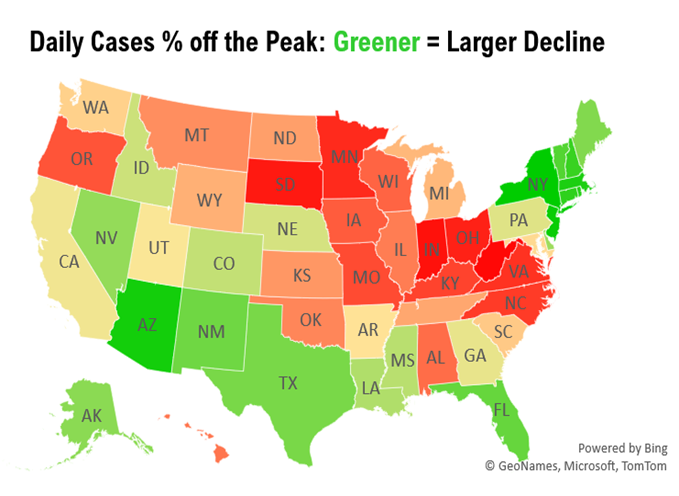
We have a map below to show to what extent daily cases are off their peak. The greener the color, the greater the state is off their highs. And as you can see, there is a swathe of country in the Midwest to Virginia that is closer to their highs. This is the area where cases remain stubborn.
Source: COVID-19 Tracking Project
But these are also states with low case prevalence. As this chart below highlights, the states with the lowest case prevalence are the ones seeing the unfortunate surge in cases. In other words, it is almost as if these are the areas where there remains a significant vulnerable population.
Source: COVID-19 Tracking Project
POINT 3: Deaths are fortunately slowing as 7D moving average moving down steadily…
Daily deaths remain around 1,000 per day.
This is a horrifically high number, particularly if COVID-19 is the sole source of death. As the media has reported, co-morbidities are suggesting COVID-19 is hastening the deaths of many, but may not be the sole cause.
– but the key metric from mortality is to see reported deaths fall.
– fortunately, it did not surge like cases surged in June/July, but neither has it fallen.
– it is 63% off the April levels but has not really fallen sharply.
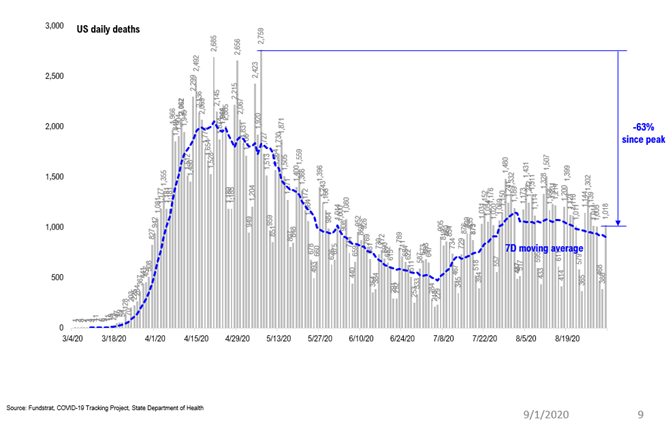
The leading indicator of the moving average is the 7D delta and we publish this every day in our chartbook (the PDF attached). As you can see, the 7D delta is red (negative) so it is falling. But it is not accelerating. So deaths are trending lower but at a modest pace.
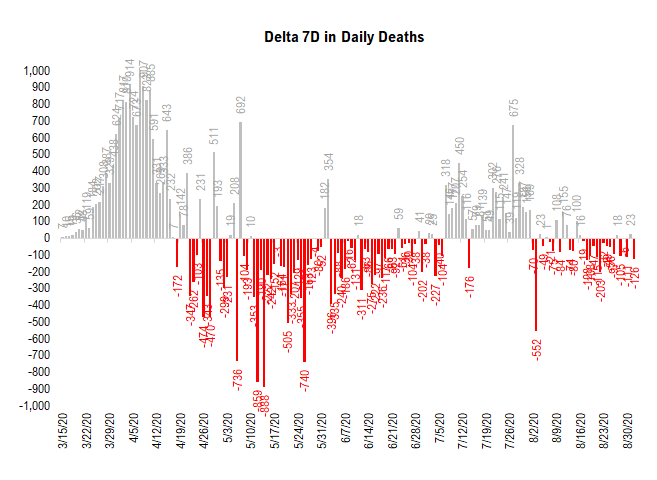
Source: COVID-19 Tracking Project

