
Granny Shots
Stock List

Granny Shots
Stock List

GRANNY SHOTS: September Super Granny update.

SLIDE DECK NOW AVAILABLE: To view the slide deck for this month’s Super Granny Update, please CLICK HERE.
We will not be having an associated webinar for the September Super Granny Update this month.
- Updating 5 Super and 5 Sleeper Grannies
- Chartbook linked above
“Super Grannies” (long) and “Sleeper Grannies” are derived from our core stock list of 35 ideas called “Granny Shots”
- The rationale is many clients ask us to narrow this list of 35 names down to a list of “fresh money” ideas.
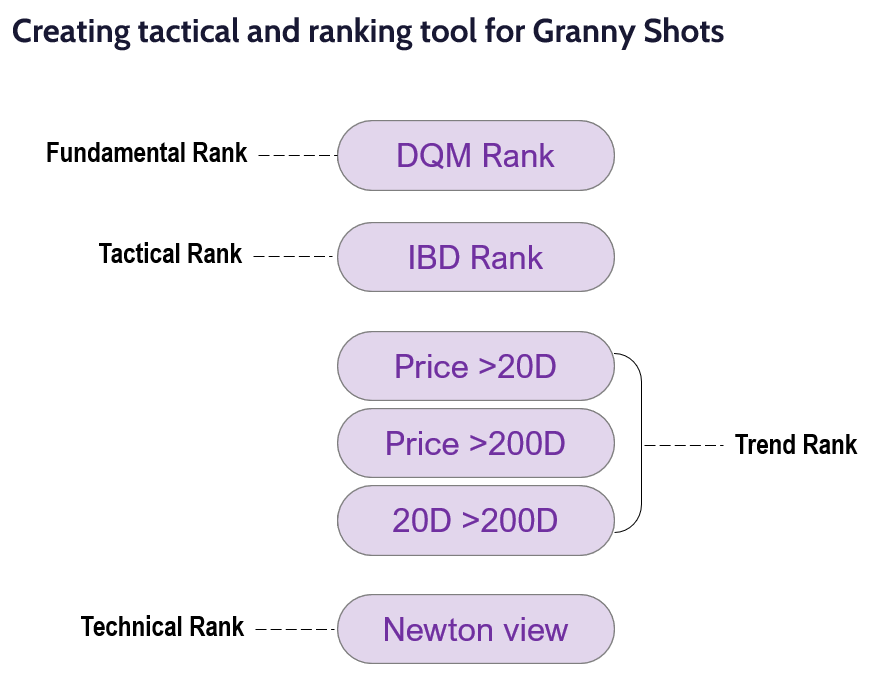
- We established a criteria of 4 factors to narrow the list to tactical buys:
– fundamentals using DQM model managed by “tireless Ken”
– IBD momentum rating
– technical strength measured by Price >20 DMA, 20 DMA vs 200 DMA and combos
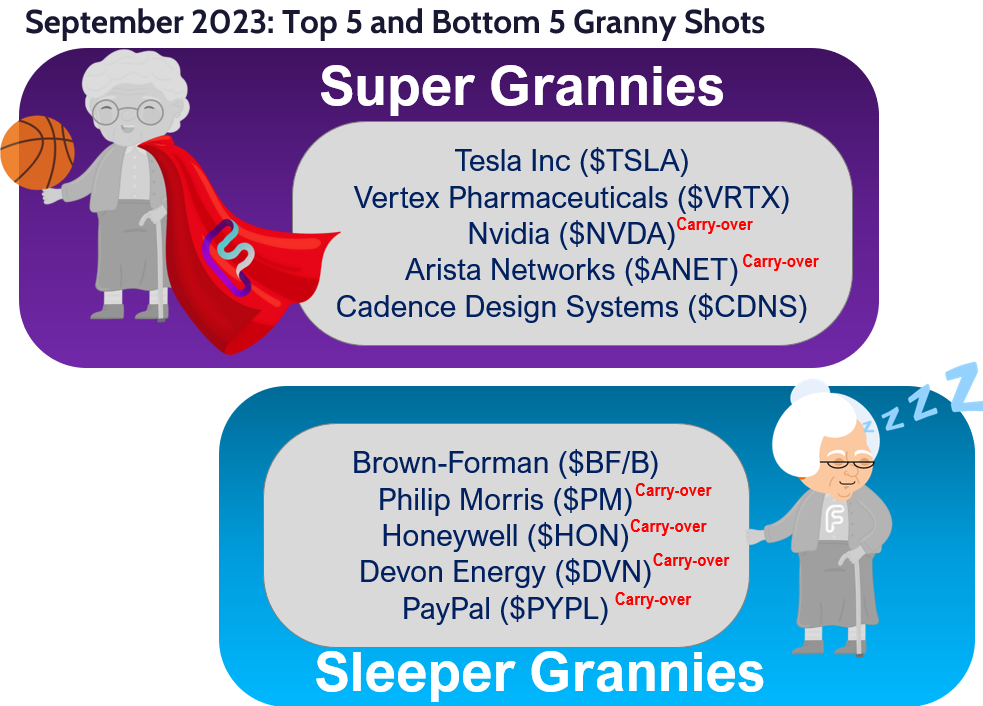
– Mark Newton’s judgement on technical outlook - We have 5 tactical buys aka “Super Grannies”
– Tesla (TSLA -1.10% )
– Vertex Pharmaceuticals (VRTX -0.06% )
– Nvidia (NVDA 6.25% ) <– Carry-over
– Arista Networks (ANET -0.02% ) <– Carry-over
– Cadence Design Systems (CDNS 1.92% ) - The bottom 5 “Sleeper Grannies” are:
– Brown-Forman (BF/B)
– Philip Morris (PM -1.11% ) <– Carry-over
– Honeywell (HON 0.22% ) <– Carry-over
– Devon Energy (DVN 0.19% ) <– Carry-over
– PayPal (PYPL 3.00% ) <– Carry-over
TECHNICALS ON 5 SUPER GRANNY SHOTS: By Mark Newton
Tesla (TSLA -1.10% ) – Despite some near-term choppiness off recent July highs, TSLA has shown little to no real evidence of meaningful deterioration that would suggest the stock has begun to peak out. As of 9/21/23 close, price is merely 9% off the weekly high close peak from mid-July and still up over 100% from lows that were made last October. The extent of the strength over the last 11 months has caused monthly momentum to turn back positive which should allow pullbacks to prove minor into October before this begins to turn up again to exceed $300 on its way to initial targets near $350. (Intermediate-term, TSLA is likely to test and exceed its 2021 highs which lie near $415) The current rally has unfolded in a three-wave pattern thus far, as August weakness successfully held the prior peak from February. Thus, structurally its pattern allows for easy-to-identify areas of importance, and this lies at August 2023 lows at $212.36. Unless this level is breached, any pullback into October should translate into an excellent risk/reward chance to buy dips. August lows also adjoin a larger uptrend off the January 2023 bottom which have successfully formed two consecutive higher lows over the last nine months. Ideally, pullbacks should hold a support zone at $237-$245 before turning back higher. On an intermediate-term basis, exceeding $279 will result in TSLA breaking out above a meaningful downtrend from 2021 peaks which has had three separate retests. However, on a fourth retest, it’s likely that this trend should give way to an intermediate-term rally into next Spring, 2024. Thus, TSLA appears like an attractive risk reward given its strength this year, and its ability to have carved out a new uptrend of higher highs and higher lows from earlier this year makes this attractive.
Vertex Pharmaceuticals (VRTX -0.06% ) – Bullish and rallies are likely to targets near $380 and then $407 before this hits any meaningful resistance. Weekly trend remains quite bullish in VRTX following its doubling off the lows from last Fall. The area of $360 proved to be important given a rise from near $180, but despite the underperformance in Healthcare this year, VRTX has proven to be extraordinarily strong, and still trades within striking distance of all-time highs. While price has stalled a bit following this most recent rally since the Spring, there’s been no evidence of weakness in its ongoing trend which would suggest it’s right to avoid this stock. Momentum has waned a bit in the last few months, but given a lack of detetiration in this ongoing uptrend, this makes VRTX more attractive in my view given that overbought conditions have been alleviated with little or no weakness. On a longer-term basis, getting over $407 would allow for a rally up to $504 and then $559, the latter representing a 1.618x projection of the initial rally off 2016 lows. Overall, VRTX remains attractcive and pullbacks would likely not undercut Support at 340 before continuing higher.
Nvidia (NVDA 6.25% ) —Short-term bearish decline is nearing support. The three-week 15% decline in NVDA has merely served to consolidate the former runup into late August and has not served to disrupt the ongoing bullish intermediate-term trend which has been intact since this past March. Heading into end of Q3, NVDA is hovering just above what’s thought to be important support near $403 which also lies near the intermediate-term uptrend. Despite declining during the month of September, intermediate-term technical structure remains positive. Thus, this pullback still represents a short-term selloff within an ongoing uptrend. NVDA remains one of the best technical candidates within the Semiconductor sector, so despite momentum having rolled over to negative on weekly charts, until/unless this begins to show much greater technical deterioration, NVDA will continue to be technically attractive. Risk levels lie at $403, and should not be broken without postponing the rally and allowing for additional consolidation down to near $380. At present, a move back to new highs is certainly quite possible for the months ahead.
Arista Networks (ANET -0.02% ) – Arista Networks continues to look quite positive technically following its high-volume breakout above the consolidation which had been ongoing since March. While its rally up to near $200 has petered out in the near-term and retraced lower over the past three weeks, ANET still shows a parabolic trend which has improved steadily in recent months with a trend of higher lows. Momentum remains positively sloped on a weekly basis but is still not overbought given the extent of the minor consolidation in recent weeks. ANET should likely bottom out into end of quarter near $168, or below near 160 which would make this a very appealing risk/reward within the technology sector. Only on pullbacks under $148 would ANET violate support and postpone its rally, which is not expected in the weeks ahead.
Cadence Design Systems (CDNS 1.92% ) – Cadence Design Systems is bullish and the recent three-week pullback attempt hasn’t done much damage which would suggest this is peaking out. The stock’s churning since May remains part of its ongoing uptrend since last Fall and remains within striking distance of all-time highs. Following its runup to close out the month of August at $240.44, ANET’s minor weakness has served to erase just 5% off last month’s all-time high close. Thus, after nearly doubling off last year’s lows, this minor consolidation isn’t too harming to the ongoing uptrend in CDNS. Moreover, its churning has successfully helped momentum to exit overbought levels, which should make this more attractive to consider after just minor consolidation. Overall, CDNS maintains a bullish intermediate-term uptrend and its weakness has proven minor and insufficient to think this is turning lower. Overall, strong support lies near $217, and CDNS’ short-term pullback should be complete by early October, allowing for a rally back to challenge and exceed all-time highs at $248.16. Technical targets lie at $260, then $280 into next year.
TECHNICALS ON 5 SLEEPER GRANNY SHOTS: By Mark Newton
Brown-Forman (BF/B) – Brown Foreman’s neutral consolidation over the last three years remains ongoing, and is part of a larger intermediate-term uptrend that has persisted over the last decade. The stock has successfully held $60 on two other occasions this year on weakness, and this level lines up near its intermediate-term uptrend line going back since 2009. Two separate rally attempts since Spring 2022 have been completely given back, which both occurred during the May-August timeframe. Rallies have resulted in lower highs as part of an intermediate-term mildly sloping downtrend from September 2020. Its weakness into September this year is nearing a very important battleground area for BF/B at $58-$60 that will be important to concentrate on in the weeks to come. Consecutive weekly closes under $58 would cause the neutral range from 2020 to morph into a downtrend which could allow for a larger pullback to test March 2020 lows just under $45. At present, this $58-$60 zone is thought to represent initial support to the September pullback, but has to be watched carefully for any evidence of failure into October. At present, BF/B will remain a “Sleeper” until this can manage to close back up above $71.50 which would represent the first positive change in its weekly chart.
Philip Morris (PM -1.11% ) – Philip Morris International has trended in a lengthy consolidation pattern since February 2022 with an ongoing triangle pattern of lower highs and higher lows. PM’s 10% rally in the six-week period into mid-July 2023 held right at key Triangle resistance before rolling back over. Overall, until/unless PM can surpass $102, it’s right to consider to think of PM as a Sleeper Granny as this remains within ongoing triangle consolidation. While the range since 2022 has constricted over the last year, showing lower highs and higher lows, it’s a necessity to break out of either side of this consolidation before thinking this trend is more bullish or bearish. A violation of $89 would be negative, while getting over 102 is needed to improve this pattern. Movement to resolve this triangle likely would lead to a continuation of the breakout, and would be respected, in either direction.
Honeywell (HON 0.22% ) – HON remains a laggard within the Industrials space, and similar to PM, lies in a triangle pattern of consolidation which began back in 2021. While the rally from late last year proved to be quite strong in 4Q, this failed to get above $221, far below the Aug 2021 peak before making a deep retracement. Subsequent rally attempts this year during a bullish phase for Industrials also failed to break last year’s highs before selling off sharply over the last two months. However, there has been some success in holding Spring lows on this latest decline, and creates an important area of support for any future pullback into October. The broader pattern remains more intermediate-term neutral than bullish or bearish, but requires a weekly close back over $211 to jumpstart any larger rally. In the weeks ahead, it will be key to hold $183.23, which represents September lows, as breaks of this level would argue for a lengthier decline which could target $166.63. Until this can demonstrate evidence of stabilizing and turning back higher to exceed $211, this is thought to represent a “Sleeper Granny” and has an above-average chance of continuing this range-bound pattern.
Devon Energy (DVN 0.19% ) – Devon Energy remains very much a sleeper stock and despite Energy’s strength in recent months since bottoming in June, DVN has failed to show much participation. Minor evidence of WTI Crude stalling in the low $90’s which sent many Energy stocks lower resulted in a sharp decline in DVN to within striking distance of March 2023 lows. Movement back over mid-June peaks ($51.41) would signify the first technical sign of a possible bottom in place, as this would put DVN at the highest levels since early May, allowing for upside follow-through up to $56, then $61.40. Technically speaking a retest of March lows just above $44 looks imminent, and this lines up very close to a 50% retracement of its rally off the 2020 lows into peaks made last May. However, given that Energy looks likely to consolidate gains in the next 3-6 months before a larger rally can get away, it’s likely technically speaking that DVN weakens down under $44 which might bring about a move into the mid-$30’s to challenge its 61.8% retracement level of the 2020-2022 rally. Bottom line, DVN remains very much a sleeper Granny and looks to be one of the weaker technical stock patterns within Energy.
PayPal (PYPL 3.00% ) – PYPL continues to struggle in its rally attempts to bottom out with multiple failures over the past 13 months. Technical trends have been bearish for more than two years, and rallies from January 2023 and also from May into July 2023 of this year both found strong resistance near existing downtrends before turning back lower. Following its peak in July at $76.54 resistance, gains into September also failed after just a minor retracement and have led PYPL back down to within striking distance of mid-August lows. Technically speaking, it’s likely that PYPL will make new 2023 lows into October, and it remains premature to attempt to buy dips. Until PYPL can begin to strengthen to recover $67, trends remain negative and this remains a Sleeper granny.
Key incoming data September
9/1 8:30am ET August Jobs ReportTame9/1 10am ET August ISM ManufacturingTame9/6 10am ET August ISM ServicesMixed9/6 2pm ET Fed releases Beige BookTame9/8 9am ET Manheim Used Vehicle Index August FinalTame9/8 2Q23 Fed Flow of Funds ReportTame-
9/13 8:30am ET August CPIMixed -
9/14 8:30am ET August PPITame -
9/15 8:30am ET September Empire Manufacturing SurveyTame -
9/15 10am ET U. Mich. September prelim 1-yr inflationTame -
9/18 8:30am ET September New York Fed Business Activity SurveyTame -
9/18 10am ET September NAHB Housing Market IndexTame 9/19 9am ET Manheim September Mid-Month Used Vehicle Value IndexMixed9/20 2pm ET September FOMC rates decisionNo Hike-
9/21 8:30am ET September Philly Fed Business Outlook SurveyWeak - 9/22 9:45am ET S&P Global PMI September Prelim
- 9/25 10:30am ET Dallas Fed September Manufacturing Activity Survey
- 9/26 9am ET July S&P CoreLogic CS home price
- 9/26 10am ET September Conference Board Consumer Confidence
Key incoming data August
8/1 10am ET July ISM ManufacturingTame8/1 10am ET JOLTS Job Openings JunTame8/2 8:15am ADP National Employment ReportHot8/3 10am ET July ISM ServicesTame8/4 8:30am ET July Jobs reportTame8/7 11am ET Manheim Used Vehicle Index July FinalTame8/10 8:30am ET July CPITame8/11 8:30am ET July PPITame8/11 10am ET U. Mich. July prelim 1-yr inflationTame8/11 Atlanta Fed Wage Tracker JulyTame8/15 8:30am ET Aug Empire Manufacturing SurveyMixed8/15 10am ET Aug NAHB Housing Market IndexTame8/16 8:30am ET Aug New York Fed Business Activity SurveyNeutral8/16 2pm ET FOMC MinutesMixed8/17 8:30am ET Aug Philly Fed Business Outlook SurveyPositive8/17 Manheim Aug Mid-Month Used Vehicle Value IndexTame8/23 9:45am ET S&P Global PMI Aug PrelimWeak8/25 10am ET Aug Final U Mich 1-yr inflationMixed8/28 10:30am ET Dallas Fed Aug Manufacturing Activity SurveyTame8/29 9am ET June S&P CoreLogic CS home priceTame8/29 10am ET Aug Conference Board Consumer ConfidenceTame8/29 10 am ET Jul JOLTSTame8/31 8:30am ET July PCETame
Key incoming data July
7/3 10am ET June ISM ManufacturingTame7/6 8:15am ADP National Employment ReportHot7/6 10am ET June ISM ServicesTame7/6 10 am ET May JOLTSTame7/7 8:30am ET June Jobs reportMixed7/10 11am ET Manheim Used Vehicle Index June FinalTame7/12 8:30am ET June CPITame7/13 8:30am ET June PPITame7/13 Atlanta Fed Wage Tracker JuneTame7/14 10am ET U. Mich. June prelim 1-yr inflationMixed7/17 8:30am July Empire Manufacturing Survey7/18 8:30am July New York Fed Business Activity Survey7/18 10am July NAHB Housing Market Indexin-line7/18 Manheim July Mid-Month Used Vehicle Value IndexTame7/25 9am ET May S&P CoreLogic CS home priceTame7/25 10am ET July Conference Board Consumer ConfidenceTame7/26 2pm ET July FOMC rates decisionTame7/28 8:30am ET June PCETame7/28 8:30am ET 2Q ECI Employment Cost IndexTame7/28 10am ET July Final U Mich 1-yr inflationTame
Key data from June
6/1 10am ET May ISM ManufacturingTame6/2 8:30am ET May Jobs reportTame6/5 10am ET May ISM ServicesTame6/7 Manheim Used Vehicle Value Index MayTame6/9 Atlanta Fed Wage Tracker AprilTame6/13 8:30am ET May CPITame6/14 8:30am ET May PPITame6/14 2pm ET April FOMC rates decisionTame6/16 10am ET U. Mich. May prelim 1-yr inflationTame6/27 9am ET April S&P CoreLogic CS home priceTame6/27 10am ET June Conference Board Consumer ConfidenceTame6/30 8:30am ET May PCETame6/30 10am ET June Final U Mich 1-yr inflationTame
Key data from May
5/1 10am ET April ISM Manufacturing (PMIs turn up)Positive inflection5/2 10am ET Mar JOLTSSofter than consensus5/3 10am ET April ISM ServicesTame5/3 2pm Fed May FOMC rates decisionDovish5/5 8:30am ET April Jobs reportTame5/5 Manheim Used Vehicle Value Index AprilTame5/8 2pm ET April 2023 Senior Loan Officer Opinion SurveyBetter than feared5/10 8:30am ET April CPITame5/11 8:30am ET April PPITame5/12 10am ET U. Mich. April prelim 1-yr inflationTame5/12 Atlanta Fed Wage Tracker AprilTame5/24 2pm ET May FOMC minutesDovish5/26 8:30am ET PCE AprilTame5/26 10am ET U. Mich. April final 1-yr inflationTame5/31 10am ET JOLTS April job openings
35 GRANNY SHOTS: Updated list is below
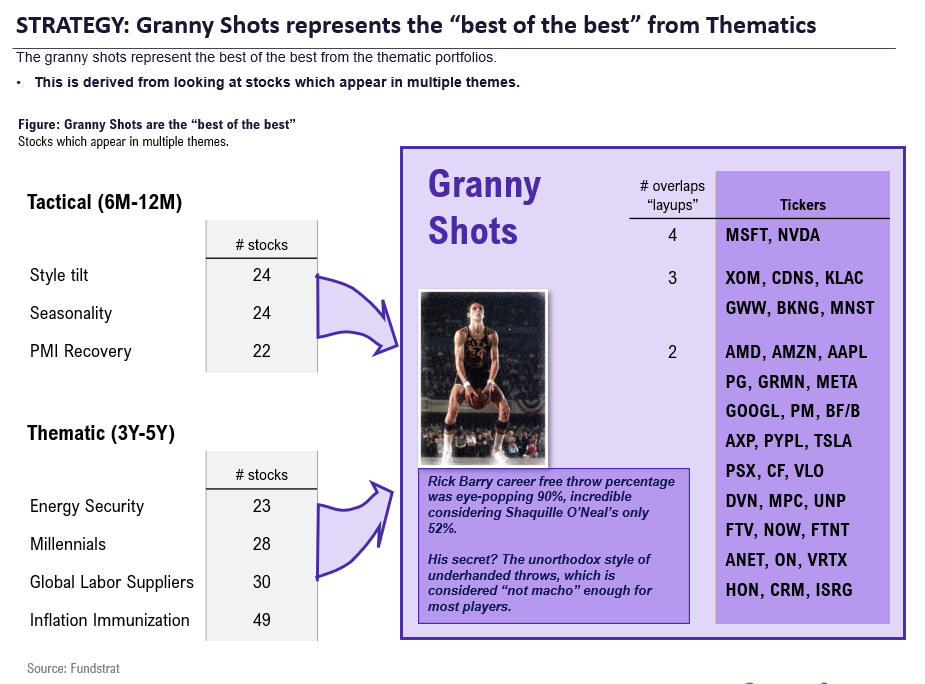
The revised 35 Granny shots are shown below. The list is sorted by the most attractive (most frequently cited) to least. To be a “Granny shot” the stock needs to appear in at least two portfolios.
- There are 2 stocks appearing in 4 of 7 themes: MSFT 1.80% NVDA 6.25%
- There are 6 stocks appearing in 3 of 7 themes: XOM CDNS 1.92% KLAC 4.95% GWW -1.96% BKNG 0.53% MNST 0.41%
Consider these the stocks that are the most commonly seen as “grannies” and thus, the higher quality ideas. To be a granny, a stock must be in at least 2 of 7 themes.
Communication Services:GOOGL 10.17% , META 0.27%
Consumer Discretionary:AMZN 3.36% , GRMN 0.29% , TSLA -1.10% , BKNG 0.53%
Consumer Staples:BF/B, MNST 0.41% , PG -0.78% , PM -1.11%
Energy:DVN 0.19% , PSX -3.71% , VLO -0.80% , XOM, MPC -0.56%
Financials:AXP -0.62% , PYPL 3.00%
Health Care:ISRG 0.59% , VRTX -0.06%
Information Technology:AAPL -0.41% , AMD 2.41% , ANET -0.02% , CDNS 1.92% , CRM 0.42% , FTNT 0.19% , KLAC 4.95% , MSFT 1.80% , NOW 0.73% , NVDA 6.25% , ON 2.29%
Industrials: FTV -0.31% , GWW -1.96% , HON 0.22% , UNP
Materials: CF 0.04%
We publish on a 3-day a week schedule:
– Sun eve / MON am
–SKIP MON
– Tue eve / Wed am
– SKIP WED
– Thu eve / Fri am
More from the author
Articles Read 1/2
🎁 Unlock 1 extra article by joining our Community!
Stay up to date with the latest articles. You’ll even get special recommendations weekly.
Already have an account? Sign In 82ea6b-15860c-cf720d-e638b3-37c080
Already have an account? Sign In 82ea6b-15860c-cf720d-e638b3-37c080

