


35% S&P 500 reports this week, and some key housing, consumer inflation data = expect upward bias in "grind." Leading food + shelter indicators point to disinflation suggesting >80% CPI in disinflation by summer.


Be sure to catch our webinar this week on Thu April 27th, where we discuss signs supporting the end of a bear market.
Last week, I attended an investor dinner which included a senior partner at a venture capital firm and investors with extensive operating experience (running businesses).
- Overall, it was a great conversation covering AI, autonomous driving, energy policy and of course the regional bank crisis/CRE decline. The VC made several great points on autonomous driving and the high probability that China or even Europe will be the first market to see complete autonomous driving. The rules in the US are so tortuous that the gating factor will not be technology. And as for AI, this is obviously critical to the future of any nation seeking technological edge, which is a reason to expect Taiwan to be an important battleground. I was surprised to learn that the increase in coal usage in 2023 has unwound nearly a decade of clean carbon progress. And this is a reason many believe US exporting LNG might be the long-term solution for carbon emissions.
- The most disagreement was seen in the discussion on the developing crisis in commercial real estate and tangentially the still festering regional bank crisis. Several noted their own businesses plan for a reduction in commercial office space. And some investors expressed a view this could be a widening crisis akin to 2008.
- There are many investors, perhaps the plurality, who see echos of 2008 in the 2023 regional bank-coming CRE crisis. This has been mentioned in many of our recent meetings, and generally with a word of foreboding –> “recall, many said the recession would be “mild” in 2007″
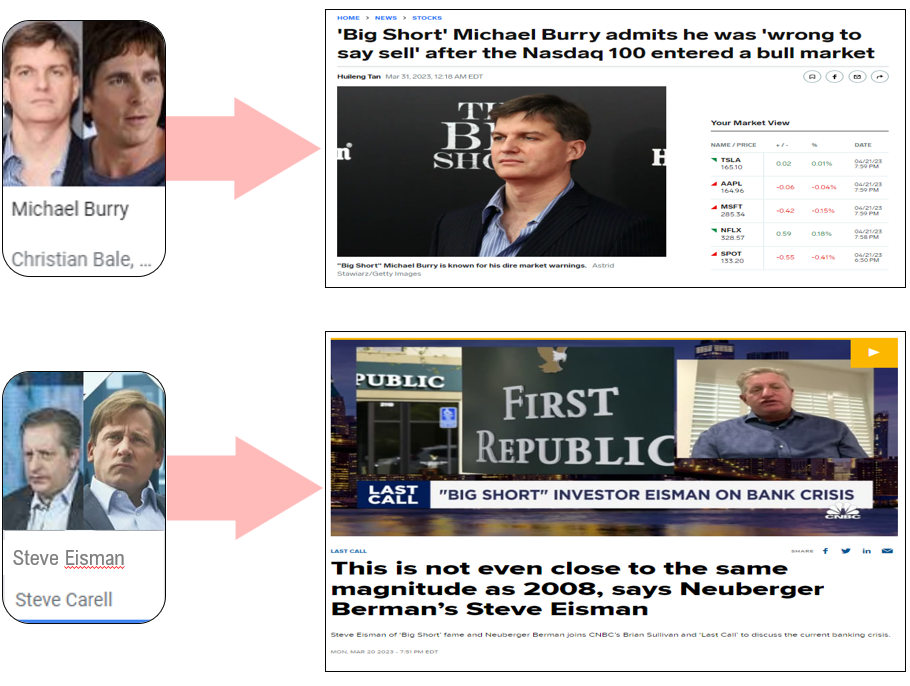
- Here is a simple exercise. What are legendary investors who capitalized on GFC saying about 2023? After all, wouldn’t it make sense these very investors could assess the risks of 2023 vs 2008? We have highlighted comments from two: (i) Michael Burry (Scion Capital) and (ii) Steve Eisman. Burry recently tweeted “I was wrong to say ‘sell.” Eisman was on CNBC a few weeks ago saying “this is not even close in magnitude to 2008.” In other words, too many people still carry “2008 hammers” seeing every crisis as dire in magnitude as GFC.
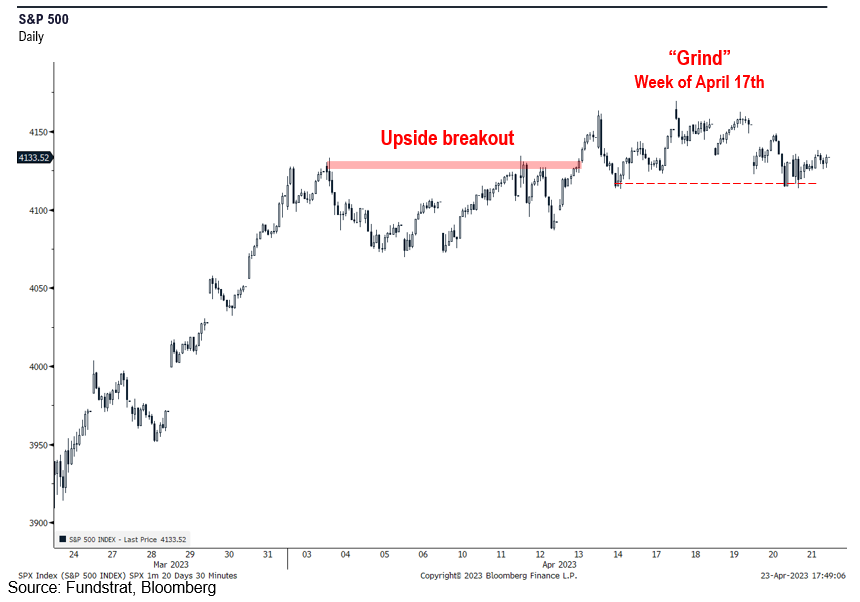
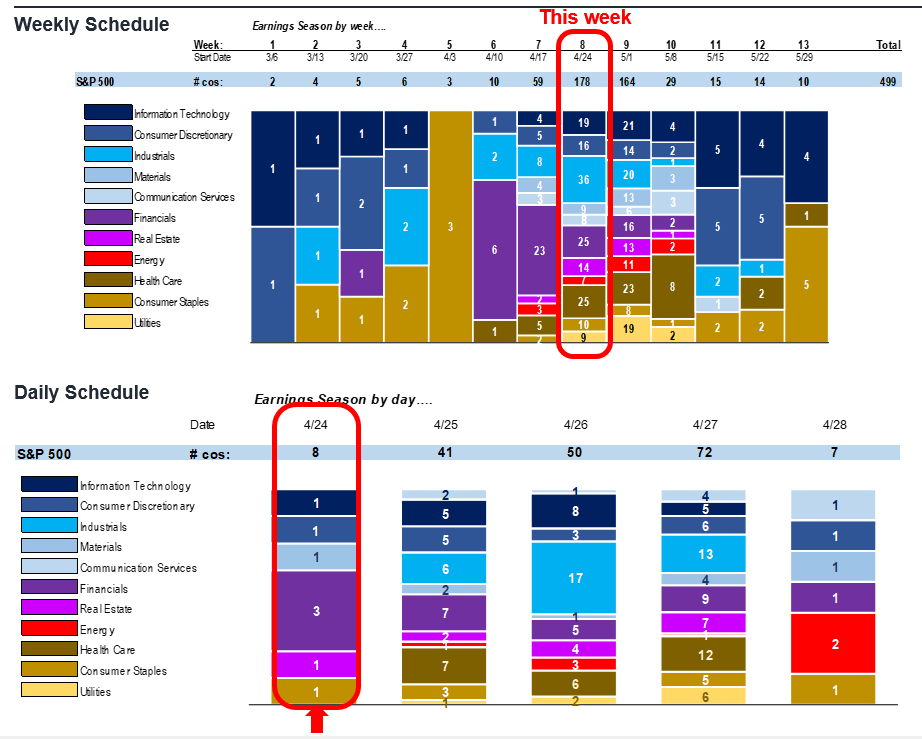
- Stocks have been “grinding” but with a continued gradual upward bias. The Fed is entering its blackout period in front of the May 3-4 FOMC meeting, so investors will be focused on incoming macro data (below) and on 1Q23 earnings season. 1Q23 earnings season accelerates with 178 reporting or 35% of S&P 500.
- In the coming week, the key economic reports are:
– 4/25 CS Corelogic home prices Feb –> likely softer than consensus -0.40% MoM
– 4/28 U Mich inflation 1-yr final April –> likely better than +4.6% mid-month
– 4/28 PCE Core deflator Mar –> likely softer than +0.3% consensus - In our view, leading indicators point to a sustained and widening decline in inflation. Notably, two key CPI components are showing signs of accelerating declines: (i) housing (34%) and (ii) food (14%). These two components are 48% of the CPI basket, and if/when they see outright deflation, this will create significant downward pressure on CPI. Currently 33% of the CPI basket is in outright deflation (below). This is above the 50-year average of 30%.
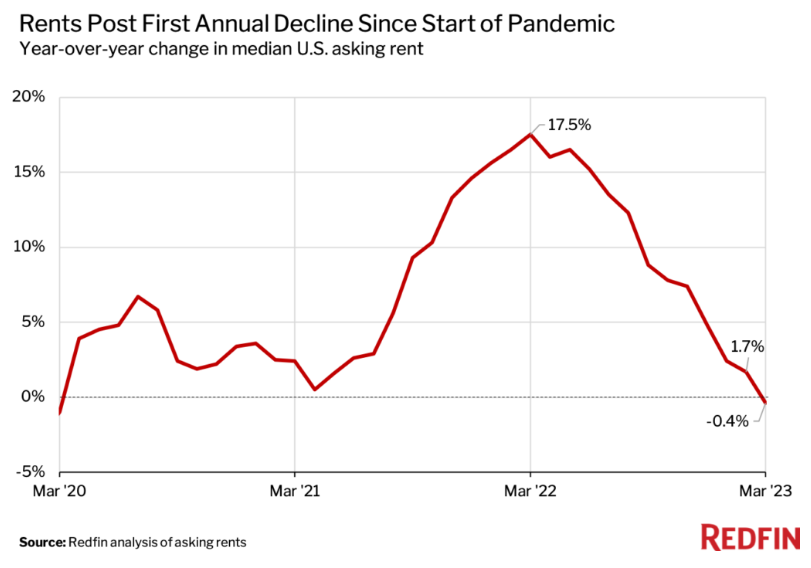
- Last week, Redfin noted that the median asking rent for an apartment fell year over year for the first time since the start of the pandemic. Market-based rents reflect new leasing activity and Case-Shiller has been showing this trend for home sales for some time. Yet, CPI showed shelter March CPI posting the highest YoY gain in this cycle yet. This reflects the obvious statistical lag, and our data science team sees this synching up in mid-2023. This would be 34% incrementally of CPI falling into deflation.
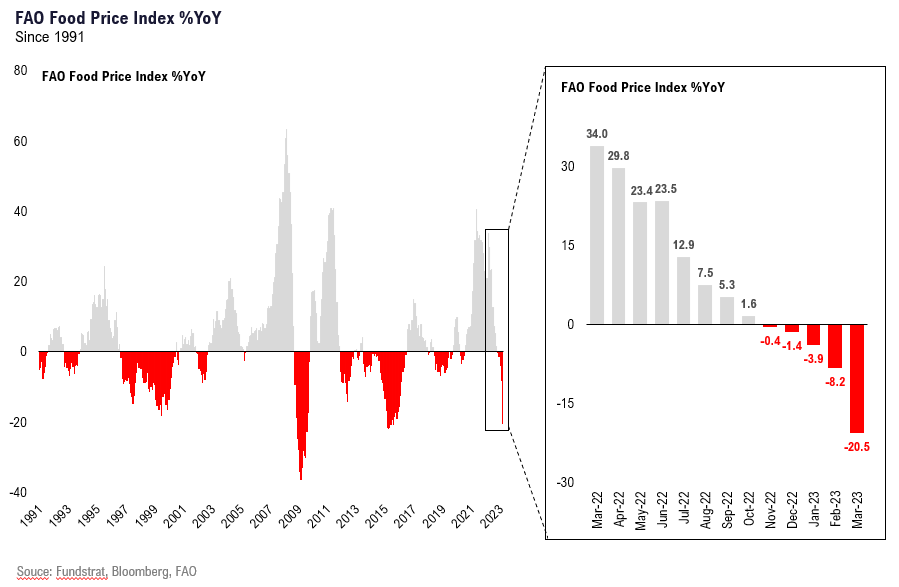
- Additionally, last week, the FAO (Food Agricultural Organization) food price index posted a -21% YoY decline in the aggregate food basket. Every single month in 2023, this index has seen downward acceleration of food prices and this is the lowest figure in 8 years (since 2015). This is commodity and wholesale prices and this will eventually be reflected in retail food prices.
- That is, while this week’s data is important, our base case framework is that inflation will soon roll over hard over the summer. The above analysis suggests that soon an additional 48% of the CPI basket will see accelerating downward pressure. This would take this figure to 81%. In the last 50 years, the only time this figure exceeded 80% was 2009 and in 2009, the world was battling deflation.
- Are we sure inflation remains a problem?
- The bank loan crisis remains festering and the recent Fed H.8 (thru 4/21) was impacted by 2022 individual tax payments (taxes due 4/18). The good news is that bank loans rose by $13.8 billion, the second consecutive week of increased bank loans. Small banks increased lending by $10.5 billion. So it does seem the credit crunch is rebounding somewhat.
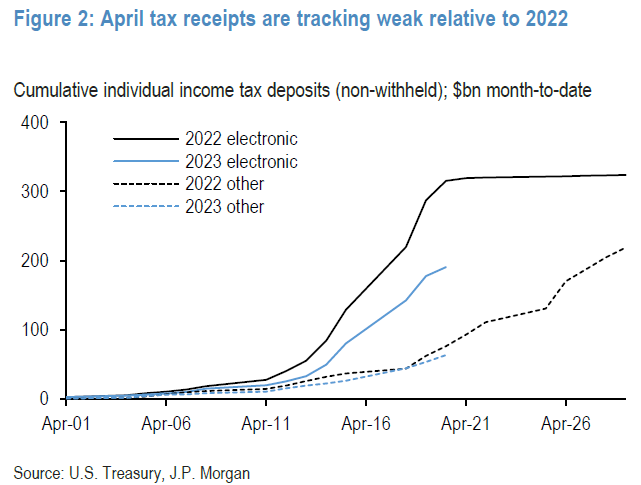
- Tax receipts for 2023 are tracking BELOW 2022. Economists and political strategists correctly note this raises the risk the debt ceiling limit is reached sooner than previously expected. And this is important. But arguably more important is this does raise the question whether the employment market is as strong as many suggest. After all, if tax receipts are down YoY, how does this stem from the “tightest labor market” in history?
Bottom line: Stocks still grinding until May FOMC, but the bias has been higher
Equities have fallen into a grind in the past week, disappointing as we expected April to be consistently stronger. There are 5 trading days left in this month and some key economic data. The key remains for inflationary pressures to stay tame/declining and for labor markets to continue to soften. The lighter than expected tax payments show income growth is clearly falling short relative to the message of strong labor markets. As for investor sentiment, this remains negative and we believe is supportive of a positive bias.
GFC: Big short investors are not seeing GFC redux in 2023 CRE/regional bank crisis
The Big Short is the book/movie by Michael Lewis on the GFC. The GFC was a global disaster and because this happened only 15 years ago, is still fresh in the minds of many investors.
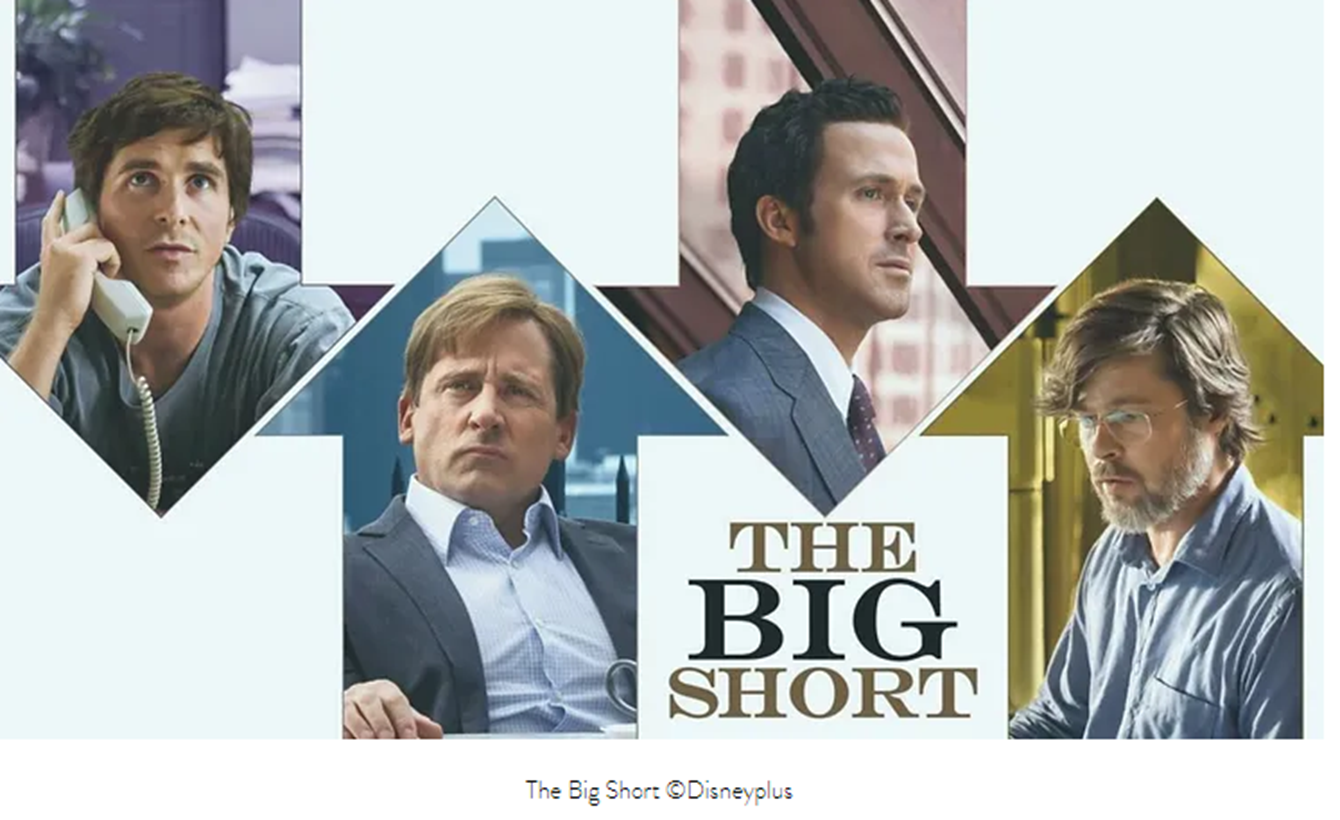
Two of the central players in the GFC, Michael Burry (Scion) and Steve Eisman (now Neuberger & Berman) have weighed in with their views of 2023:
- Burry –> not seeing echos of 2008
- Eisman –> says not even close to same magnitude
You get the picture. These two, who capitalized on 2008, do not see a repeat.
Surprisingly, investors are not alone. 55% of CEOs, according to a survey by Fortune, believe this coming recession will be worse than the GFC. The source of the survey is EY CEO survey from January and this is certainly peculiar:
- why would they be ready to do M&A if it will be worse than the GFC?
- LOL

TAX RECEIPTS: Debt ceiling implications but also household income
This chart from JPMorgan speaks for itself. Tax receipts are tracking lower than 2022 by a sizable margin.
DISINFLATION: Rent and Food leading indicators are rolling over
Last week, Redfin noted that the median asking rent for an apartment fell year over year for the first time since the start of the pandemic. Market-based rents reflect new leasing activity and Case-Shiller has been showing this trend for home sales for some time.
Additionally, last week, the FAO (Food Agricultural Organization) food price index posted a -21% YoY decline in the aggregate food basket. Every single month in 2023, this index has seen downward acceleration of food prices and this is the lowest figure in 8 years (since 2015). This is commodity and wholesale prices and this will eventually be reflected in retail food prices.
The above two datasets are leading indicators for their respective CPI components.
- Shelter is 34%
- Food is 14%
- This suggests that soon an additional 48% of the CPI basket will see accelerating downward pressure.
Currently, 33% of the CPI basket is in outright deflation (weighted). This would take this figure to 81%. Look at the quantum jump in this series when shelter and food are “adjusted”

In the last 50 years, the only time this figure exceeded 80% was 2009 and in 2009, the world was battling deflation. So, this raises the question to me whether Fed and policymakers are too focused on “backwards” looking reported CPI:
- the forward indicators argue a steep drop is coming.

FED H8: Bank loans rising two consecutive weeks…
The bank loan crisis remains festering and the recent Fed H.8 (thru 4/21) was impacted by 2022 individual tax payments (taxes due 4/18).
- The good news is that bank loans rose by $13.8 billion, the second consecutive week of increased bank loans.
- Small banks increased lending by $10.5 billion. So it does seem the credit crunch is rebounding somewhat.
- But loans contracted by $100 billion March 15-March 29, so the rise of $25 billion in the past two weeks is only a partial retracement so far.

1Q23 EPS: Heaviest week of earnings this week
The heaviest earnings is this week with 178 companies reporting (36% S&P 500) and a significant number of Technology, Financials and Industrial companies. Clearly earnings will be the forefront.
ECONOMIC CALENDAR: Key is inflation, and April so far is “tame”
The only negative data point this month has been the U Mich mid-month April inflation expectation. As we highlighted earlier, this seems like a fluke as prior instances of a 100bp monthly jump were reversed. Wed is Fed beige book, so there will be some macro news.
Key incoming data April
4/3 10am ISM Manufacturing Employment/Prices Paid MarchTame4/4 10am ET JOLTS Job Openings (Feb)Tame4/7 8:30am ET March employment reportTame4/12 8:30am ET CPI MarchTame4/12 2pm ET March FOMC MinutesTame4/13 8:30am ET PPI March Tame- 4/14 7am ET 1Q 2023 Earnings Season Begins Better than feared
4/14 Atlanta Fed Wage Tracker MarchSemi-strong4/14 10am ET U. Mich. March prelim 1-yr inflationHawkish4/19 2:30pm ET Fed releases Beige BookTame- 4/25 9am CS Corelogic home prices Feb
- 4/25 10am Conference Board Consumer Confidence/Expectations April
- 4/28 8:30am 1Q23 Employment Cost Index
- 4/28 8:30am ET PCE March
- 4/28 10am ET UMich April final 1-yr inflation
In fact, incoming data on inflation has been soft since the start of March (the start Feb data) and supports the idea that the “hot” inflation readings in Jan (reported in Feb) was the anamoly.
Key incoming data for March 2023
3/7 10 am ET Powell testifies SenateHawkish3/8 10am ET Powell testifies HouseNeutral3/8 10am ET JOLTS Job Openings (Jan)Semi-strong3/8 2pm ET Fed releases Beige BookSoft3/10 8:30am ET Feb employment reportSoft3/13 Feb NY Fed survey inflation exp.Soft3/14 6am ET NFIB Feb small biz surveySoft
3/14 8:30am ET CPI FebTame3/15 8:30am ET PPI FebTame3/17 10am ET U. Mich. March prelim 1-yr inflationBIG DROP3/22 2pm ET March FOMC rate decisionDOVISH3/31 8:30am ET Core PCE deflator FebTame3/31 10am ET U Mich. March final 1-yr inflationTame
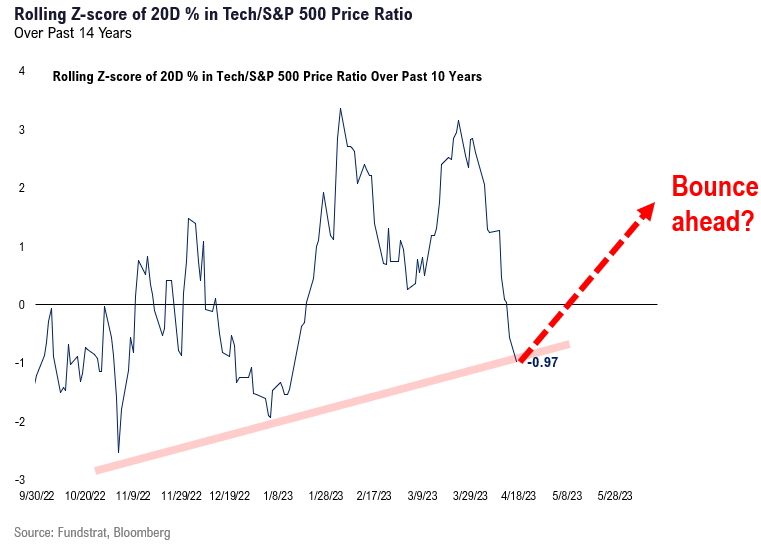
TECHNOLOGY: -1 Z-score likely reverses post results
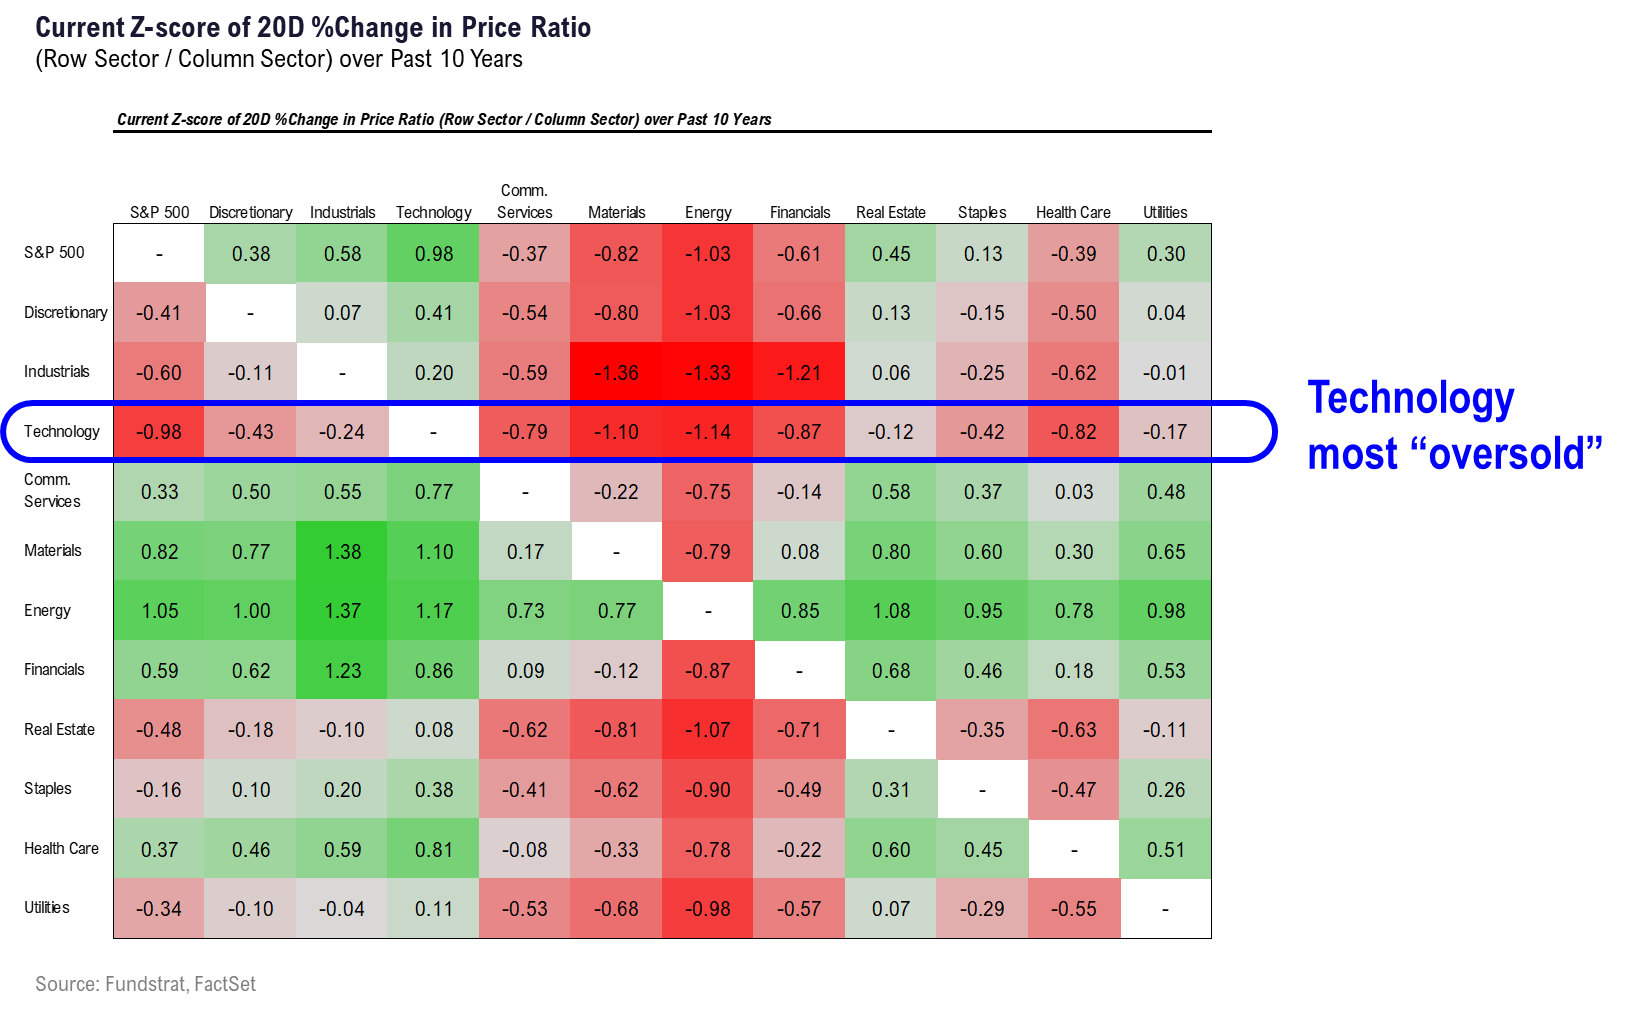
Technology stocks have been among the worst sectors in the past 20 days (month) and as the table below highlights:
- -0.98 z-score vs S&P 500 (-1 std deviation weakness) and
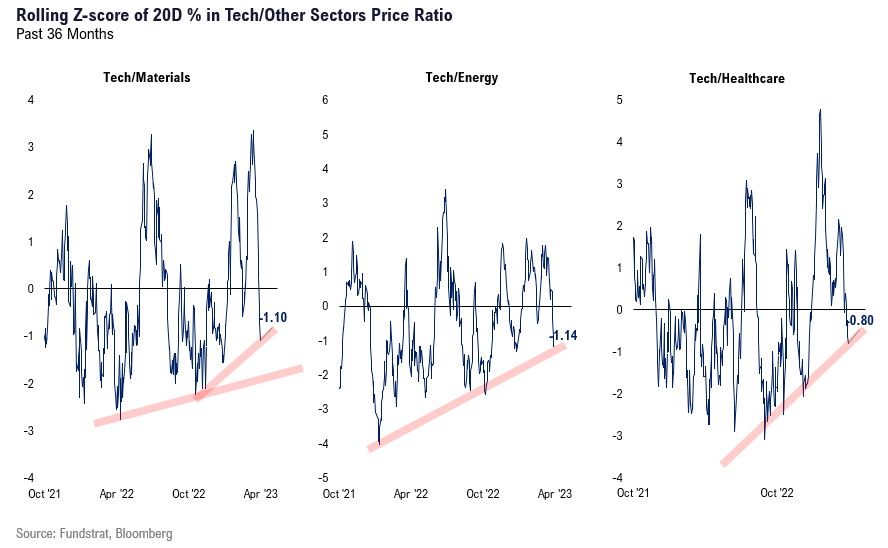
- -1 z-score vs Materials, Energy and Financials and close to that for Healthcare
- So Technology has been a source of funds in the past month
But as shown below, it is at critical support. This is a rising trendline (zscore) and we think demand and margins holding up better (our view), will support a rally in Technology stocks.
This same support is seen at pairs of Technology vs Materials, Energy and Healthcare.
- so the logic remains the same
- we see Technology reversing this recent weakness as we move through 1Q23 results season.
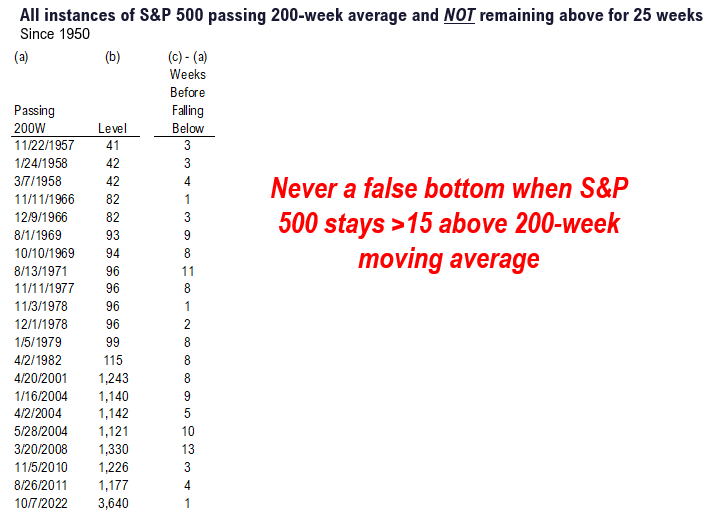
STRATEGY: Staying above 200 week moving average = good
The S&P 500 has been above its 200 week moving average for 25 weeks now as shown below. On Oct 12, 2022, the S&P 500 touched this level and has since moved higher.
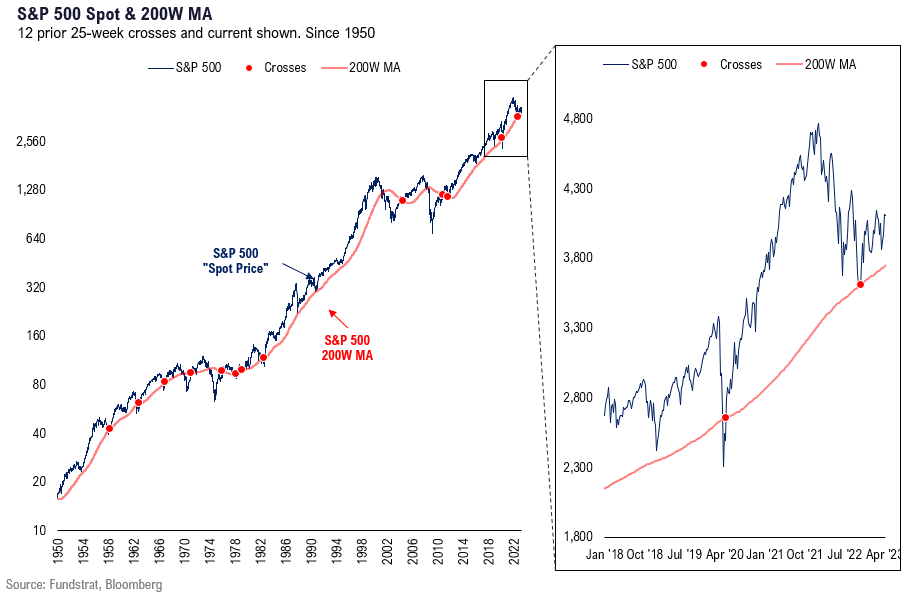
In fact, as the table below shows, in the 12 instances of crossing above 200 week moving average and staying there for 25 weeks:
- S&P 500 higher in 12 of 12 instances
- for all periods, 1M, 3M, 6M and 12M
- doesn’t this sound like a bull market?
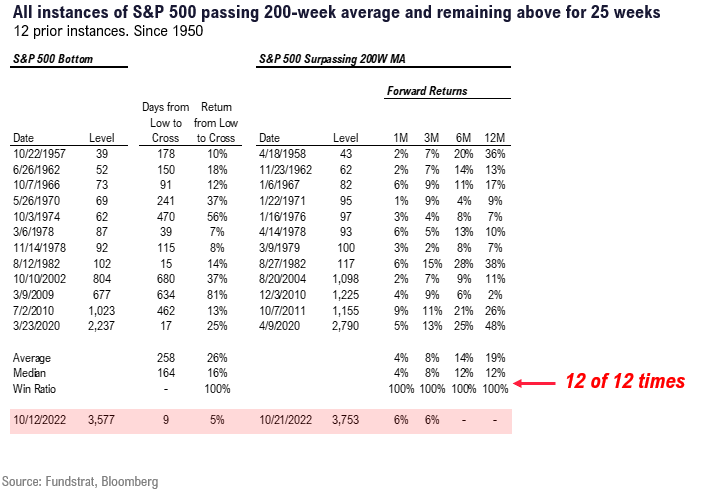
We arrived at “25 weeks” based upon the table below.
- since 1957, there have been multiple crosses above 200 week
- but many failed and led to new lows
- the longest of these “fake recoveries” is 13 weeks
- thus, we looked at 15 weeks as the threshold
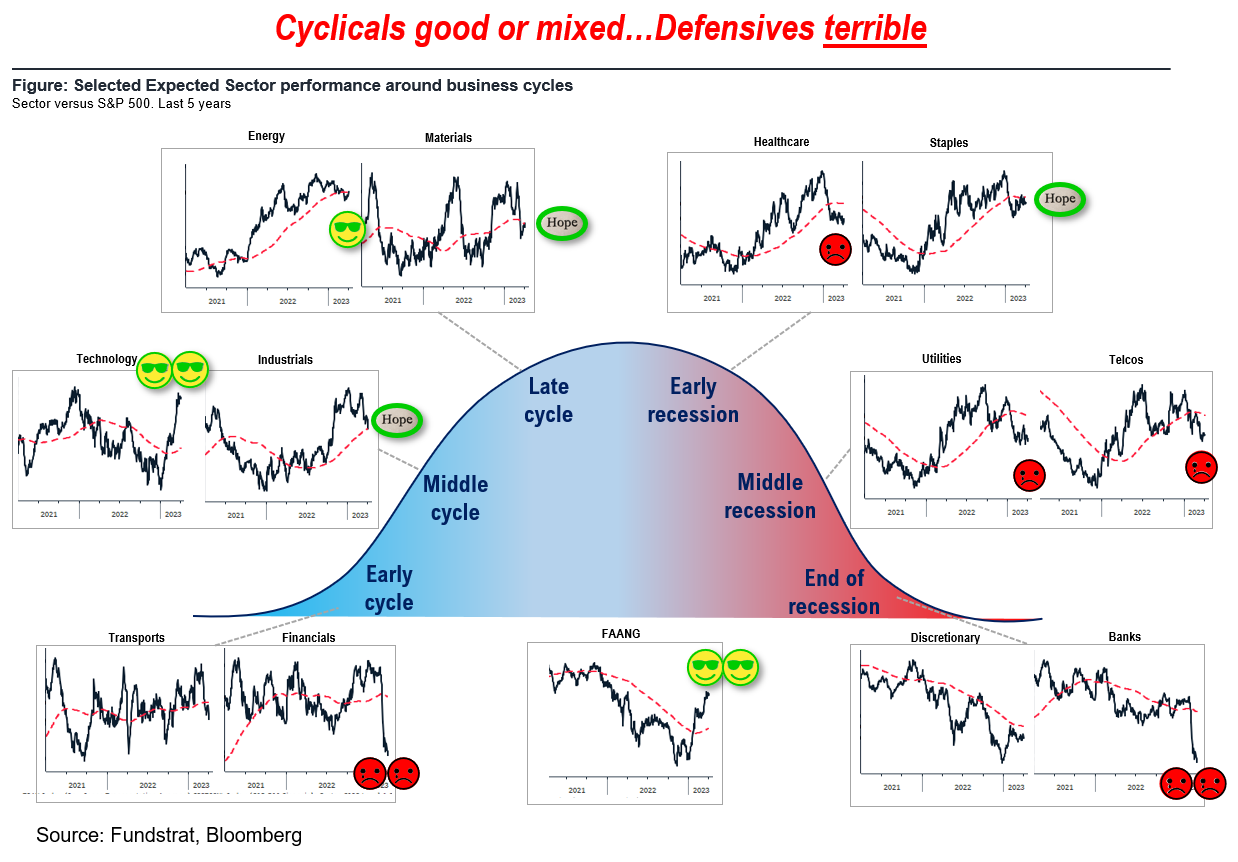
STRATEGY: Cyclicals outperforming more than Defensives
We have highlighted the 2-yr relative performance of the major groups below and as shown, the leadership is more cyclical.
- Leading are Tech/FAANG, Energy, some Industrials, Materials and Staples.
- The drags on S&P 500 performance have been Utilities, Financials, Telecoms and Healthcare.
- In other words, the drags have been largely Defensives.
- This is counter to those saying this rally in 2023 is Defensive stocks.
And our base case for April remains a strong >4% rally, following the pattern of “Rule of 1st 5 days.” The Rule of 1st 5 days looks at years when S&P 500 gains >1.4% in 1st 5 days and is negative the prior year.
- This has happened 7 times since 1950: 1958, 1963, 1967, 1975, 2003, 2012 and 2019.
- Based upon those 7 years, April implied gain is +4.2% and was positive 6 of 7 times (only 2012, -0.7%). This implies +175 points, or S&P 500 >4,275 by the end of April.

A gain of 4%, or +172 points would put S&P 500 >4,250 by the end of the month. And we think this would ultimately force a bear capitulation.

We publish on a 3-day a week schedule:
Monday
SKIP TUESDAY
Wednesday
SKIP THURSDAY
Friday
_____________________________
37 Granny Shot Ideas: We performed our quarterly rebalance on 1/30. Full stock list here –> Click here
______________________________
More from the author
Articles Read 1/2
🎁 Unlock 1 extra article by joining our Community!
Stay up to date with the latest articles. You’ll even get special recommendations weekly.
Already have an account? Sign In d31f69-5026c3-53cd43-b61589-6a90b4
Already have an account? Sign In d31f69-5026c3-53cd43-b61589-6a90b4

