

What Our Clients Are Talking About Behind The Scenes

The tug of war between the Bulls/Doves and Bears/Hawks continues as we head into the home stretch of 2022. There has not been a lack of data and headline news for both sides to try and make their case as the S&P 500’s rally that began in October is still hovering near 4000.
As has been the case since the end of 1Q22, my strategic work is still not supporting the rally, continuing to signal that the equity markets retain considerable downside risk. From time to time over the past eight months, my tactical work has flipped from unfavorable to favorable, suggesting that a countertrend rally was likely and at each one, I have advised that strategic accounts should not actively participate and chase higher, but aggressive traders could take a chance to play the wiggles.
My longstanding unfavorable forecast remains on the table and the main points continue to be valid based on my key indicators, which are 1) forward profit expectations remain too high, and cuts are still required; and 2) higher for longer from the Fed. Despite the bounce attempts during 2022 from tactical oversold conditions that were fueled with speculative hopes of Chair Powell and Gang turning dovish, my analysis has not shifted much, if any at all, since my initial move towards being bearish. The next two weeks and into year-end may be a bumpy ride with important inflation data and the consequential FOMC meeting on December 14th, but regardless of the S&P 500’s ending price level, my work continues to suggest that investors are still facing considerable downside risks into 1H23, which as of now may end up being a time range that contains THE equity market bottom when my key metrics flip back to contrarian favorable.
Leadership has been quite mixed and tactical all year with a defensive bias with Energy being the only sector in the green year-to-date, and Staples, Utilities, and Health Care rounding out the top four sectors. Forecasters with short-term outlooks have been flipping back and forth trying to catch the new sustained trends just as they are about to pause and begin reverting to the mean comes, which has been challenging for even the most skilled tactical traders. Yes, some stocks and sectors have had big moves during the rally attempts from the June low to the August high and from the October low until Present that investors who are willing and able to be more aggressive in trying to capture trading profits. With that being said, my analysis shows very little has been outside the typical expected behavior of bear market rallies that will ultimately fail and head lower to their final trough level.
With the S&P 500 having reached the obvious and oft-mentioned downtrend line from the 2022 all-times highs, which also happened to be near the 200-day & 50-wk moving average, the index looks to be both extended, tired, and ripe to begin its negative painful move lower to a retest of the October lows and beyond, especially as my preferred tactical tools are once again flipping back to unfavorable for the first time since the August highs. My next downside target range continues to be 3200-3000, which I have had on the board for a few months now.
Reiterating Key Assumptions:
- Headline Inflation has peaked.
- The U.S. economy is decelerating not collapsing, and fears of slowing have not reached their maximum level. The labor market remains resilient and is not yet showing any definitive signs of major slowing let alone contracting.
- Forward expectations for corporate profits are too high and most certainly will need to be lowered, especially names that are more sensitive to cyclicality.
- My work suggests that there has neither been a price nor fundamental capitulation yet, but they will both likely happen at some point in front of us.
- The Fed is still on a deliberate path to “Higher for Longer” that has been clearly communicated and not only based on moderating inflation readings. I continued to expect the terminal rate to reach 5.25-6.25% before 3Q23.
- THE equity market bottom is not in place yet, and my next downside target area is 3200-3000. NOTE: sharp downward capitulatory price action that takes the S&P 500 below 3500 may cause me to shift my view and start putting some money to work.
- My work still suggests selling rallies and not buying dips.
Bottom line: Danger signals are once again flashing and equity investors should be on full alert. Yes, the run to year-end will be challenging with key data releases, an FOMC meeting, and the positive seasonals so the S&P 500 could move anywhere between the wide range of 4200-3600, but regardless of what the final price is for 2022 my analysis says 1H23 will be filled with considerable downside equity risk.
As I have stated regularly for the last several months, the adjustment process for the economy, inflation, forward profits, and valuation levels still need more time to reach readings that flash as compelling for strategic equity investors. I have no doubt that a compelling opportunity on the horizon will reward the patient investors who have dry powder to put to work once my key indicators approach bullish contrarian readings, which will be when the reward risk ratio has once again flipped back to reward.
Thus, I continue to reiterate that bounces should be viewed as bear market rallies that will likely fail and should be used to sell into, reposition, raise hedges, and to reload shorts. Any tactical gains or outperformance for now is just the side show while the MAIN EVENT of pivoting for THE bottom is still in front of us.
OBSERVATIONS FROM CLIENT INTERACTIONS
- Few, if any, strategic investors that are fundamentally driven are bullish. However, many are keen to start identifying what will be the opportunities once THE bottom is in place.
- All clients agree that the peak in headline inflation has occurred and that forward profit expectations are still too high.
- There is a fair amount of disagreement between clients who subscribe to my more bearish/hawkish views versus those who agree with my colleague, Tom Lee, who has a more sanguine view on inflation, the Fed, and the current opportunities for the equity market. I can share with you that we have had some lively debates each week during our own internal analyst meetings.
- Regardless of one’s leanings, I get a sense that investors are frustrated by the real time market action as certain moves, both up and down, seem quite extreme.
- There are widespread views on what the fair value NTM P/E that the S&P 500 should trade at going forward. With that being said, the two camps are 14-16x and 17-18x, and no one is making a high conviction case for 18-22x.
- No high conviction about which sectors to over and underweight.
SPECIFIC CLIENT QUESTIONS
- Where does your market level earnings revisions indicator (ASM) stand and has it bottomed yet? Are analysts finally fearful and discounting a recession?
- Have you looked at positioning data and thoughts where things stand now?
- What are your most aggressive tactical indicators saying?
MY ANSWERS
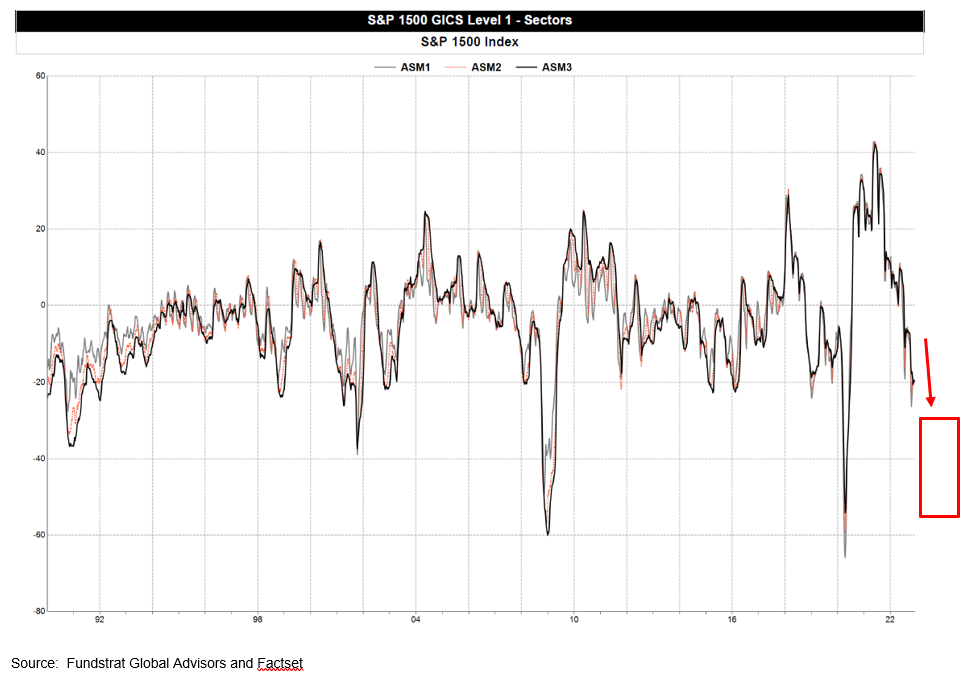
- Where does your market level earnings revisions indicator (ASM) stand and has it bottomed yet? Are analysts finally fearful and discounting a recession?
Not surprisingly, the forward profit forecasts still look too high and more negative earnings revisions still are likely coming. My main indicator for the S&P 500 for estimate revisions is called ASM (Analyst Sentiment Measure) and it is still falling as I have been discussing since early April. Importantly, it does not yet appear to have made it final extreme low (see chart below), which in my view is an extremely critical occurrence to switch back to being strategically bullish. I will reiterate yet again that this process is likely to persist for at least another 1-4 months, at minimum. Thus, patience will be needed if the historical relationship between the ASM indicator reaching max pessimism is consistent with previous six major bottoms since 1990. REMINDER — Why is fundamental capitulation important? My research shows that since 1990 the ASM indicator has made its extreme low BEFORE the S&P 500 makes its FINAL bottom in all six periods.
- Have you looked at positioning data and thoughts where things stand now?
There has been so much talk about equity exposure and cash levels this year that I spent some time looking into things and building a new indicator that would be helpful to both get a general sense of what institutional investors are doing, as well as a potential new forecasting indicator.
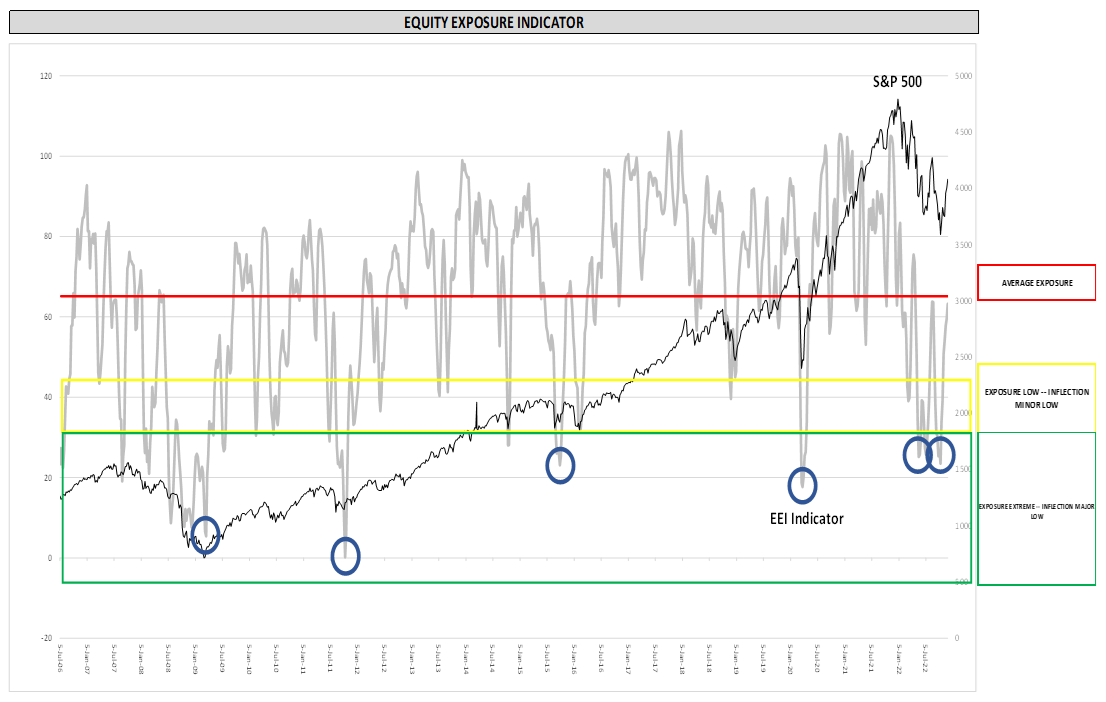
The bottom line is I have built a new tool, the Equity Exposure Indicator (EEI) and it showed that equity exposure at both the June and October lows were at the top end of the extreme negative exposure zone that typically leads to equity market rallies. Importantly, however, it has bounced to neutral/average exposure and is no longer a clear positive.
For those interested, I looked at several data sources and then created a proprietary indicator in the attempts to find a useful tool to suggest when institutional investors’ positioning is too negative and could be a catalyst for a better equity backdrop going forward. Interestingly, this new EEI indicator would have suggested at the both the June and October lows that equity positioning was quite low and potential bounces were likely. I am excited to add this to my toolbox to help call the next potential major low in the S&P 500.
- What are your most aggressive tactical indicators saying?
My aggressive metrics have both rolled back over as of today. HALO-2 had been slowly bleeding back for a several weeks, but V-Squared just flipped. Granted, it is aggressive making this call in front of the inflation data and FOMC meeting next week, but with the clustering of overhead resistance between 4050-4200 the odds are quite high that if a market peak has not already occurred, it will over the next couple of weeks.
Thus, my advice is this: don’t be lulled to sleep and miss what might be your last good opportunity to raise cash, reposition, hedge, and reload shorts even if there is one last attempt into year-end.
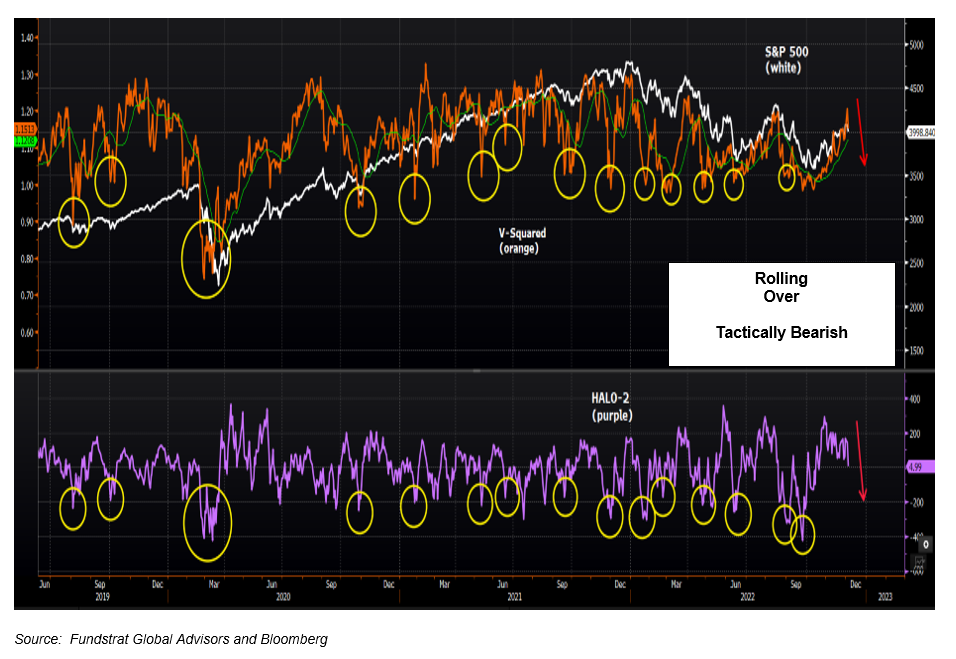
The proprietary Fundstrat Portfolio Strategy HALO-2 Model, which is the purple line in the lower chart shown above, is the raw tactical data behind our standard HALO multi-factor model described on the previous page. It is useful for identifying aggressive tactical trading bottoms for the S&P 500.

