

Arguably yield curve "mechanically" inverted due to inflation backwardation. Jackson Hole key event. Signs of "disinflation" = 2H rally.

We publish on a 3-day a week schedule:
Monday
SKIP TUESDAY
SKIP WEDNESDAY –> Traveling This Day
SKIP THURSDAY
Friday
The key macro events come at the end of this week, including Powell’s speech at Jackson Hole and the August UMich consumer surveys (8/26 at 10am ET) and July PCE (8/26 at 8:30am ET).
- consensus seems to expect Powell to reset “hawkish” expectations
- but that is a relative question
- many of our clients seem “hawkish” and believe inflationary pressures are greater than “markets realize”
- but given this is a widely held view, it is not entirely correct to say markets have become “dovish” relative to the Fed
There is a ton of incoming economic data this week. Take a look at this calendar:
- Global PMIs
- New Home sales
- Durable goods orders
- Regional Fed surveys Richmond and Kansas City Fed
- July spending
- U Mich inflation expectations
Overall, an important week.

YIELD CURVE INVERSION: Is this primarily due to inflation backwardation?
The inversion of the yield curve (shorter term Treasuries have a higher yield than longer term) is a reason many investors expect a recession in the near term.
- historically, the yield curve inverts prior to a recession
- however, we wonder if the current inversion is due to “inflation backwardation”
- that is, the curve might be mechanically inverted due to inflation being higher short-term
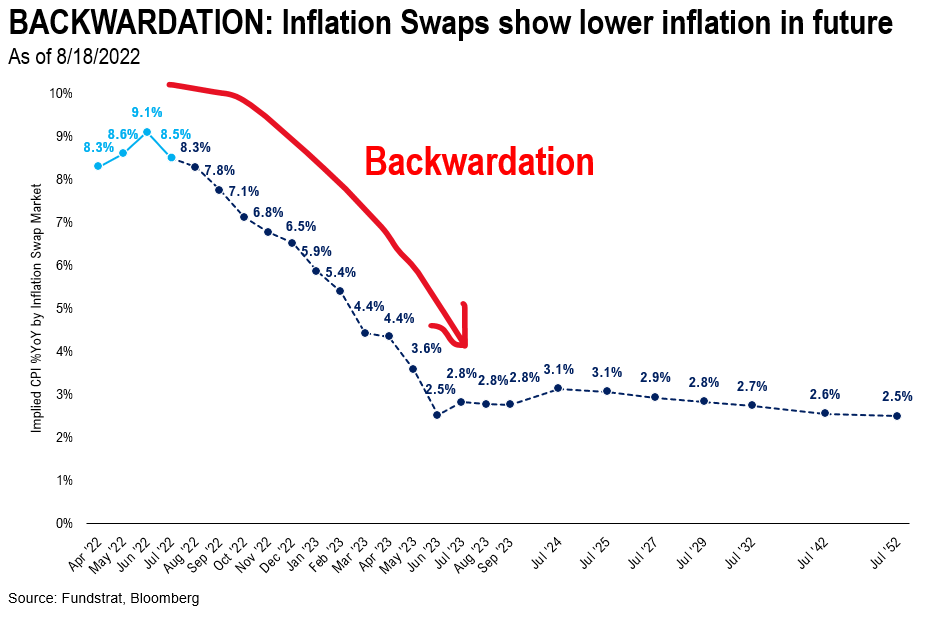
Take a look at the inflation rates YoY implied by the inflation swap curve. There is a pronounced pattern:
- inflation in the near-term is expected to be considerably higher than inflation 3, 5 and even 10-years out
- this is a “backwardation” of the inflation curve
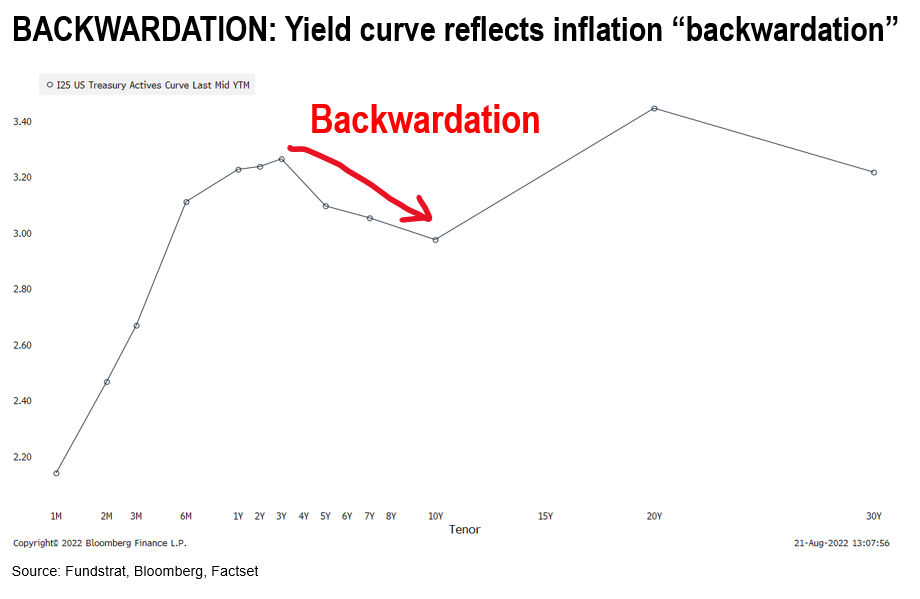
…holding “term premia” constant, the yield curve would therefore be inverted
Think about this. If the risk of owning Treasuries is constant, then the nominal yield curve would be inverted:
- if risk of owning 2-year and 10-year is stable over time
- then if inflation was in backwardation
- 10-year nominal yields could be lower than the 2-year
We think this influence is causing the 10Y less 2Y curve to be inverted
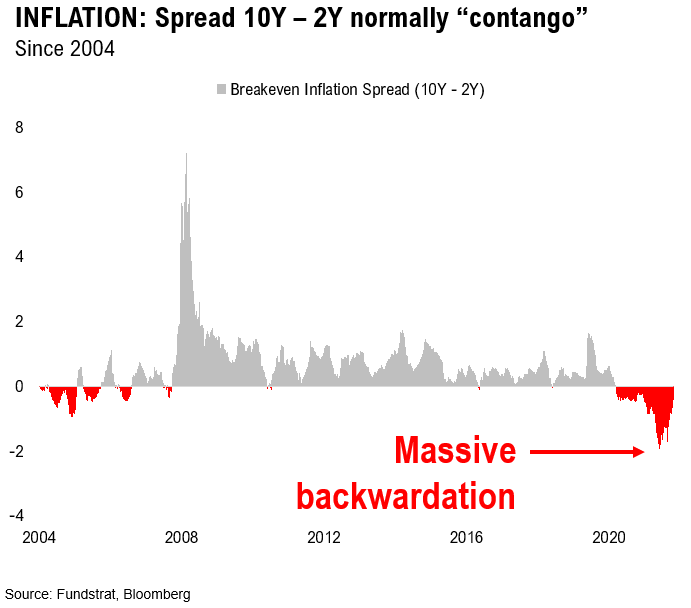
Inflation “backwardation” steepest in at least 20 years
Take a look at this spread between 10Y expected inflation versus 2Y expected inflation. As shown below:
- this current spread of 200bp is the largest in at least 20 years
- normally, inflation is in contango, meaning future inflation rates expected to be higher than current
- for swaps markets, this reflects “term premia” as well
In short, if there is inflation backwardation, we believe this “mechanically” causes the nominal yield curve to invert. This is what we are seeing today.
In fact, Fed officials have also made note of this. Take a look at the comment from Fed’s Neel Kashkari.
Inflation is in backwardation as many leading indicators suggest future inflation should be lower
We have been tracking leading indicators of inflation recently. And, as we have noted in many prior commentaries, the leading indicators of core inflation items are pointing to falling inflation:
- in fact, many are seeing outright deflation sequentially
- and the lag of YoY math means we will not see “deflation” for up to 12 months
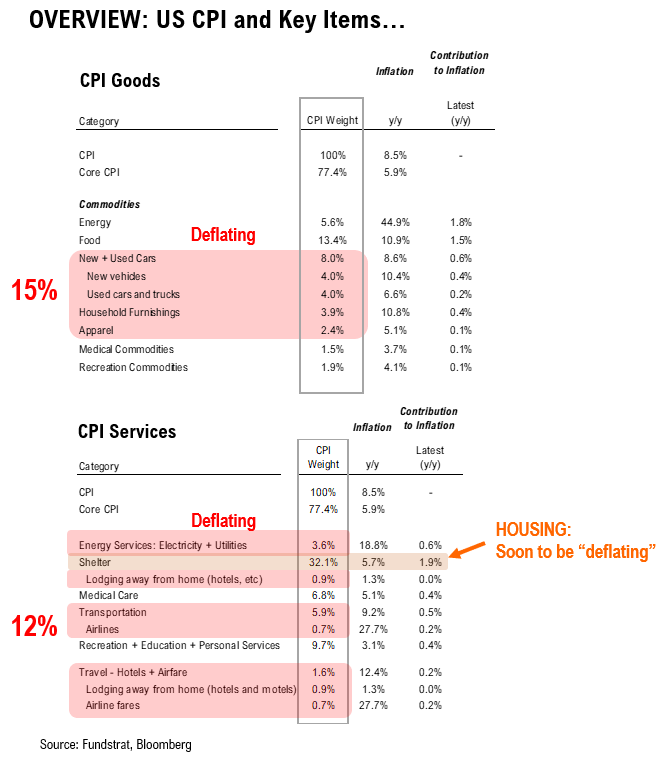
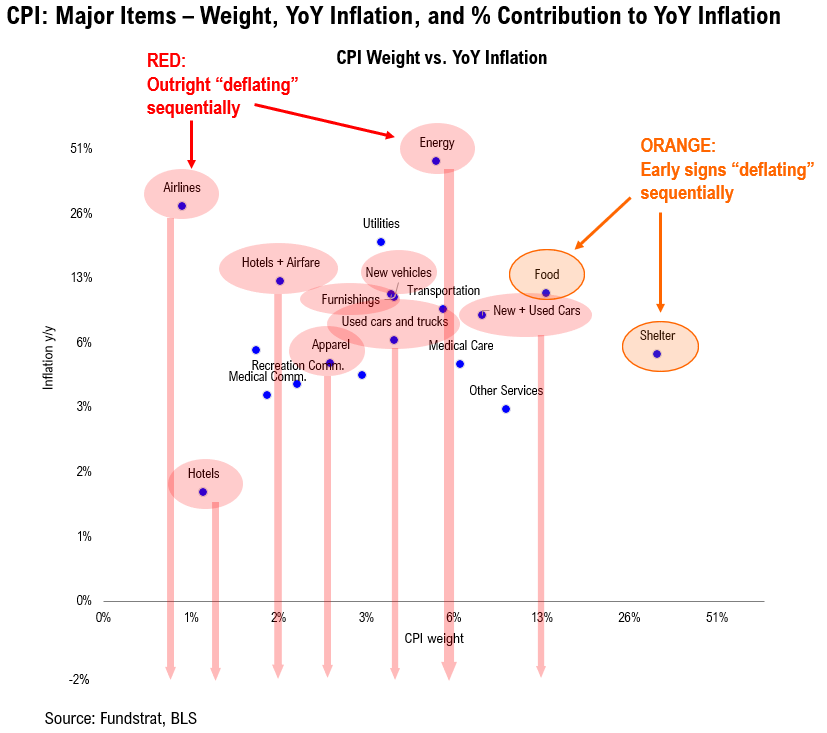
This scatter helps visualize this better. As you can see, many key items with huge YoY CPI currently are in outright deflation:
- used and new cars
- hotels
- apparel
- home furnishings
- early in US housing, where prices are rolling
- even food prices
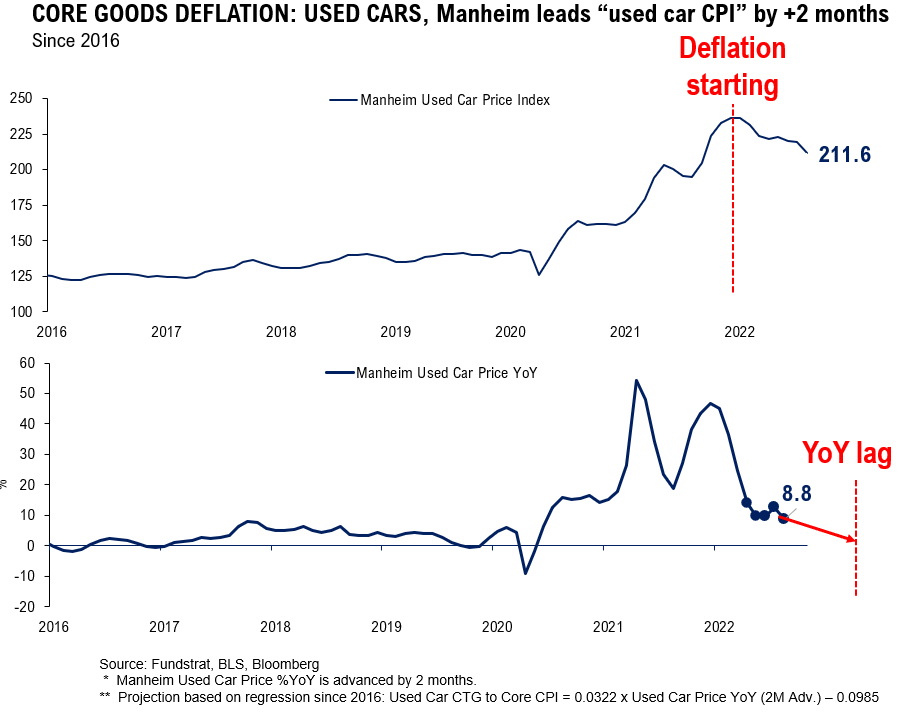
CORE GOODS DEFLATION: Used cars peaked in January 2022, but YoY CPI will not show until 2023
Take a look at Manheim Used Car Price Index. The price declines since January 2022 are accelerating downwards. Meaning, the pace of decline is even faster:
- yet the YoY price of a used car is still showing +8.8%
- deflation started in January 2022
- so, what is the more correct trend in “core goods” of cars
- deflation or inflation?
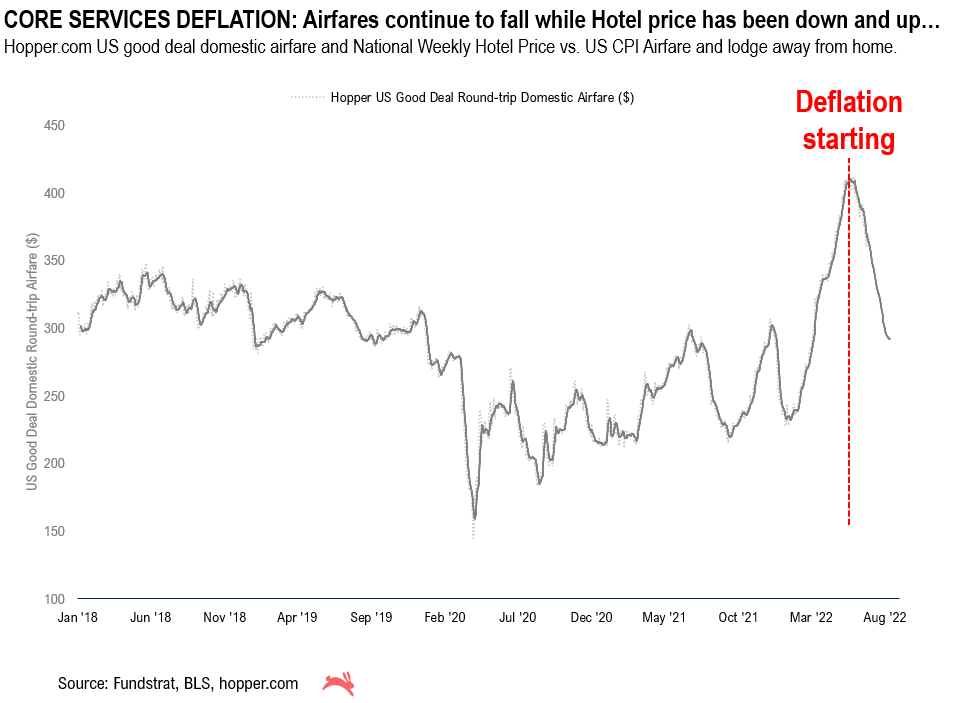
CORE SERVICES: Airfares falling since June 2022, but YoY still showing positive
The same is true of core services items as well. Take a look at airfares:
- earlier in 2022, this was a major contributor to CPI YoY
- airfares peaked in June 2022
- but the YoY will still show positive until 2023
- so the same question arises on core services trends
- is airfare deflating (trend since June) or up YoY per maths?
- What will matter for markets and for the Fed?
Supply chain is also seeing deflation
Prices along the supply chain continue to ease. Look at truckload contract rates, as shared by @freightalley:
- Van contract rates haven been in outright deflation since June 2022
- prices are the lowest since Feb 2022
- and this is a huge reversal from the steady rise from July 2020 to June 2022
- again, do we want to look at sequential math or YoY?

But this easing of the supply chain is a reason we are seeing food prices fall. Recall, we noted this last week, regarding chicken wing prices.
- down 62% from a peak
- wow
FOOD DEFLATION: Chicken wing prices down 62% from 2021 peak

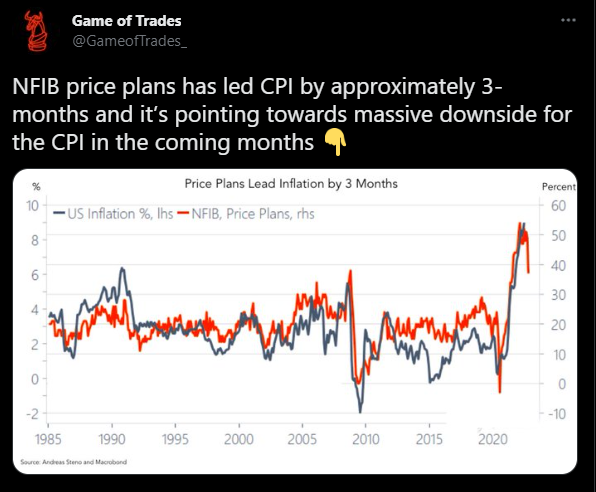
DEFLATION LEADING INDICATOR: NFIB survey “price” leads CPI by 3 months
Another leading indicator comes from the various “soft” surveys. For instance, as @GameofTrades_ notes, the NFIB survey “price plans” leads CPI by 3 months:
- if this is correct
- CPI will fall sharply in coming months
- again, should we focus on sequential math or YoY?
STRATEGY: Fed has less “work to do” and thus, rise in markets is appropriate
The above analysis provides context to our views on inflation risk. We believe inflation risks are lower than many believe:
- too many investors focus on “hard” reports like CPI
- CPI YoY math severely lags actual trends
- leading indicators show inflation is falling
- thus, inflation may not be as “sticky” as many believe
- meaning, Fed has less work to do
Bottom line, we expect markets to rally in 2H. While there remains a lot of uncertainty regarding macro, we think underlying inflationary pressures are easing, which in turn means Fed has less work to do. This is not necessarily the consensus view. But it is a view increasingly transmitted in the bond market.
…High-grade bonds are rallying = supportive of equity rally
Investment grade bonds have rallied sharply in the past 8 weeks as well. The ICE BofA Investment Grade OaS (options-adjusted spread) has rallied sharply in the past 8 weeks:
- now at the best levels for all of 2022
- a similar rally has been seen in high-yield as well

In fact, the US Fixed Income Strategy team at JPMorgan expects a further rally. They see multiple factors supporting a spread rally and lowered their YE spread target (more rally):
- they see bullish factors
- market sentiment rebound
- strong credit fundamentals
- increased likelihood of a “soft landing”
- they see OaS rally to 150bp (vs Treasuries) versus prior target of 175bp
Bottom line, when credit rallies, both high-grade and high-yield, this is supportive of equities rallying. Hence, we continue to look for a 2H rally into YE. We are buyers of dips.

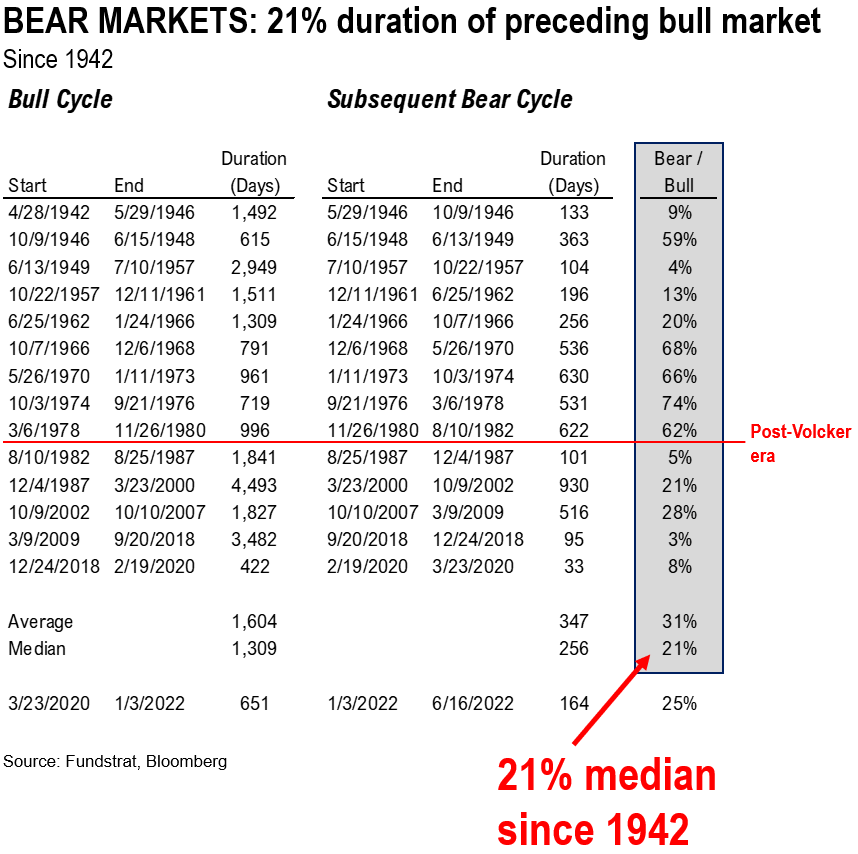
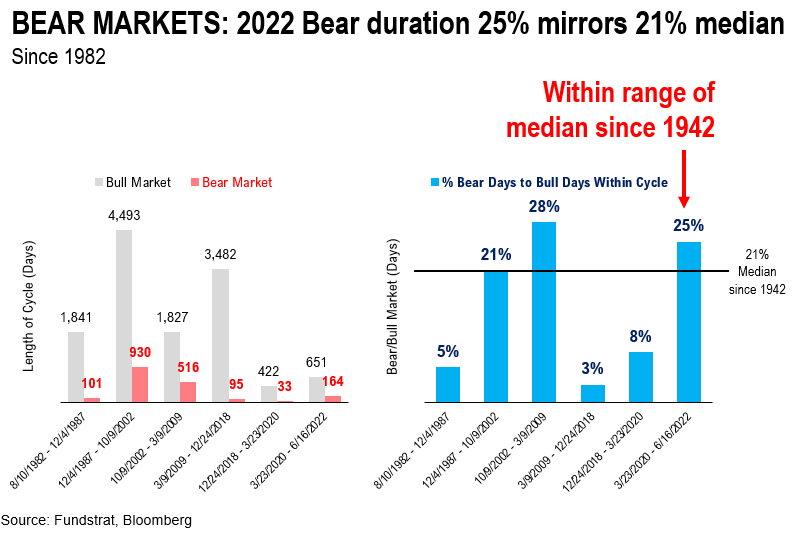
STRATEGY: 2022 Bear market was 164 days, or 25% duration of prior bull
Our data science team put together the comparative duration of bull markets and bear markets, and the corresponding ratio:
- since 1942, there have been 14 such cycles
- median ratio of bear vs bull is 31%, meaning a bear market is roughly 1/3 duration
- since 1982, this ratio is only 15%
- in 2022, the preceding bull market was 651 days
- the current bear market was 164 (using 6/16)
- or 25% ratio
As seen below, this ratio is solidly within the ranges seen since 1982.
- many investors think “more time” is needed for this bear market
- but given the shortness of the preceding bull market 651 days versus 1,309 median
- the corresponding bear market should also be shorter
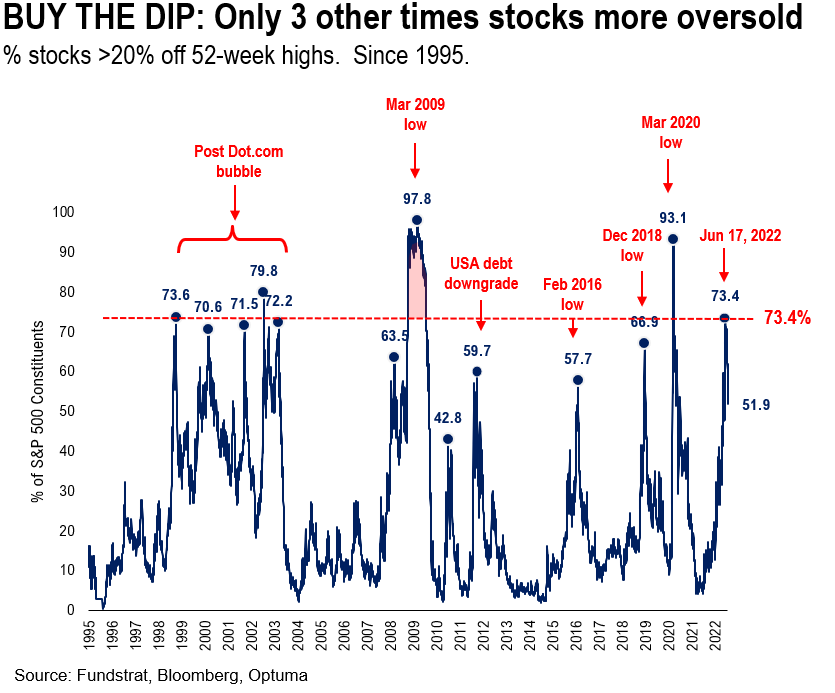
BUY THE DIP REGIME: Stocks already saw fundamental capitulation
And we want to revisit the chart below, which looks at the internals of the S&P 500 — the % stocks >20% off their highs, aka % stocks in a bear market.
- this figure surged to 73% on 6/17
- this was only exceeded 3 times in the past 30 years
- each of the 3 prior instances was the market bottom
- we think this is the 4th instance
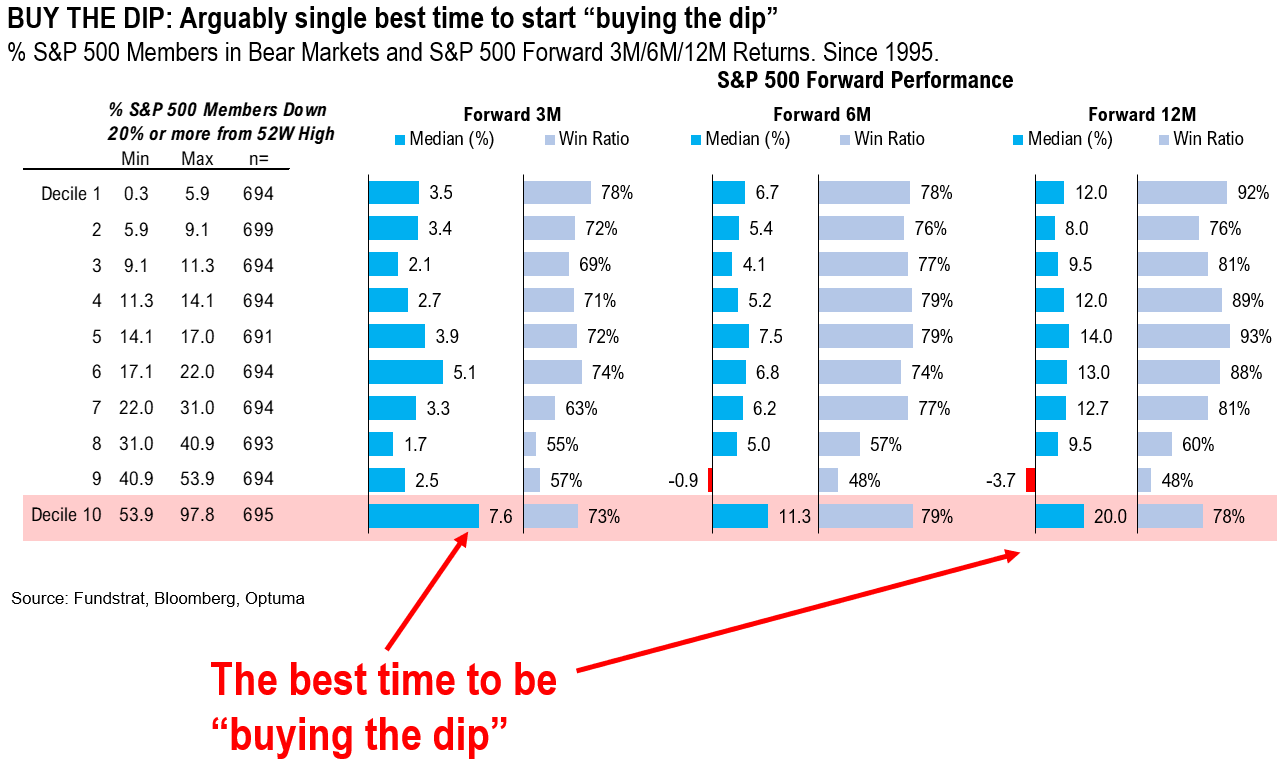
BUY THE DIP: forward returns strong
And stocks have the best forward returns when this figure exceeds 54% as shown below:
- in 3M, 6M and 12M
- the best decile for returns
- is when this figure is oversold >54%
- hence, buy the dip regime is in force
_____________________________
33 Granny Shot Ideas: We performed our quarterly rebalance on 7/12. Full stock list here –> Click here
______________________________
More from the author
Articles Read 1/2
🎁 Unlock 1 extra article by joining our Community!
Stay up to date with the latest articles. You’ll even get special recommendations weekly.
Already have an account? Sign In 2fdc9f-be8857-1bc978-4a6c4c-cb6485
Already have an account? Sign In 2fdc9f-be8857-1bc978-4a6c4c-cb6485

