

Multiple "less bad = good" things this week. With S&P 500 touching 50D, this is possibly the week that we start to see "less bad is good"

Click HERE to access the FSInsight COVID-19 Daily Chartbook.
We are shifting to a 4-day a week publication schedule:
Monday
Tuesday
Wednesday
SKIP THURSDAY
Friday
STRATEGY: Multiple “less bad = good” things this week. With S&P 500 touching 50D, this is possibly the week that we start to see “less bad is good”
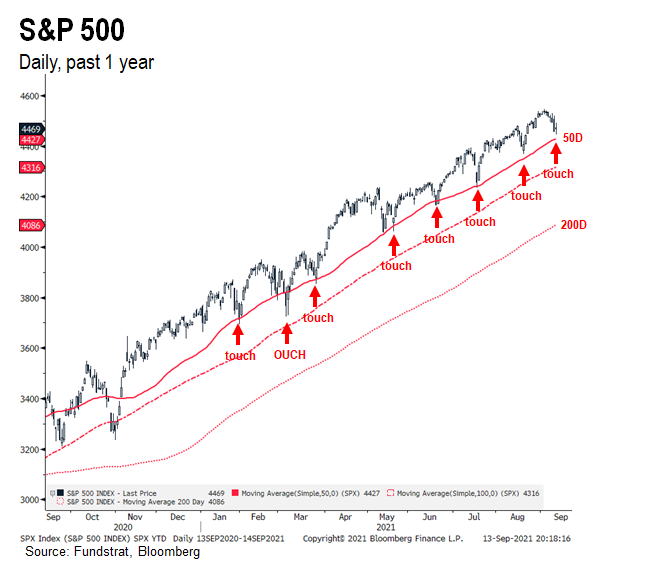
S&P 500 “touched” 50D –> good level for rally
I want to start this commentary by focusing on what I see as an important development today:
– the S&P 500 made a “lower low” midday but closed higher
– this lower low 4,445 nearly touched the 50D moving average (currently 4,427)
– it was <0.4% within touching the 50D
– 6 of the last 7 “touches” of the 50D resulted in a rally
So, we are at a turning point. If the general structure of the market remains favorable, we are mere points away from a positive turn higher in equities. Of course, if one is in the “market toppy” camp, then the touch of the 50D is not really consequential. We are in the camp that this is a favorable turning point — one where stocks will finally find footing.
Touching 50D moving avg –> Is this the week that we start to see “less bad is good?”
As we commented yesterday, stocks have acted like death recently and this move to touch the 50D is certain emblematic of that. But this is also a constructive set up. After all, by drifting towards the 50D, this also suggests that stocks have started to discount a lot of bad news:
– it is here that “less bad = good” becomes actionable
– if investors are done position squaring, incremental data can surprise to the upside
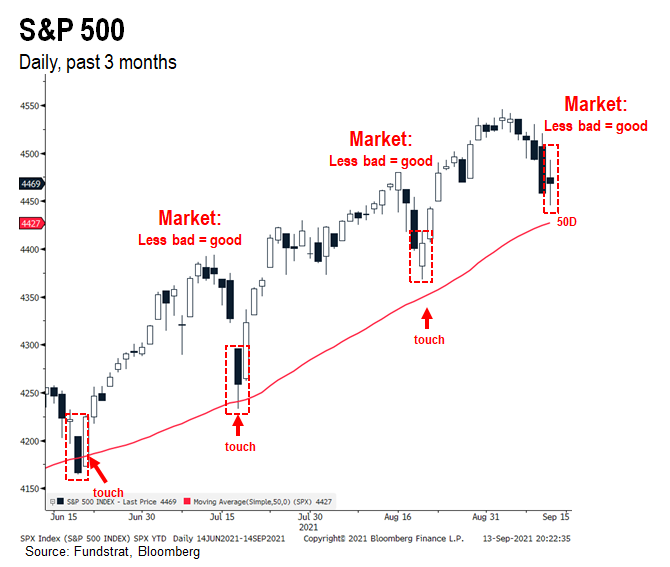
And we see the potential for many things to be viewed as less bad is good. Here is just a few examples:
– COVID-19 Delta wave receding
– Oil showing resilience
– Washington tax plan is less bad than feared
– Brazil is getting a reduced warning level from CDC
– later in the week, economic data could come in soft but less bad, ie, Consumer Confidence
So, there are a few things that could be viewed as less bad is good.
Washington unveils tax proposal –> better than expected –> Less bad = good
On Monday morning, the US House of Representatives unveiled their tax plan which will be used in part to fund the $3.5 Trillion infrastructure package. The document below, the link shared by Tom Block, is titled “Responsibly Funding Our Priorities”

The process from this proposal to a final bill has many steps and this tax plan will be evaluated and assembled by the House Ways and Means Committee. Meaning, just don’t take this plan at face value. As Tom Block, Fundstrat’s Policy Strategist, has commented recently:
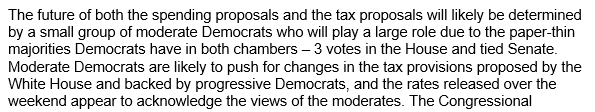
In other words, he is saying that any bill/proposal needs to work for moderate Democrats, as opposed to the progressive agenda of the Dems and potentially the White House. This is actually a positive on balance — why?
– it is possible that investors, last week, were concerned about this coming tax proposal
– the fact that it is more moderate is a positive surprise
– and as Tom Luddy, Vice Chairman of JPMorgan Asset Management, says “less bad is good”
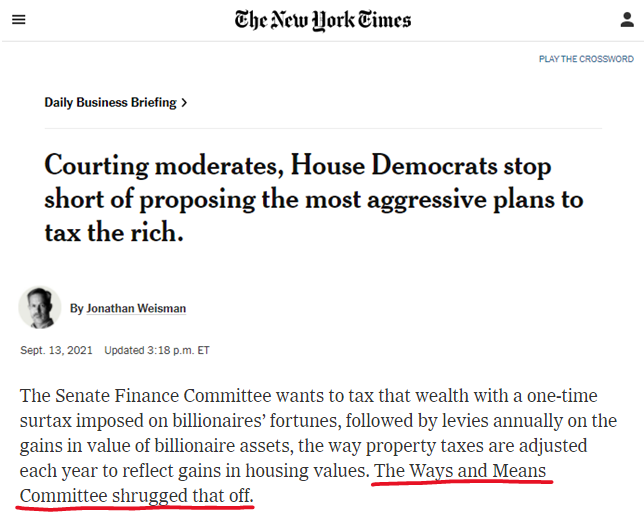
In fact, it looks indeed like this tax proposal is far less onerous than originally feared. The NY Times story below does a good job of summarizing the key provisions:
– top marginal tax rate 39.6% vs 37% now (> $450k married)
– top capital gains rate 25% vs 20% now
– 3% surtax on incomes > $5 million (not clear if it is the amount exceeding $5mm)
– additionally, House Ways and Means Committee is not supporting the “wealth tax” (Sen Warren)
On balance, this is better than feared, particularly as it relates to financial assets. If progressives had their way, capital gains tax rate would have jumped to the same as income tax. And there would have been an additional wealth tax of as much as 1%-3%
– in other words, this revised plan, as it is likely to be passed
– is financial markets friendly
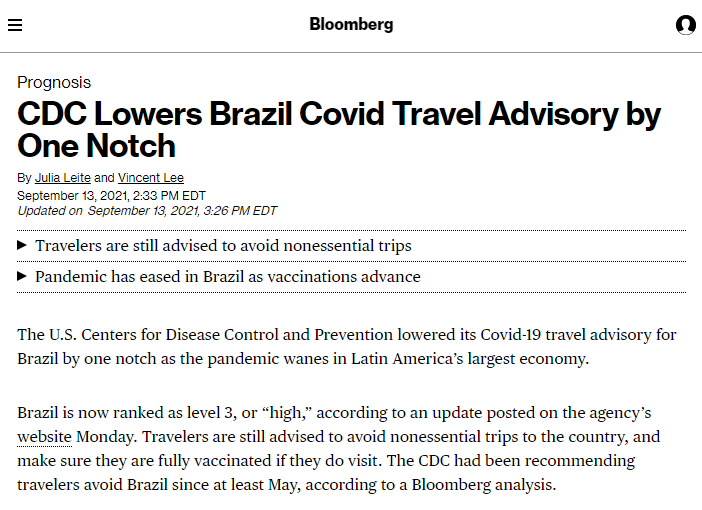
Brazil –> Less bad = Good
In another example of less bad is good, the CDC changed its travel advisory for Brazil. Brazil is now rated as Level 3 (“high”) versus Level 4 previously. There are still many countries ranked Level 4. The list of these nations is on the CDC website –> COVID-19 Travel Recommendations by Destination | CDC
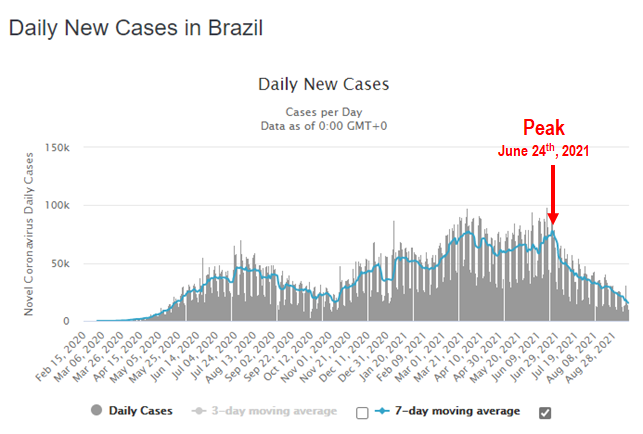
Late? Brazil cases peaked on June 24th, or 2.5 months ago…
But is the CDC a little late with this change? As shown below, Brazil’s 7D moving average of cases peaked on June 24th, 2021.
– June 24th, 7D avg was > 77,000
– Today, 7D avg now 15,900
– Cases down 80% since the peak
– Cases peaked 2.5 months ago on June 24th
So it has been 2.5 months and cases are already down 80%. So we think the advisory level might actually be inappropriate. Wouldn’t Brazil fall into a lower category? Maybe
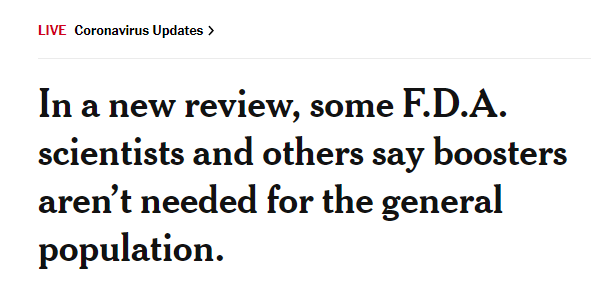
Panel of health experts argue against booster –> but main reason is vaccine is needed elsewhere
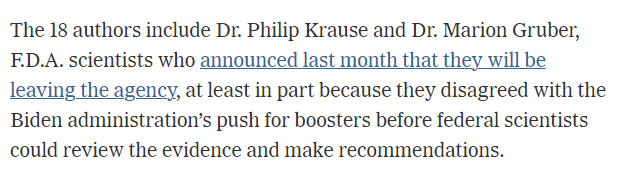
A review by 18 authors, including the WHO and FDA, published in the Lancet, has argued against a booster shot in the US. The rationale is both about:
– the fact that boosters are not clinically yet proven
– the fact that vaccines are needed elsewhere in the world
The problem with that first statement is Pfizer data has shown a tremendous boost in antibodies after the third dose. And scientists in the US have argued the third dose is the real booster. Israel has limited data on the impacts of the booster, but it does seem to be offering protection. And the US has funded and secured significant doses of the vaccine.
Thus, moving towards a booster is a position the US can make due to surplus. It is not clear if this review will have any impact on the White House push towards booster shots.
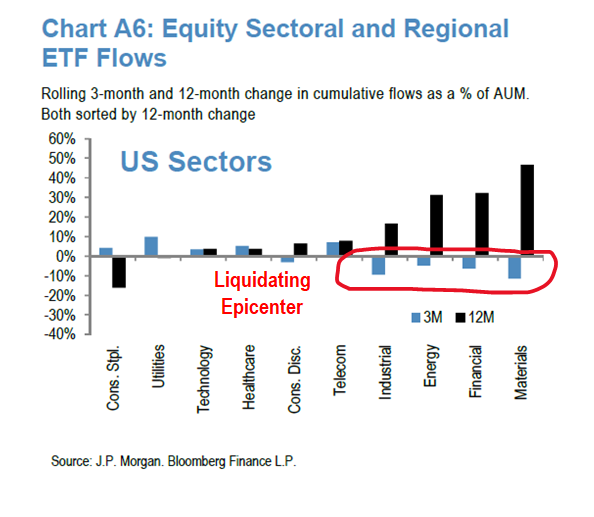
STRATEGY: If market shifts to “less bad is good,” we expect inflows back into Epicenter = rally rationale
JPMorgan’s most recent Flows and Liquidity report had a useful graphic showing sector ETF flows, 3 month and 12 month change. This chart is shown below.
– sustained outflows 3M out of Industrials, Energy, Financials and Materials
– inflows into Consumer Staples and Utilities
– clearly, ETF flows show a market that has become Defensive
And as we noted above, this is coming at a time when S&P 500 has touched its 50-day moving average. So if one is constructive, this is a time to look for a positive inflection. That is our central case.
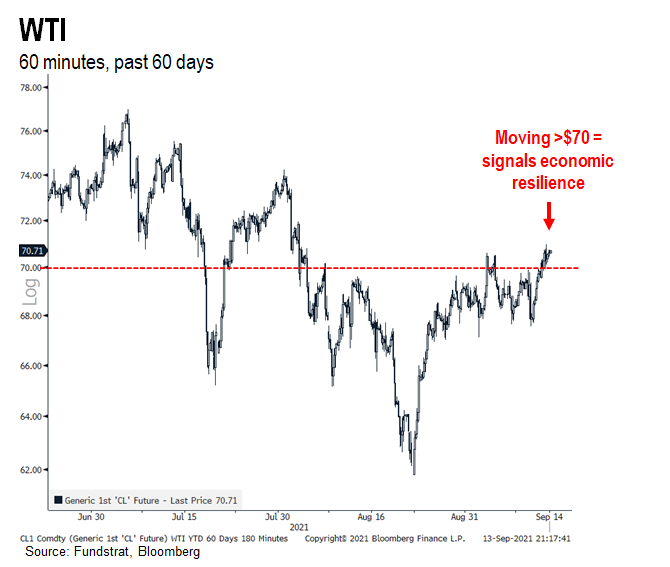
…WTI Oil back > $70 –> Oil is telling us economic resilience greater than consensus
Since the start of the pandemic, Oil has been a good measure of “beta” to GDP sensitivity. Recall:
– during depths of pandemic, oil spot went NEGATIVE
– in late June, WTI reached $77
– in mid-August, WTI sank 20% to $61.50
– WTI has now moved back > $70.
In our view, $70 oil is a level indicating economic resilience is stronger than consensus expects. How can we judge this? Oil equities are still trading like oil is set to fall below $60. That is, the recovery in their share prices has been modest.
– as noted in recent notes, Energy co EPS is directly linked to oil prices
– hence, higher oil = higher EPS
– Energy companies are managing capital better than pre-pandemic
Check out the multiple research reports written by our senior analyst Chris Robb for this perspective. His latest is on Baker-Hughes, BKR1.68% .
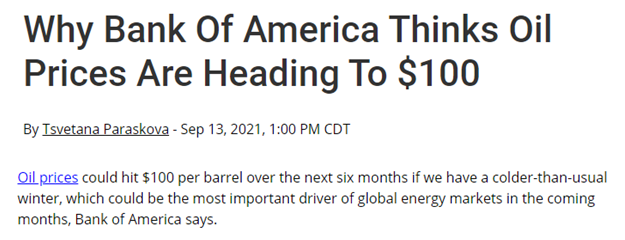
Several commodity strategists see upside to oil into YE… BofA and Goldman Sachs
And oil price is not static. BofA recently commented that they see oil moving past $100 in the next six months. The view is based on a potential cold winter.
And GS has viewed Hurricane Ida as being positive for oil prices as it reduced supply to a greater extent than demand was affected. In other words, the tight supply/demand dynamic for oil remains in place.
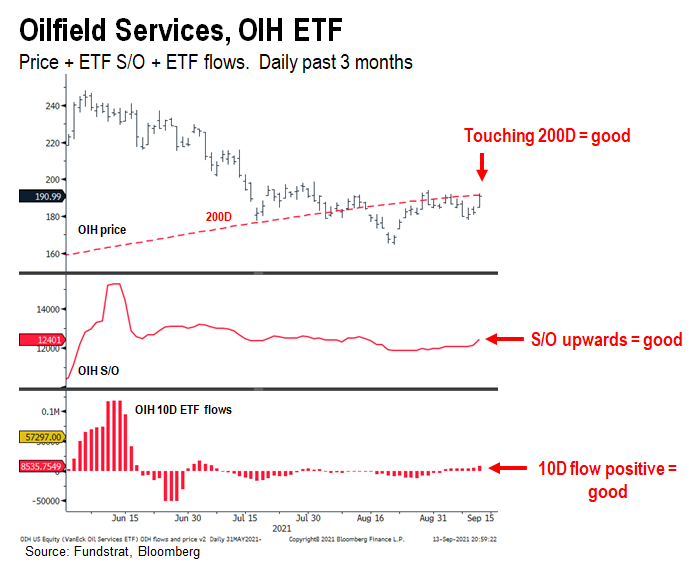
Ultimate beta to oil prices remains OIH0.33%
And as far as ETF with exposure to oil, the Oilfield Services ETF, OIH0.33% is the proxy most sensitive to oil, in our view. OIH peaked in late June at > $240 and has fallen. But we see promising signs of investor inflows:
– OIH has moved above its 200D = good
– OIH shares outstanding is curling upwards = ETF inflows = good
– OIH 10D investor inflows has turned positive = accumulation
So the technical and flows picture for OIH is positive. And this comes as oil has recovered to $70 and potentially could surge to $100. So why are investors so bearish?
__________________________
26 Granny Shot Ideas:
26 Granny Shot Ideas: We performed our quarterly rebalance on 07/30. Full stock list here –> Click here
___________________________
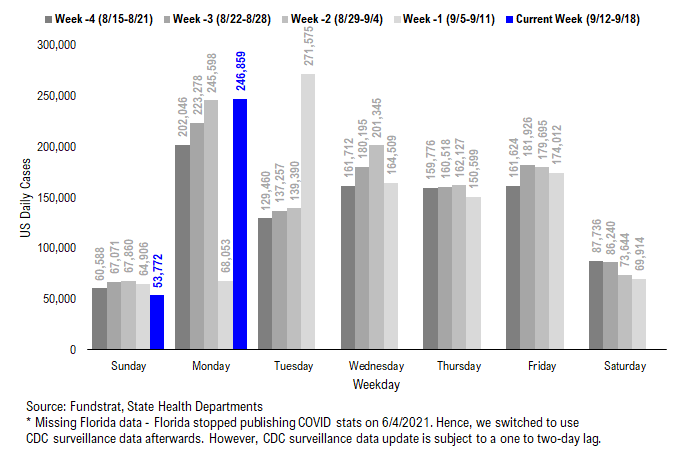
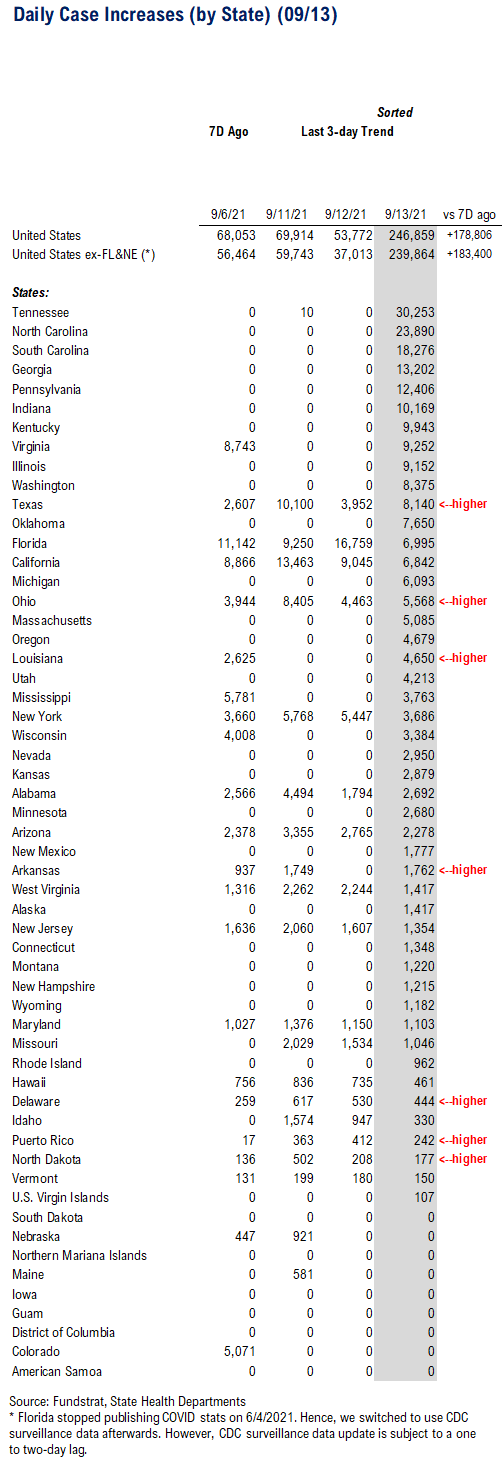
POINT 1: Daily COVID-19 cases 246,859, up +178,806 vs 7D ago…
_____________________________
Current Trends — COVID-19 cases:
– Daily cases 246,859 vs 68,053 7D ago, up +178,806
– Daily cases ex-FL&NE 239,864 vs 56,464 7D ago, up +183,400
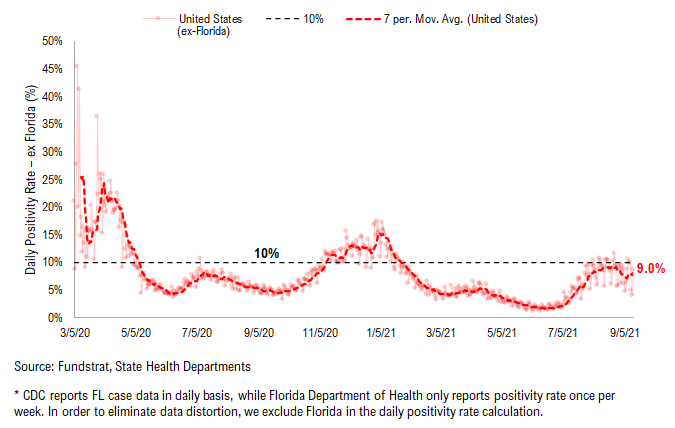
– 7D positivity rate 8.1% vs 7.2% 7D ago
– Hospitalized patients 91,929, down -4.0% vs 7D ago
– Daily deaths 1,794, up +7.5% vs 7D ago
_____________________________
*** Florida and Nebraska stopped publishing daily COVID stats updates on 6/4 and 6/30, respectively. We switched to use CDC surveillance data as the substitute. However, since CDC surveillance data is subject to a one-to-two day lag, we added a “US ex-FL&NE” in our daily cases and 7D delta sections in order to demonstrate a more comparable COVID development.
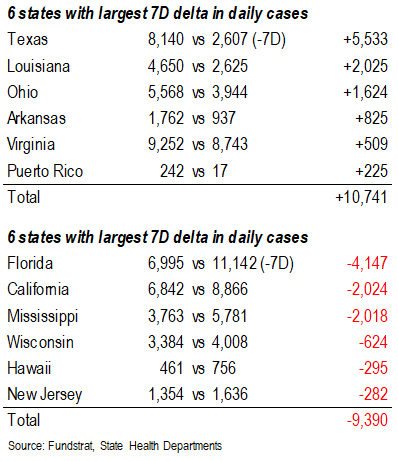
The latest COVID daily cases came in at 246,859, up +178,806 vs 7D ago. Monday’s 7D delta is distorted given last Monday, 7D ago, was Labor Day.
We noted last week that despite the Labor Day distortion the average 7D delta was negative and thus last Monday and Tuesday likely posted negative 7D deltas. The rest of the week also posted negative 7D deltas. Sunday’s negative 7D delta amongst last week’s data suggests that cases are rolling over.
We’ve recently been at the critical stage of case rollover for many states. All states that had been falsely rolling over are once again beginning to roll over. We will continue to monitor all relevant data closely, but as long as 7D deltas remain negative, case rollovers will continue.
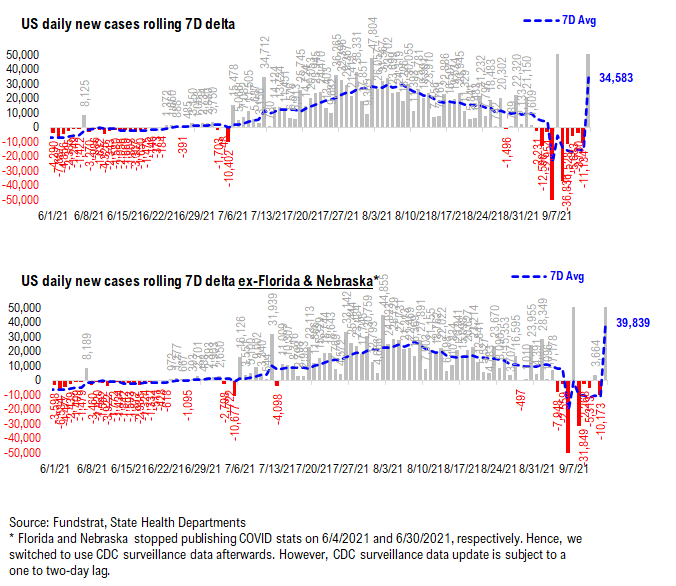
Rolling 7D delta in daily cases is positive due to distortion…
As shown in the chart below, the rolling 7D delta in daily cases is once again positive due to Labor Day distortion. We expect the distortion to clear out quickly and turn negative once again.
Sunday’s negative rolling 7D delta suggests that cases appear to be rolling over despite Monday’s distortion. We will continue to monitor all relevant data closely, but as long as 7D deltas remain negative, case rollovers will continue.
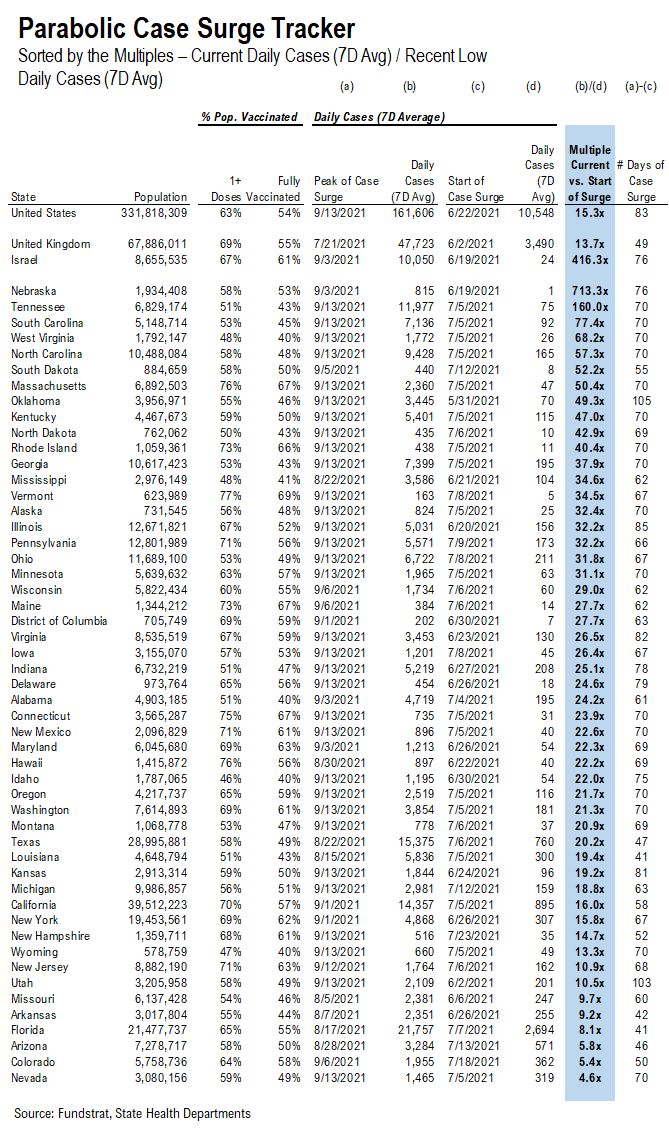
Low vaccinated states seem to have a larger increase in daily cases compared to their recent low…
The “Parabolic Case Surge Tracker” monitors the possible parabolic surge in daily case figures. In the table, we included both the vaccine penetration and the recent case trend for 50 US states + DC. The table is sorted by the multiple of their recent peak daily cases divided by the daily cases when their case surges started.
– The states with higher ranks are the states that have seen a more significant rise in daily cases
– We also calculated the number of days during the recent case surge; a state with a high multiple but low number of days since its low means the state is facing a relatively rapid surge in daily cases
– The US as a whole, UK, and Israel are also shown at the top as a reference
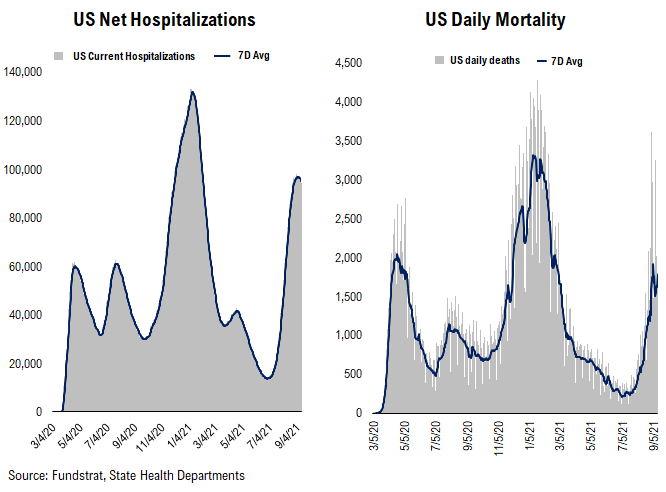
Hospitalization continues rising, while positivity rate has plateaued… Daily deaths also start to surge now…
Below we show the aggregate number of patients hospitalized due to COVID, daily mortality associated with COVID, and the daily positivity rate for COVID.
– Hospitalization has exceeded the peak level we’ve seen in Wave 1 and 2 in 2020 and continues surging.
– With the increasing number of daily tests, positivity rate has plateaued over the past week. As daily cases have already started to roll over in some states, the positivity rate could roll over soon.
– Daily deaths have been surging recently, but less “dramatic” than the cases or hospitalization trends. Currently, daily death has surpassed the peak we have seen in Wave 2.
POINT 2: VACCINE: vaccination pace has been steadily rising…
_____________________________
Current Trends — Vaccinations:
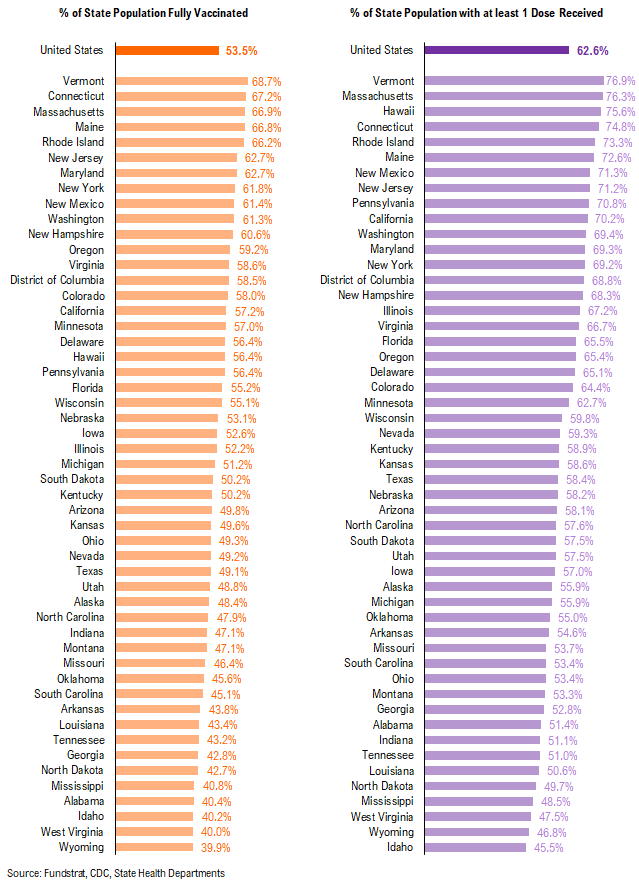
– avg 0.8 million this past week vs 0.8 million last week
– overall, 53.5% fully vaccinated, 62.6% 1-dose+ received
_____________________________
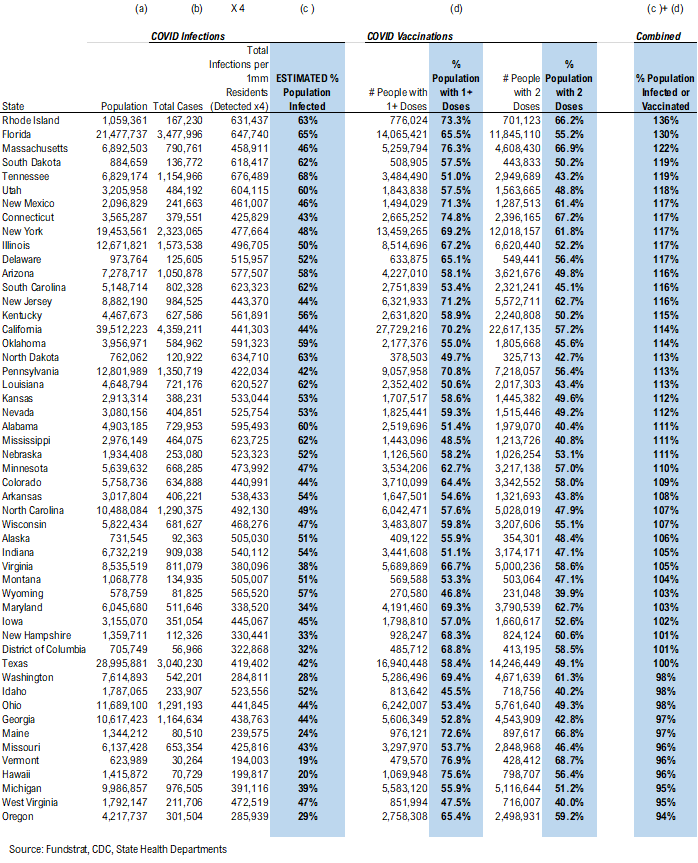
Vaccination frontier update –> all states now near or above 90% combined penetration (vaccines + infections)
Below we sorted the states by the combined penetration (vaccinations + infections). The assumption is that a state with higher combined penetration is likely to be closer to herd immunity, and therefore, less likely to see a parabolic surge in daily cases and deaths. Please note that this “combined penetration” metric can be over 100%, as infected people could also be vaccinated (actually recommended by CDC).
– Currently, all states are near or above 90% combined penetration
– RI, MA, FL, CT, SD, NJ, IL, NY, DE, NM, UT, PA, ND, NV, KY, ND, CO, KS, TN, OK, WI, SC, AZ, MN, CA, NE, LA, DC, MT, AK, MD, ID, VI, AR, AL, MS, and NC are now above 100% combined penetration (vaccines + infections). Again, this metric can be over 100%, as infected people could also be vaccinated. But 100% combined penetration does not mean that the entire population within each state is either infected or vaccinated.
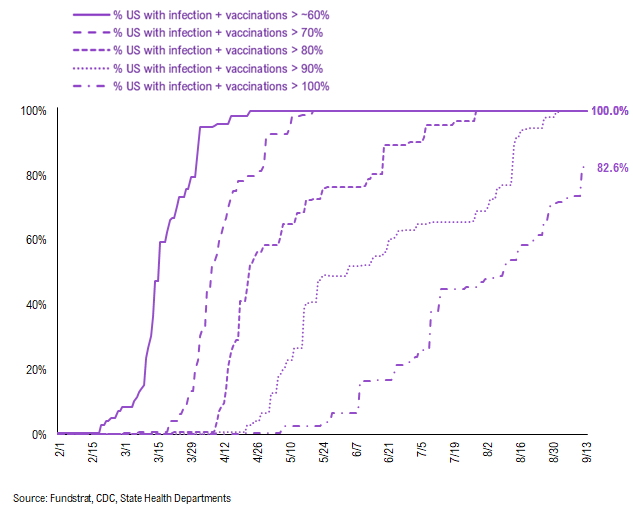
Below is a diffusion chart that shows the % of US states (based on state population) that have reached the combined penetration > 60%/70%/80%/90%/100%. As you can see, all states have reached 90% combined vaccination + infection. 82.6% of US states (based on state population) have seen combined infection & vaccination > 100% (Reminder: this metric can be over 100%, as infected people could also be vaccinated. But 100% combined penetration does not mean that the entire population within the state is either infected or vaccinated).
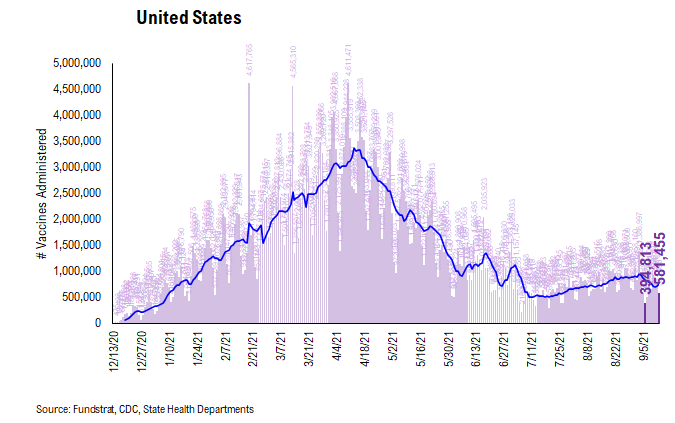
There were a total of 581,455 doses administered reported on Monday, up 47% vs. 7D ago. Despite last week’s negative vaccination trend, the trend appears to once again be positive. We believe many catalysts could push the vaccination pace even higher.
– Proof of vaccination required by many US cities and venues
– Booster shots
– Full FDA approval of Pfizer COVID vaccines (hopefully it could help overcome vaccine hesitancy)
– Biden’s vaccination plan
The daily number of vaccines administered remains the most important metric to track this progress and we will be closely watching the relevant data.
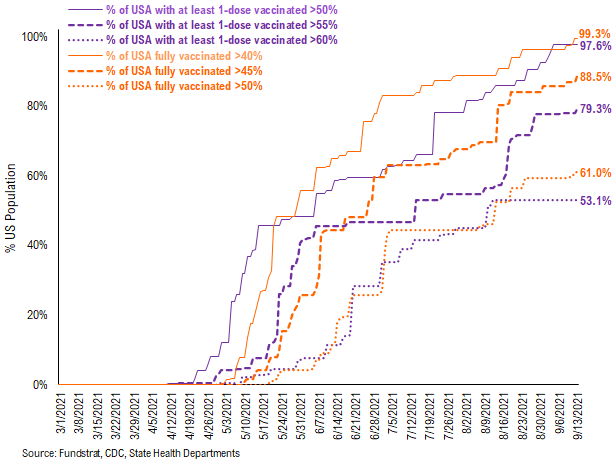
53.1% of the US has seen 1-dose penetration > 60%…
To better illustrate the actual footprint of the US vaccination effort, we have a time series showing the percent of the US with at least 45%/45%/50% of its residents fully vaccinated, displayed as the orange lines on the chart. Currently, 99.3% of US states have seen 40% of their residents fully vaccinated. However, when looking at the percentage of the US with at least 45% of its residents fully vaccinated, this figure is 88.5%. And only 61.0% of US (by state population) have seen 50% of its residents fully vaccinated.
We have done similarly for residents with at least 1-dose of the vaccination, denoted by the purple lines on the chart. While 97.6% of US states have seen 1 dose penetration > 50%, 79.3% of them have seen 1 dose penetration > 55% and 53.1% of them have seen 1 dose penetration > 60%.
This is the state by state data below, showing information for individuals with one dose and two doses.
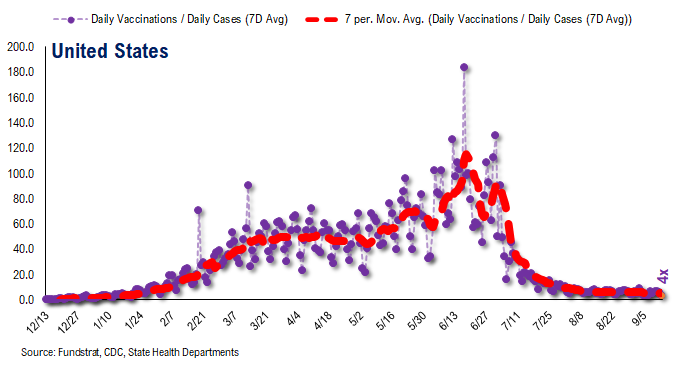
The ratio of vaccinations/ daily confirmed cases has been falling significantly (red line is 7D moving avg). Both the surge in daily cases and decrease in daily vaccines administered contributed to this.
– the 7D moving average is about ~4 for the past few days
– this means 6 vaccines dosed for every 1 confirmed case
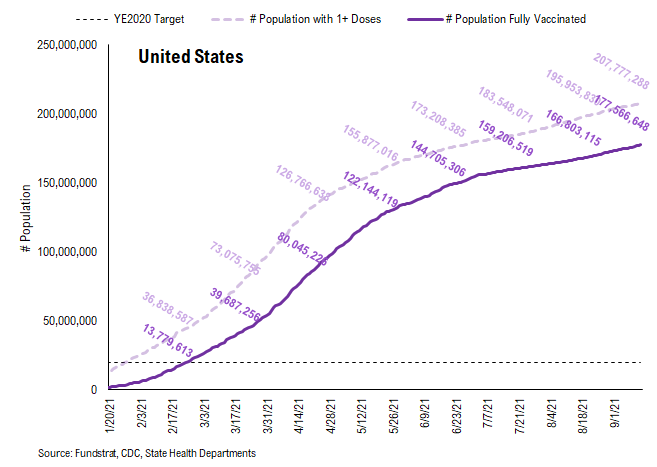
In total, 386 million vaccine doses have been administered across the country. Specifically, 208 million Americans (63% of US population) have received at least 1 dose of the vaccine. And 178 million Americans (54% of US population) are fully vaccinated.
POINT 3: Tracking the seasonality of COVID-19
In July, we noted that many states experienced similar case surges in 2021 to the ones they experienced in 2020. As such, along with the introduction of the more transmissible Delta variant, seasonality also appears to play an important role in the recent surge in daily cases, hospitalization, and deaths. Therefore, we think there might be a strong argument that COVID-19 is poised to become a seasonal virus.
The possible explanations for the seasonality we observed are:
– Outdoor Temperature: increasing indoor activities in the South vs increasing outdoor activities in the northeast during the Summer
– “Air Conditioning” Season: similar to “outdoor temperature”, more “AC” usage might facilitate the spread of the virus indoors
If this holds true, seasonal analysis suggests that the Delta spike could roll over by following a similar pattern to 2020.
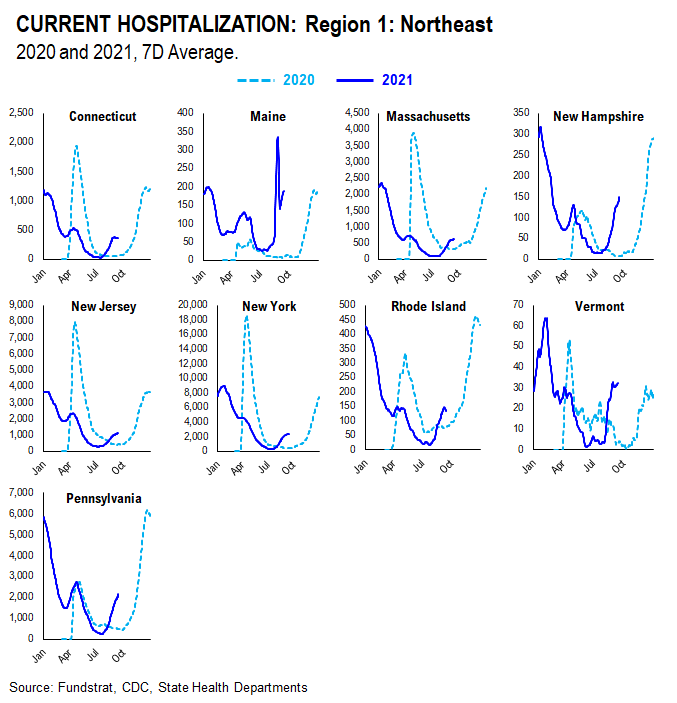
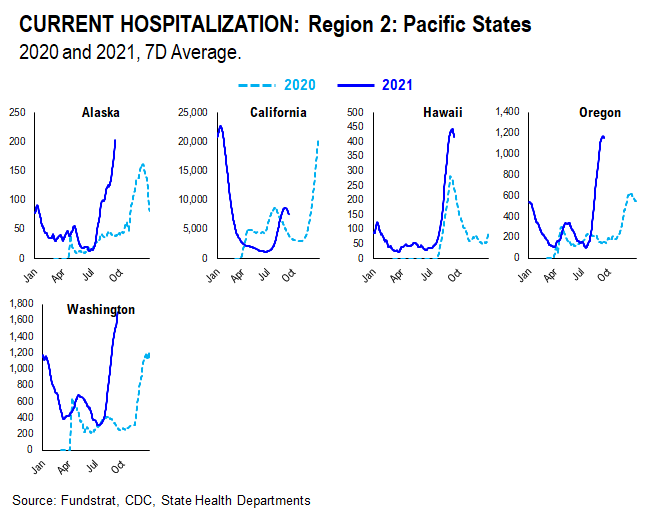
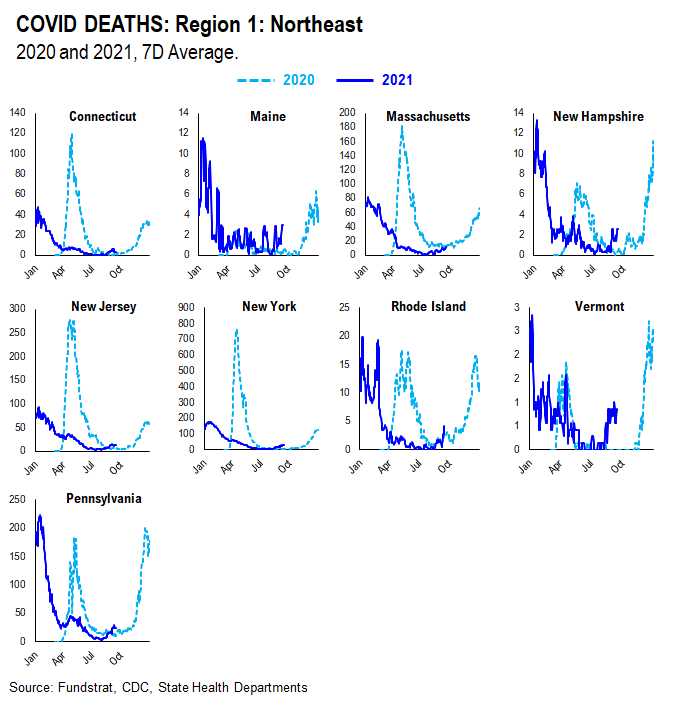
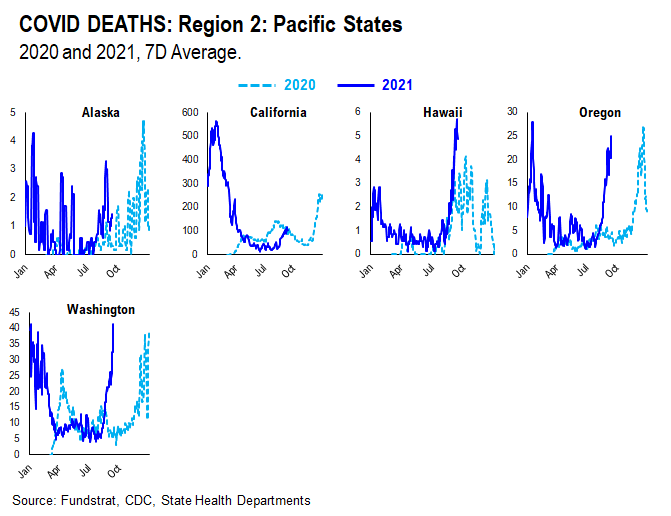
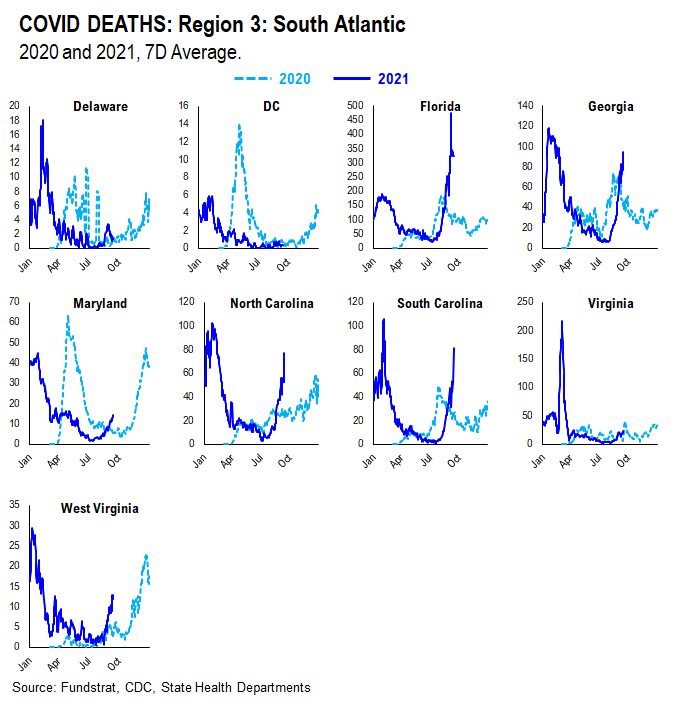
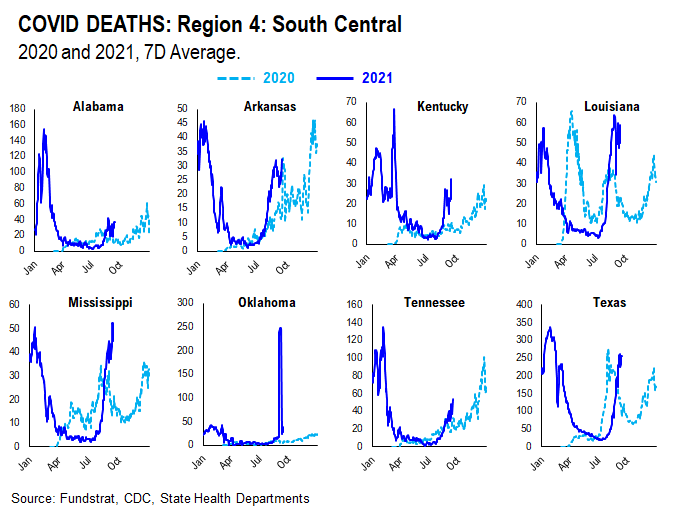
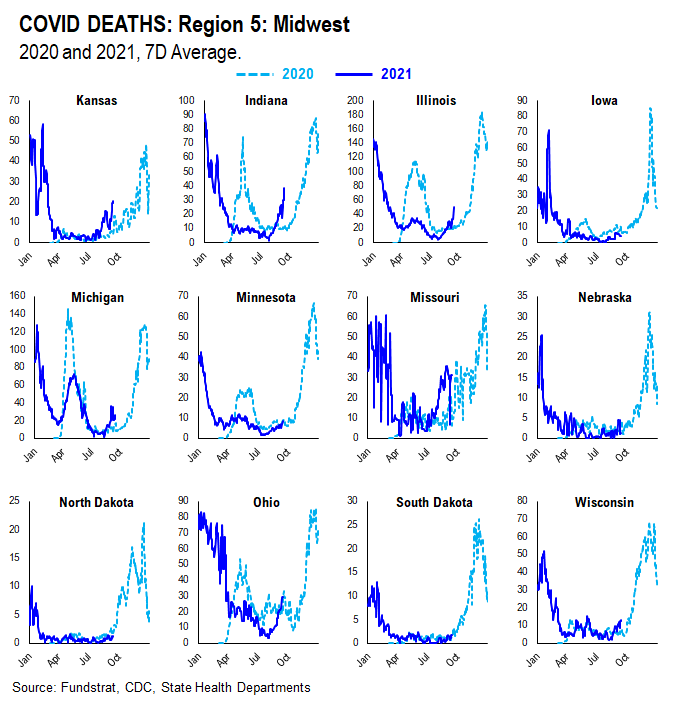
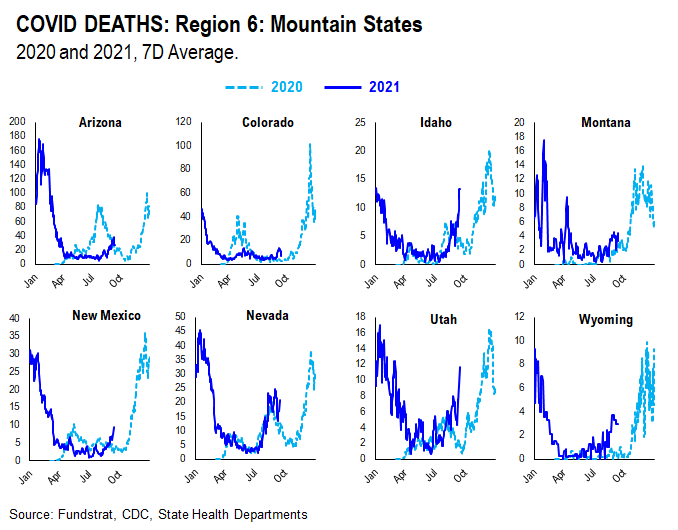
We created this section within our COVID update which tracks and compare the case, hospitalization, and death trends in both 2020 and 2021 at the state level. We grouped states geographically as they tend to trend similarly.
CASES
It seems as if the main factor contributing to current case trends right now is outdoor temperature. During the Summer, outdoor activities are generally increased in the northern states as the weather becomes nicer. In southern states, on the other hand, it becomes too hot and indoor activities are increased. As such, northern state cases didn’t spike much during Summer 2020 while southern state cases did. Currently, northern state cases are showing a slight spike, especially when compared to Summer 2020. This could be attributed to the introduction of the more transmissible Delta variant and the lifting of restrictions combined with pent up demand for indoor activities.
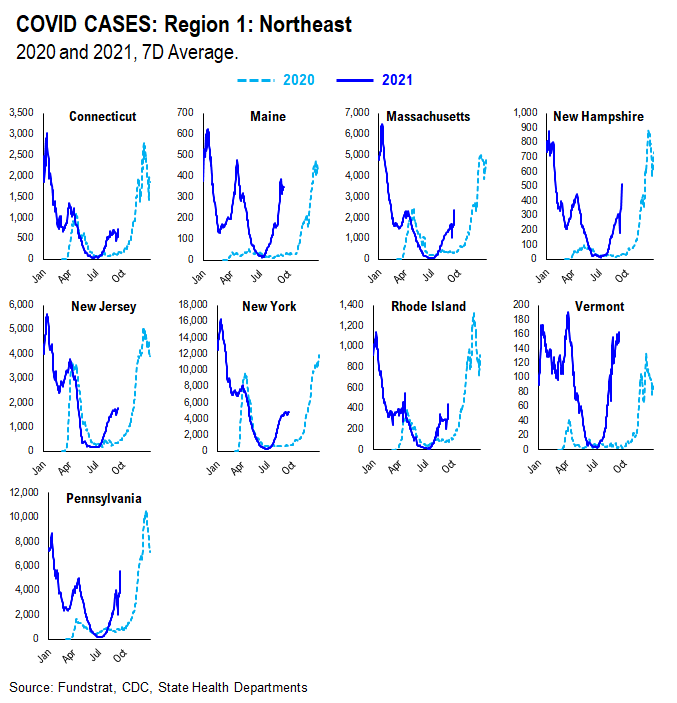
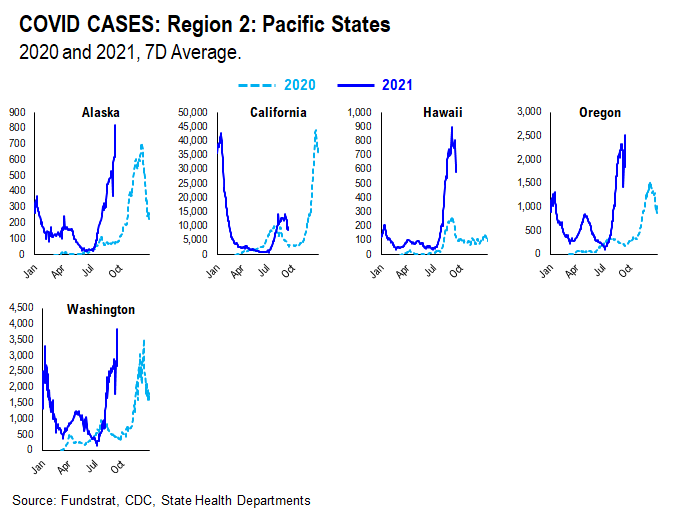
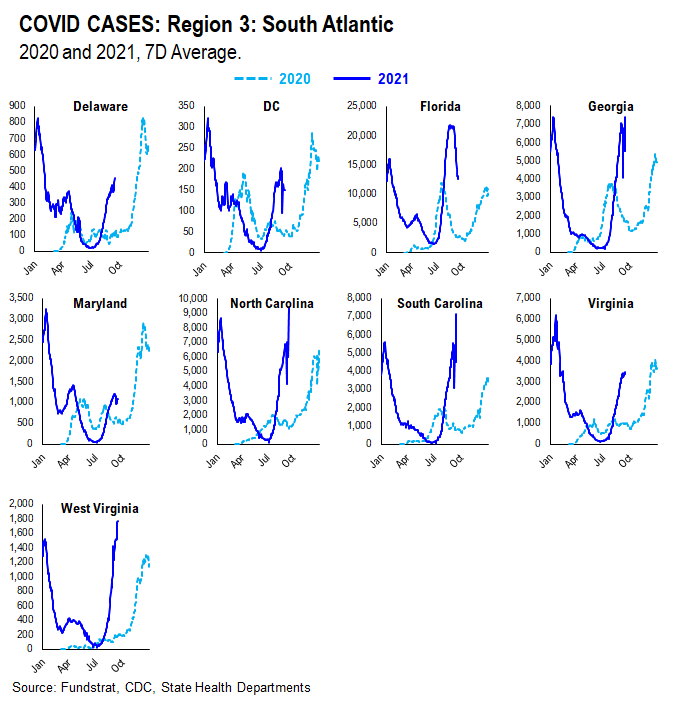
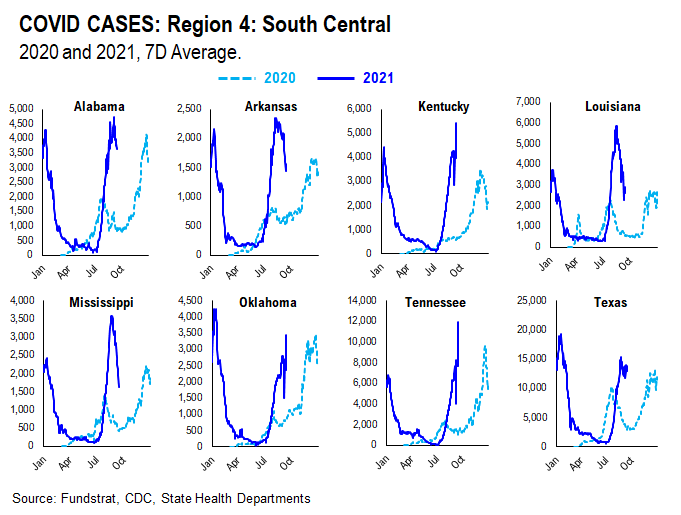
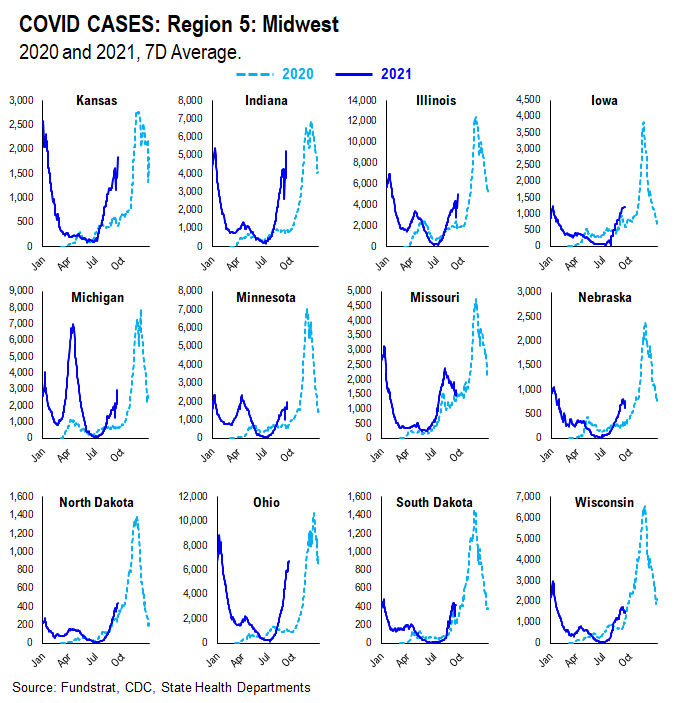
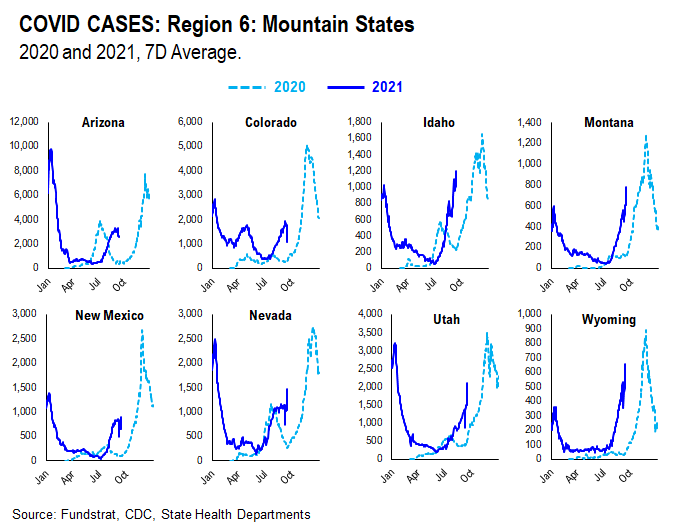
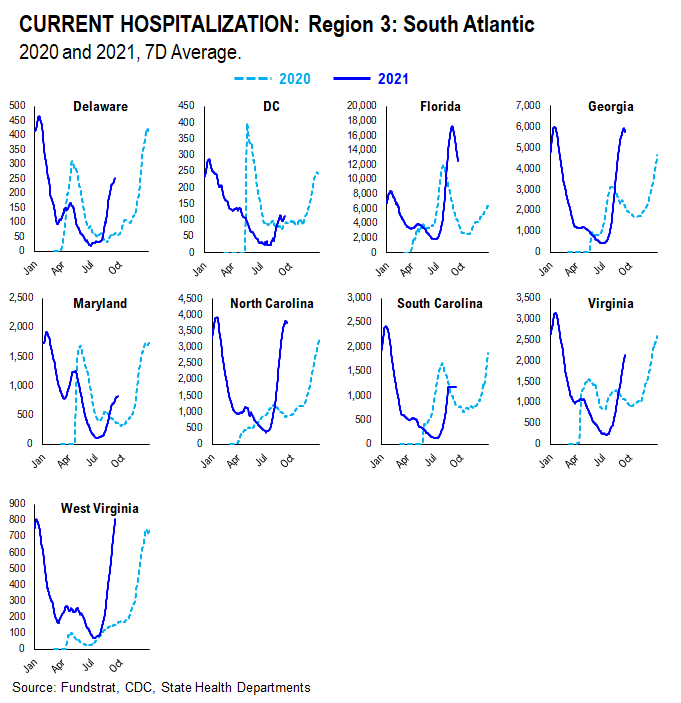
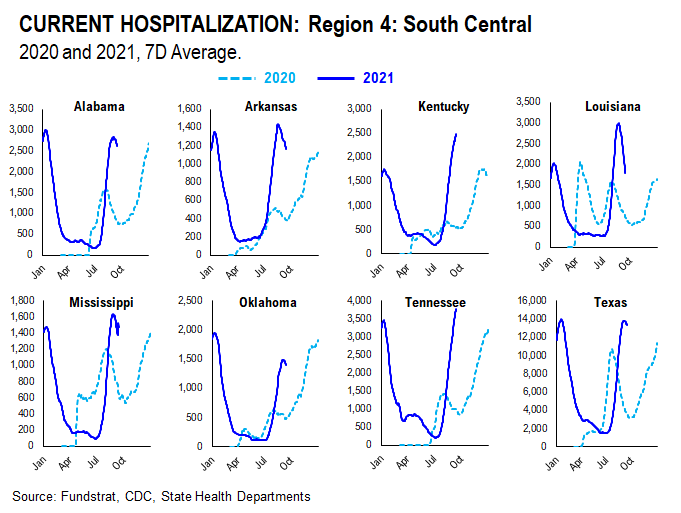
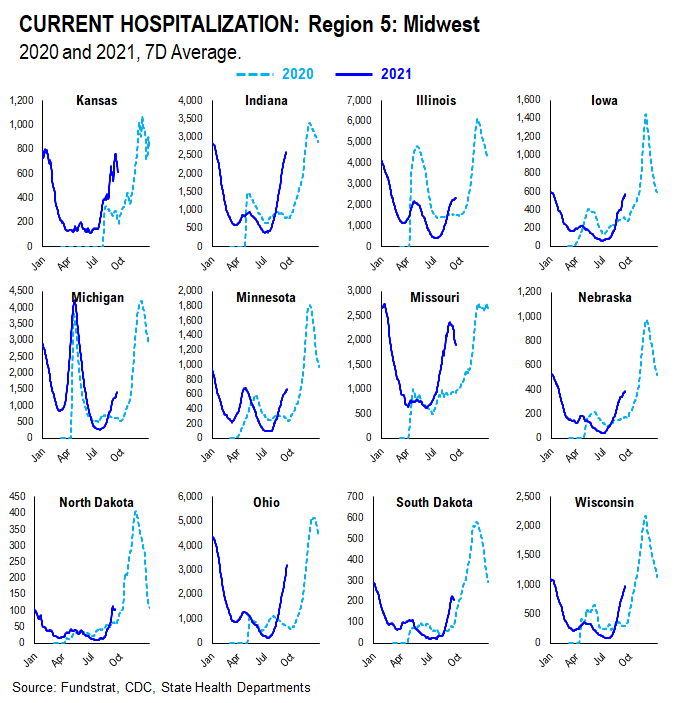
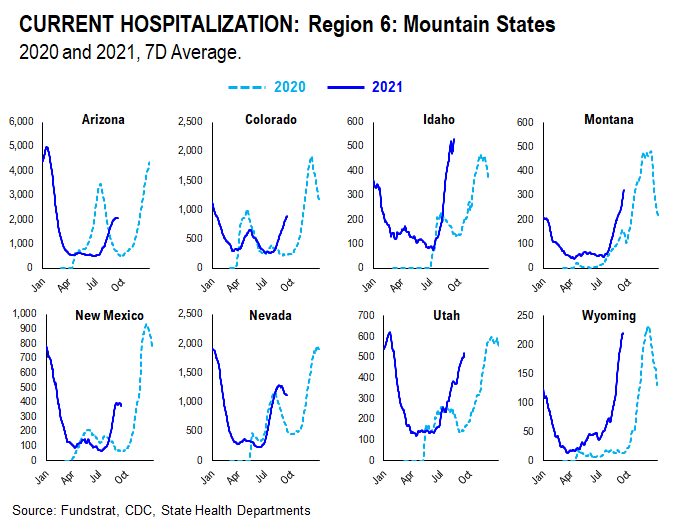
HOSPITALIZATION
Current hospitalizations appear to be similar or less than Summer 2020 rates in most states. This is likely due to increased vaccination rates and the vaccine’s ability to reduce the severity of the virus.
DEATHS
Current death rates appear to be scattered compared to 2020 rates. This is likely due to varying vaccination rates in each state. States with higher vaccination rates seem to have lower death rates given the vaccine’s ability to reduce the severity of the virus; states with lower vaccination rates seem to have higher death rates.
More from the author
Articles Read 1/2
🎁 Unlock 1 extra article by joining our Community!
Stay up to date with the latest articles. You’ll even get special recommendations weekly.
Already have an account? Sign In 58f9df-006b67-32a9b7-292fe8-d25d7d
Already have an account? Sign In 58f9df-006b67-32a9b7-292fe8-d25d7d

