
Granny Shots
Stock List

Granny Shots
Stock List

GRANNY SHOTS: Oct 2023 rebalance +7 adds/-6 deletes. Plus, October Super and Sleeper Grannies. 2023 YTD +19.3% (+543bp vs S&P 500).

On Wednesday, 10/18 , we update the top 5 “Super Grannies” and bottom 5 “Sleeper Grannies.“
If you have not yet registered, sign up with the webinar block below.

________________________________________________
Today’s note will include a short video update. We discuss: The October 2023 rebalance of Granny Shots is today. Tune into the webinar as we discuss the revised Granny Shots list and the top 5 (Super Grannies) and bottom 5 (Sleeper Grannies). YTD Granny Shots is up +19.3%, outperforming by +543bp. (Duration: 3:49).

___________________________________
- Granny Shots October Quarterly rebalance today
- Updating 5 Super and 5 Sleeper Grannies
- See below for adds and deletes
Slide deck now available: to view the slide deck for this month’s granny shots update, please click here.
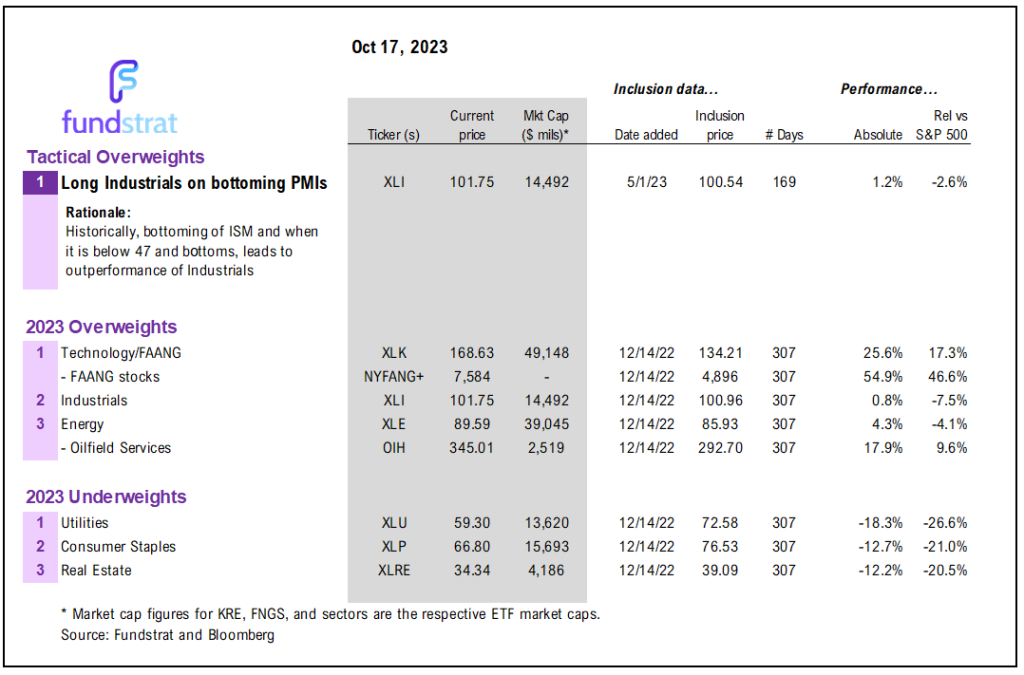
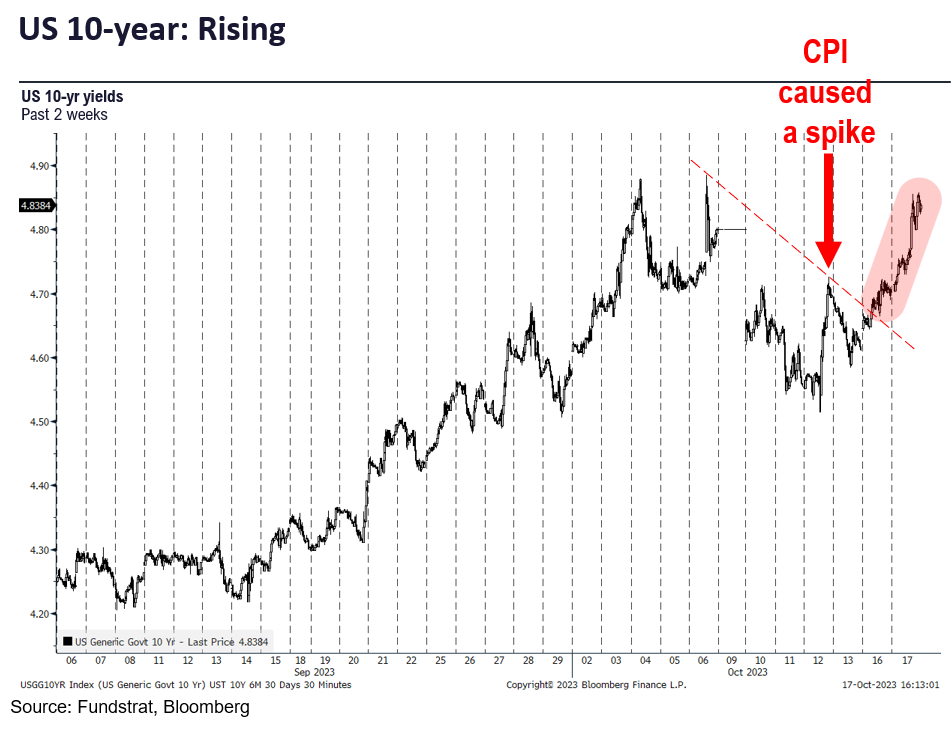
MACRO: Bias is for a rise into YE
Equities closed flat on Tuesday. US 10-year yields are pushing higher and at 4.8362% is near touching the prior high of 4.8852% (mere 5bp). In the past 3 days, US 10-yr yields have surged but equities have managed to gain 1%. So, the correlation between rising yields and falling stocks seems momentarily disconnected:
- In the short term, it is not entirely clear to me that this will be a stable dynamic. Rates rising and stocks rising is counterintuitive short-term, although as we have written previously, long-term, the highest P/Es are seen with UST 10Y between 3.5% to 5.5%.
- There are several reasons stocks could be rising despite higher yields and these are:
– UST is a “hot potato” given Washington and Fed “higher for longer” but this is not necessarily negative equities
– Stronger GDP growth is reflationary growth and thus would pressure rates higher and EPS higher
– This simply shows how “short” the equity market positioning is compared to bonds - More importantly, Mark Newton, Head of Technical Strategy, believes we are nearing the peaks for US yields. Thus, this latest rise may be a technical “last gasp” and this is what equities are seeing.
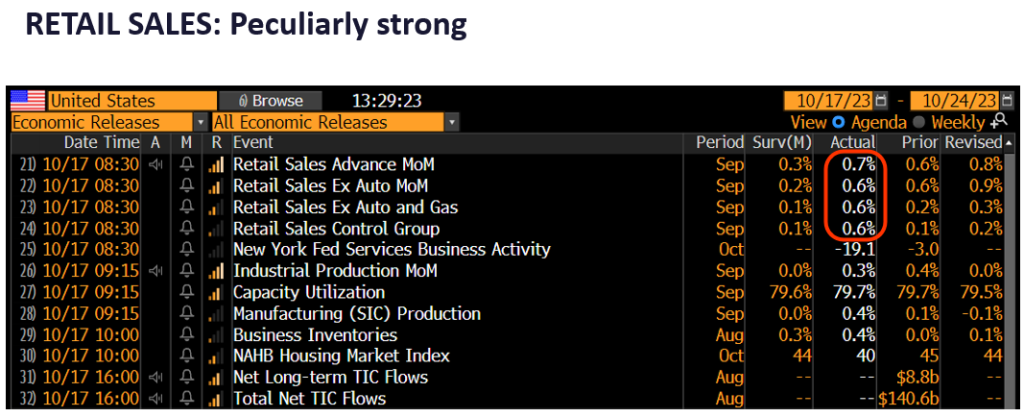
- As for macro data, incoming retail sales were peculiarly strong. I am not sure what this signals. But the constellation of other data does not support this strengthening.
- Manheim Used Vehicle Index Mid-Oct was updated and it shows prices fell -1.6% in the first 2 weeks of Oct. That is a staggering -38% decline. Used car prices are falling like a rock. And recall, vehicles are second largest weight in CPI after housing. Thus, this is a good future CPI signal.
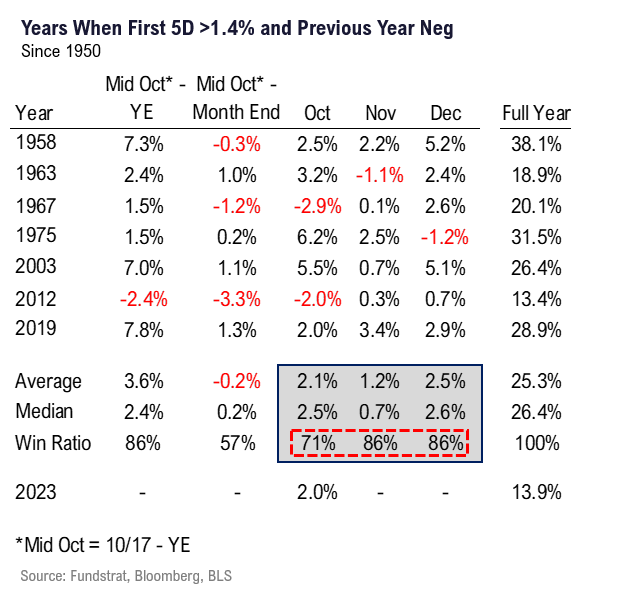
- Lastly, keep in mind seasonals remain favorable. Recall, our “rule of 1st 5 days” – looking at the 7 prior instances where S&P 500 was up >1.4% and negative prior year:
– Oct avg gain +2.1% 71% win-ratio
– Nov avg gain +1.2% 86% win-ratio
– Dec avg gain +2.5% 86% win-ratio - So, the probabilities favor gains into YE starting this month.
GRANNY SHOTS: October 2023 Rebalance
The rest of this note is focused on the quarterly rebalance of Granny Shots, and also the updated list of Super and Sleeper Grannies. We view Granny Shots as a core portfolio of stocks and the portfolio is adjusted to reflect seasonal and structural changes:
- The additions: CAT 0.59% , ODFL -6.95% , TDG 0.20% , EG -0.29% , V -0.46% , HES 0.67% , ORCL 2.01%
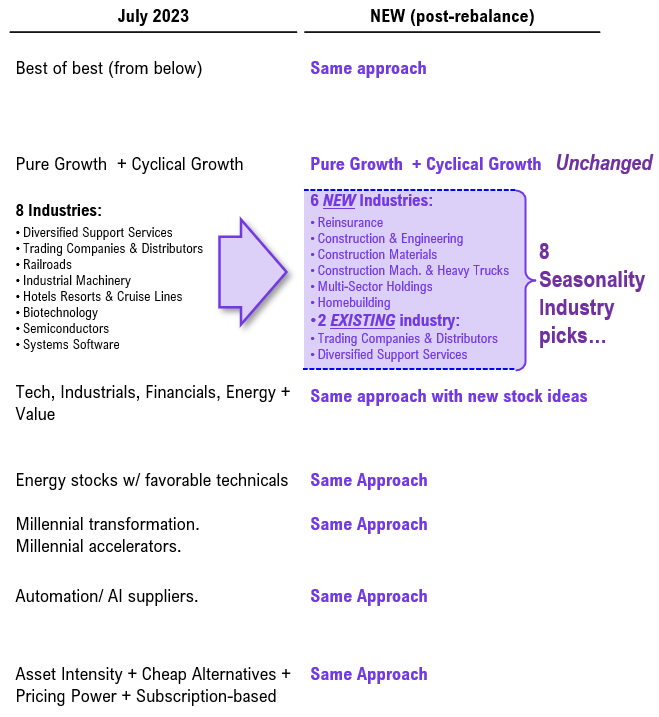
The deletions: DVN 0.19% , UNP, HON 0.22% , NOW 0.73% , FTNT 0.19% , VRTX -0.06% - There are a lot of moving parts in a rebalance and these are both on style changes and seasonally attractive industry groups. We don’t necessarily want to focus on these as stand alone factors, but the industry groups are shown below.
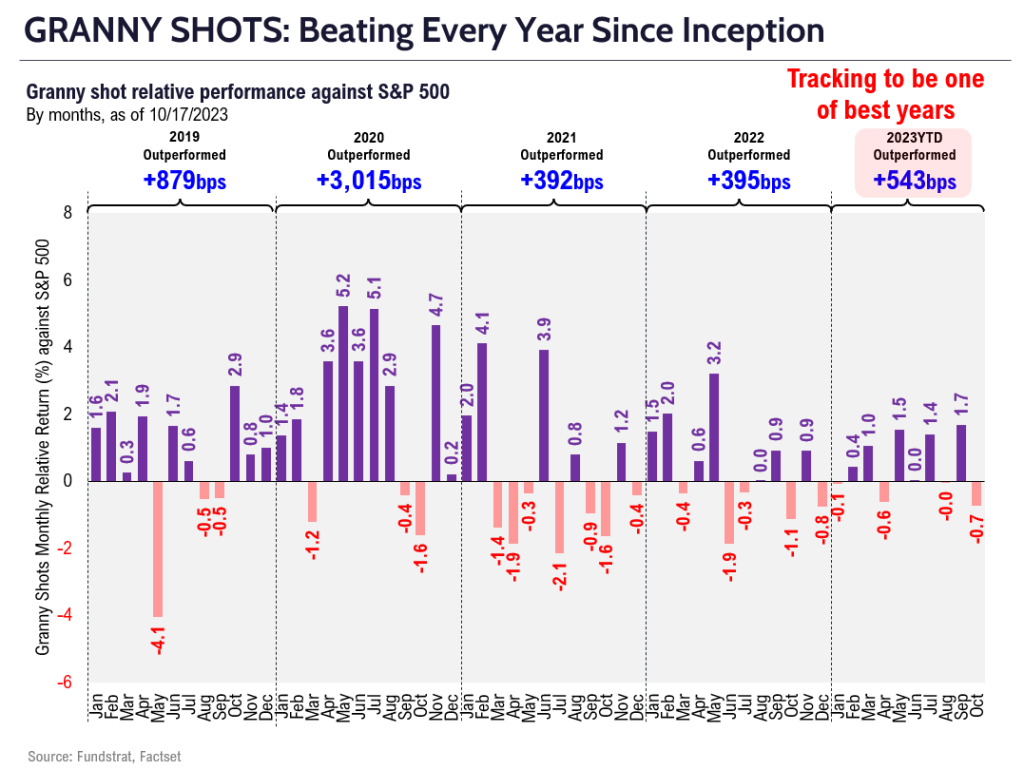
- YTD Granny Shots is up +19.3% (outperforming by +543bp vs S&P 500). This is tracking to be one of the strongest years for Granny Shots. Grannies have outperformed every single year since inception in January 2019.
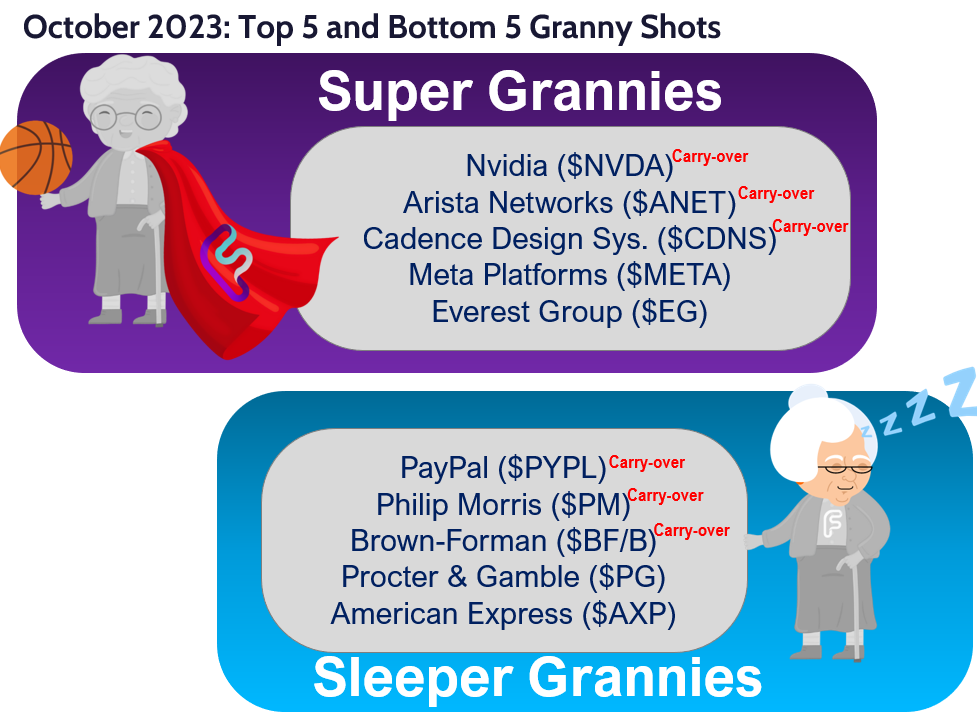
- We know many do not want to buy a 36 stock list. So we have launched Super and Sleeper Grannies:
– Top 5 “most attractive” are Super Grannies
– Bottom 5 “least attractive” are Sleeper Grannies
– we refresh these lists the third Wed of every month - Top 5 tactical buys aka “Super Grannies”
– Nvidia (NVDA 6.25% ) <–carry over from September
– Arista Networks (ANET -0.02% ) <–carry over from September
– Cadence Design Systems (CDNS 1.92% ) <–carry over from September
– Meta Platforms (META 0.27% )
– Everest Group (EG -0.29% ) - Bottom 5 “Sleeper Grannies” are:
– Paypal (PYPL 3.00% ) <–carry over from September
– Philip Morris International (PM -1.11% ) <–carry over from September
– Brown-Forman (BF/B) <–carry over from September
– Proctor & Gamble (PG -0.78% )
– American Express (AXP -0.62% )
___________________________________
REBALANCE GRANNY SHOTS: +7 adds, (-6 deletes). YTD outperformance +543bp
Today is the October quarterly rebalance of our Granny Shots portfolio.
7 rebalance additions are:
- Caterpillar Inc (CAT 0.59% )
- Old Dominion Freight Line Inc (ODFL -6.95% )
- Transdigm Inc (TDG 0.20% )
- Everest Group Ltd (EG -0.29% )
- Visa Inc (V -0.46% )
- Hess Corp (HES 0.67% )
- Oracle Corp (ORCL 2.01% )
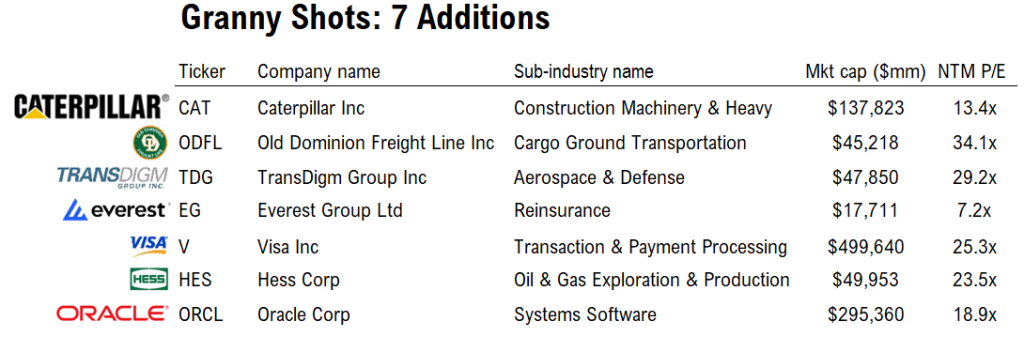
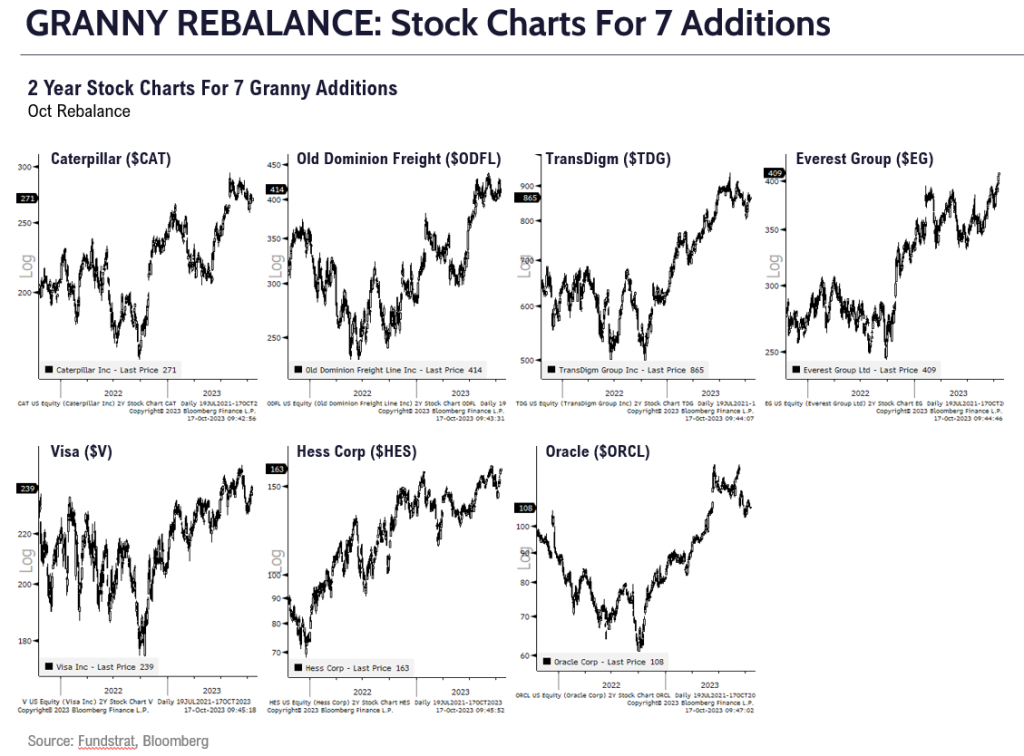
Below are the 2-year stock charts for the 7 additions
6 rebalance deletions are:
- DVN 0.19% , UNP, HON 0.22% , NOW 0.73% , FTNT 0.19% , VRTX -0.06%
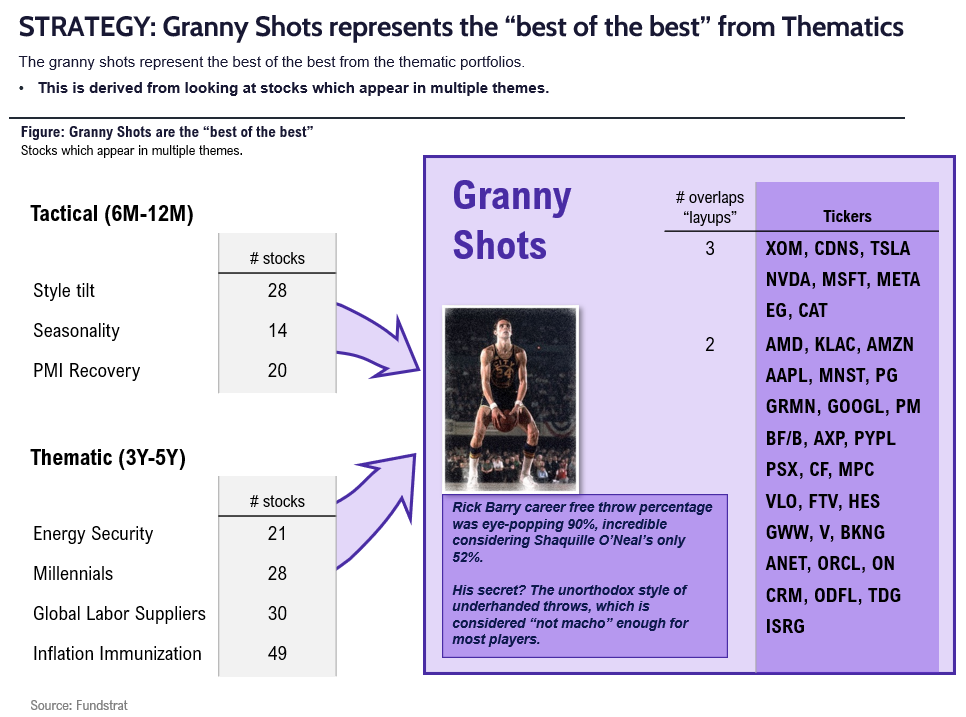
Think about Granny Shots as a “core portfolio” that we rebalance every quarter. The Granny Shots is a list of our core stock holdings, using 7 thematic/quantitative portfolios and is designed to identify long-term EPS growers. Since inception in 2019, Granny Shots has outperformed every year:
- 2019 +879bp –> great year
- 2020 +3,015bp –> great year
- 2021 +392bp –> good year
- 2022 +395bp–> good year
- 2023 +543bp–> great start
SUPER GRANNIES: 5 Super and 5 Sleeper
“Super Grannies” (long) and “Sleeper Grannies” are derived from our core stock list of 36 ideas called “Granny Shots”
- The rationale is many clients ask us to narrow this list of 36 names down to a list of “fresh money” ideas.
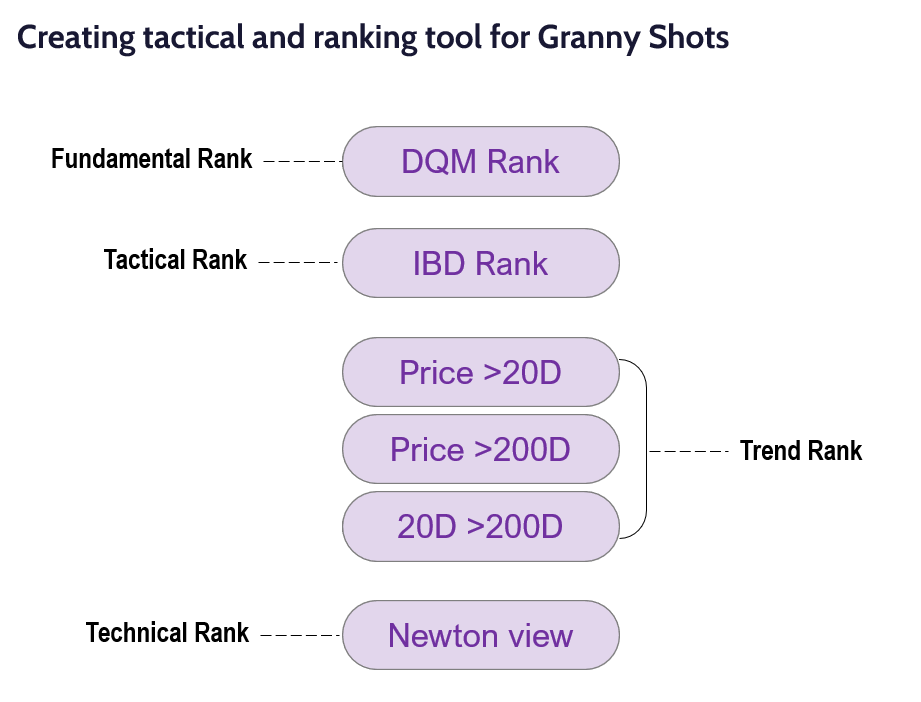
- We established a criteria of 4 factors to narrow the list to tactical buys:
– fundamentals using DQM model managed by “tireless Ken”
– IBD momentum rating
– technical strength measured by Price >20 DMA, 20 DMA vs 200 DMA and combos
– Mark Newton’s judgement on technical outlook
- We have 5 tactical buys aka “Super Grannies”
– Nvidia (NVDA 6.25% ) <–carry over from September
– Arista Networks (ANET -0.02% ) <–carry over from September
– Cadence Design Systems (CDNS 1.92% ) <–carry over from September
– Meta Platforms (META 0.27% )
– Everest Group (EG -0.29% ) - The bottom 5 “Sleeper Grannies” are:
– Paypal (PYPL 3.00% ) <–carry over from September
– Philip Morris International (PM -1.11% ) <–carry over from September
– Brown-Forman (BF/B) <–carry over from September
– Proctor & Gamble (PG -0.78% )
– American Express (AXP -0.62% )
TECHNICALS ON 5 SUPER GRANNY SHOTS: By Mark Newton
Nvidia (NVDA 6.25% ) – NVDA remains within a choppy consolidation pattern as part of a parabolic intermediate-term uptrend from last October’s 2022 lows. Despite the stock having made little progress since June’s month-end close, NVDA is still up over 300% off its lows from last October. While some might view its consolidation since July as bearish, this sideways churning has helped momentum to become less overbought over the last couple months, while not being too detrimental to its long-term trend. Key support lies at September lows near $410. As long as this level holds, NVDA remains bullish and is thought to have an excellent chance of pushing higher back to $500 and then above to $510-$515. At this latter area of resistance, I would consider NVDA a less attractive risk/reward. However, it’s difficult without proof to suggest that NVDA is peaking out, and often these consolidation patterns tend to resolve in the direction of the original rally. Going forward, the inability of NVDA to move back quickly to new highs into November might be a larger problem as this would have a greater impact on intermediate-term momentum. At present, this remains one of the strongest intermediate-term names within Technology, and is right to still consider quite attractive technically speaking.
Arista Networks (ANET -0.02% ) – Arista Networks continues to look quite positive technically following its high-volume consolidation breakout from March 2023. The stock still shows a parabolic trend which has improved steadily in recent months with a trend of higher highs and higher lows. Momentum remains positively sloped on a weekly basis but is still not overbought given the extent of the minor consolidation in recent weeks. ANET is expected to push back up above August highs at $198.709 which should allow for a move up to $225 without much trouble. Only on pullbacks under $165 would ANET violate trendline support for 2023 which would result in weakness down to $148.50. Overall, the stair-stepping nature of ANET’s advance makes this quite attractive technically, and further gains look likely in the weeks ahead back to new all-time highs.
Cadence Design Systems (CDNS 1.92% ) – Cadence Design Systems maintains a bullish uptrend and its trend has improved lately following last week’s push back above July 2023 highs to new all-time high territory. After nearly doubling off last year’s lows, upside technical resistance lies near $275-$280 and could be likely in the months ahead. Similar to ANET, CDNS has shown little to no evidence of any technical weakness, and its trend began to accelerate following the consolidation breakout which happened this past February 2023. Despite its minor consolidation since July, the sideways churning failed to do much damage before this turned back higher to new all-time high territory. Overall, CDNS maintains a bullish intermediate-term uptrend and while overbought on a monthly basis, no evidence of technical deterioration has occurred which would be suggestive of any sort of topping process at work.
Meta Platforms (META 0.27% ) – Meta has grinded sideways since July as part of its stellar ongoing uptrend, and shows an excellent likelihood of continuing back to new 2023 highs in the weeks/months ahead. Weekly closes back above $330 should result in a rally back to challenge 2021 peaks near $384, which would be an area of meaningful resistance, if reached. Despite the minor churning from late July, META has recovered quickly over the last eight weeks to challenge July highs, and I suspect a breakout of $330 happens in the month of October. Weekly and monthly momentum have gotten overbought. Yet, no evidence of META weakening in a way that would suggest its trend should begin to give way. Momentum took its first “shot across the bow” in July 2023. Yet the recovery was smooth enough that the stock got meaningfully back on track with little to no damage. Only on a break under $275 would the trend begin to show more deterioration, and this would be expected to temporarily interrupt the rally and allow for a move to $237. However, at present the odds favor an upcoming breakout back over $330, and it’s right to favor META as a Super Granny, as its technical prospects remain bright.
Everest Group (EG -0.29% ) – Everest Group’s short-term consolidation from February has given way to an upside breakout this week, which bodes well for EG to rally up to $425 and eventual targets near $480. The entire Insurance sector has exhibited superior relative strength over the past year, and EG’s sudden breakout of an eight-month base is a larger positive, than any negative associated with short-term overbought conditions. Unless $368 is broken, it’s right that EG can continue to show strength on an absolute and also relative basis, and pullbacks likely find strong support near $394 before pressing back higher. Short-term negative momentum divergence might limit gains after eight of the last 10 days nave pushed higher. Yet it’s the broader base being exceeded in a pattern that resembles a reverse Head and Shoulders pattern that will result in gains for the weeks to come. DeMark-based monthly exhaustion on the Insurance ETF, KIE -1.56% relative to SPY 0.98% and also XLF -0.15% remains premature to signal any concern, so it looks technically likely that this strength will lead to further upside follow-through.
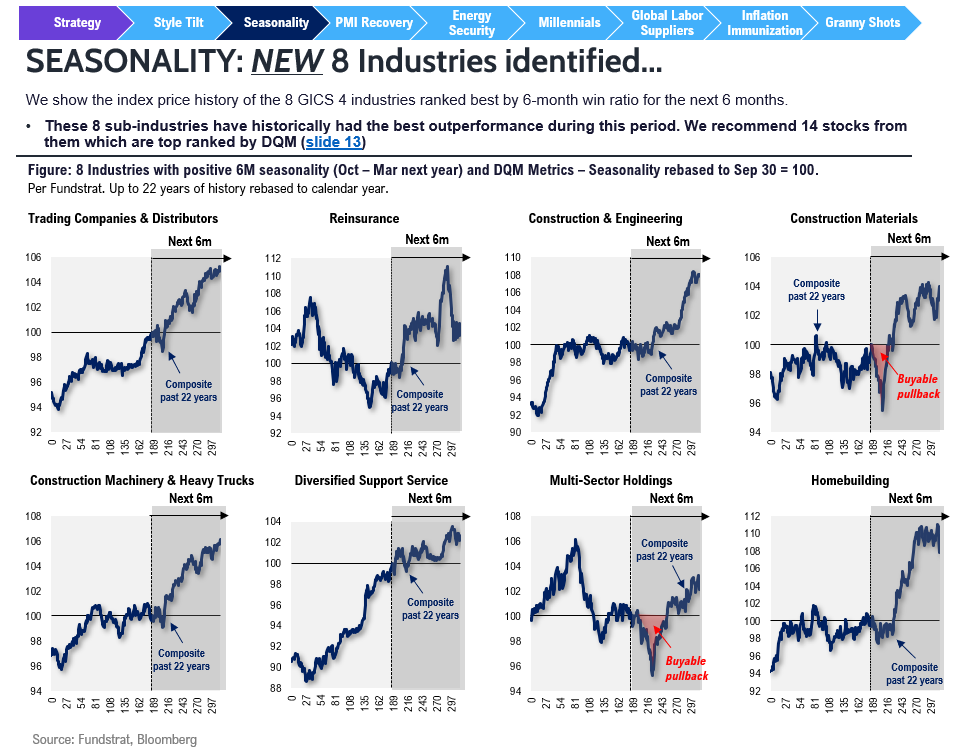
Seasonally Attractive Groups
Key incoming data October
-
10/2 10am ET September ISM ManufacturingTame -
10/3 10am ET JOLTS Job Openings AugustHot -
10/4 10am ET September ISM ServicesTame 10/6 8:30am ET September Jobs ReportMixed-
10/6 9am ET Manheim Used Vehicle Index September FinalTame 10/10 11am NY Fed Inflation ExpectationsMixed-
10/11 8:30am ET September PPIMixed 10/11 2pm ET Sep FOMC Meeting MinutesTame-
10/12 8:30am ET September CPIMixed -
10/13 10am ET U. Mich. September prelim 1-yr inflationMixed 10/16 8:30am ET October Empire Manufacturing SurveyTame10/17 8:30am ET October New York Fed Business Activity SurveyTame10/17 8:30am ET September Retail Sales DataHot10/17 9am ET Manheim October Mid-Month Used Vehicle Value IndexTame10/17 10am ET October NAHB Housing Market IndexTame- 10/18 8:30am ET September Housing Starts
- 10/18 2pm ET Fed releases Beige Book
- 10/19 8:30am ET October Philly Fed Business Outlook Survey
- 10/19 10am ET Existing Home Sales
- 10/19 12pm ET Fed (including Powell) speaking at Economic Club of New York
- 10/24 9:45am ET S&P Global PMI October Prelim
- 10/26 8:30am ET 3Q 2023 GDP Advance
- 10/27 8:30am ET September PCE
- 10/27 10am ET Oct F UMich Sentiment and Inflation expectation
- 10/30 10:30am ET Dallas Fed September Manufacturing Activity Survey
- 10/31 9am ET August S&P CoreLogic CS home price
- 10/31 10am ET October Conference Board Consumer Confidence
Key incoming data September
9/1 8:30am ET August Jobs ReportTame9/1 10am ET August ISM ManufacturingTame9/6 10am ET August ISM ServicesMixed9/6 2pm ET Fed releases Beige BookTame9/8 9am ET Manheim Used Vehicle Index August FinalTame9/8 2Q23 Fed Flow of Funds ReportTame-
9/13 8:30am ET August CPIMixed -
9/14 8:30am ET August PPITame -
9/15 8:30am ET September Empire Manufacturing SurveyTame 9/15 10am ET U. Mich. September prelim 1-yr inflationTame-
9/18 8:30am ET September New York Fed Business Activity SurveyTame -
9/18 10am ET September NAHB Housing Market IndexTame 9/19 9am ET Manheim September Mid-Month Used Vehicle Value IndexMixed9/20 2pm ET September FOMC rates decisionMarket saw Hawkish-
9/21 8:30am ET September Philly Fed Business Outlook SurveyMixed 9/22 9:45am ET S&P Global PMI September Prelim9/25 10:30am ET Dallas Fed September Manufacturing Activity Survey9/26 9am ET July S&P CoreLogic CS home price9/26 10am ET September Conference Board Consumer Confidence
Key incoming data August
8/1 10am ET July ISM ManufacturingTame8/1 10am ET JOLTS Job Openings JunTame8/2 8:15am ADP National Employment ReportHot8/3 10am ET July ISM ServicesTame8/4 8:30am ET July Jobs reportTame8/7 11am ET Manheim Used Vehicle Index July FinalTame8/10 8:30am ET July CPITame8/11 8:30am ET July PPITame8/11 10am ET U. Mich. July prelim 1-yr inflationTame8/11 Atlanta Fed Wage Tracker JulyTame8/15 8:30am ET Aug Empire Manufacturing SurveyMixed8/15 10am ET Aug NAHB Housing Market IndexTame8/16 8:30am ET Aug New York Fed Business Activity SurveyNeutral8/16 2pm ET FOMC MinutesMixed8/17 8:30am ET Aug Philly Fed Business Outlook SurveyPositive8/17 Manheim Aug Mid-Month Used Vehicle Value IndexTame8/23 9:45am ET S&P Global PMI Aug PrelimWeak8/25 10am ET Aug Final U Mich 1-yr inflationMixed8/28 10:30am ET Dallas Fed Aug Manufacturing Activity SurveyTame8/29 9am ET June S&P CoreLogic CS home priceTame8/29 10am ET Aug Conference Board Consumer ConfidenceTame8/29 10 am ET Jul JOLTSTame8/31 8:30am ET July PCETame
Key incoming data July
7/3 10am ET June ISM ManufacturingTame7/6 8:15am ADP National Employment ReportHot7/6 10am ET June ISM ServicesTame7/6 10 am ET May JOLTSTame7/7 8:30am ET June Jobs reportMixed7/10 11am ET Manheim Used Vehicle Index June FinalTame7/12 8:30am ET June CPITame7/13 8:30am ET June PPITame7/13 Atlanta Fed Wage Tracker JuneTame7/14 10am ET U. Mich. June prelim 1-yr inflationMixed7/17 8:30am July Empire Manufacturing Survey7/18 8:30am July New York Fed Business Activity Survey7/18 10am July NAHB Housing Market Indexin-line7/18 Manheim July Mid-Month Used Vehicle Value IndexTame7/25 9am ET May S&P CoreLogic CS home priceTame7/25 10am ET July Conference Board Consumer ConfidenceTame7/26 2pm ET July FOMC rates decisionTame7/28 8:30am ET June PCETame7/28 8:30am ET 2Q ECI Employment Cost IndexTame7/28 10am ET July Final U Mich 1-yr inflationTame
Key data from June
6/1 10am ET May ISM ManufacturingTame6/2 8:30am ET May Jobs reportTame6/5 10am ET May ISM ServicesTame6/7 Manheim Used Vehicle Value Index MayTame6/9 Atlanta Fed Wage Tracker AprilTame6/13 8:30am ET May CPITame6/14 8:30am ET May PPITame6/14 2pm ET April FOMC rates decisionTame6/16 10am ET U. Mich. May prelim 1-yr inflationTame6/27 9am ET April S&P CoreLogic CS home priceTame6/27 10am ET June Conference Board Consumer ConfidenceTame6/30 8:30am ET May PCETame6/30 10am ET June Final U Mich 1-yr inflationTame
Key data from May
5/1 10am ET April ISM Manufacturing (PMIs turn up)Positive inflection5/2 10am ET Mar JOLTSSofter than consensus5/3 10am ET April ISM ServicesTame5/3 2pm Fed May FOMC rates decisionDovish5/5 8:30am ET April Jobs reportTame5/5 Manheim Used Vehicle Value Index AprilTame5/8 2pm ET April 2023 Senior Loan Officer Opinion SurveyBetter than feared5/10 8:30am ET April CPITame5/11 8:30am ET April PPITame5/12 10am ET U. Mich. April prelim 1-yr inflationTame5/12 Atlanta Fed Wage Tracker AprilTame5/24 2pm ET May FOMC minutesDovish5/26 8:30am ET PCE AprilTame5/26 10am ET U. Mich. April final 1-yr inflationTame5/31 10am ET JOLTS April job openings
_____________________________
The Granny Shots page will be updated shortly. See above for more details on this rebalance.
______________________________
PS: if you are enjoying our service and its evidence-based approach, please leave us a positive 5-star review on Google reviews —> Click here.
We publish on a 3-day a week schedule:
– Monday
– SKIP TUESDAY
– Wednesday
– SKIP THURSDAY
– Friday

