

Inflation showing decisive "break" in pattern. Rally strengthening = focus on lower quality. 6 names. 2H rally intact.

We publish on a 3-day a week schedule:
– SKIP MON –> Personal matter this day
– SKIP TUE
– Wednesday
– SKIP WED
– Friday
The rally seen in equity markets post-CPI has been largely met with skepticism. This is essentially true of the gains seen over the past week and past month. Below is a comment from a sellside strategist and is emblematic of the pushback we get from clients (keep in mind, the sellside often mirrors what institutional investors broadly are saying).
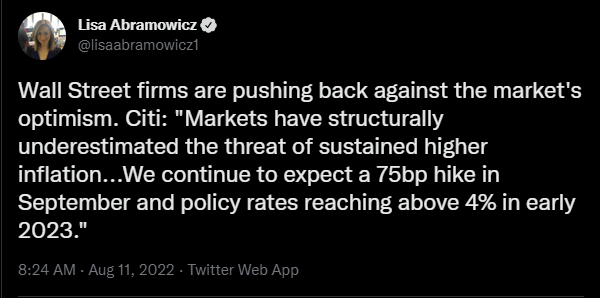
As to why, we think much of this is explained by an anchored cognitive bias. The following contributes to investors seeing “half-empty”
- Fed is raising rates and the binary conclusion is stocks go down
- Inflation has been problematic for the past 16 months, and investors see it as “sticky” ala 1970s-80s, meaning it will linger for years and years
- Stocks have been falling, so the momentum is negative
- Stocks are rising only for “technical reasons”
On that latter point, I had lunch this week with an institutional investor who in summary said:
- “there is no fundamental reason for stocks to be going up, especially if someone cares about earnings”
- “the only people who are bullish are doing it for technical reasons, has anyone ever met a really rich technician?”
- “name one fundamental investor who likes stocks here, there are none”
- you get the picture. Deep skepticism.
But as we have discussed multiple times in our commentaries, we believe stocks are rising for the right reasons. There are multiple factors (see section below) but we view August 1982 as the best analog. When inflation apexes, markets see this first and then the Fed reacts.
Breadth of rally is expanding…
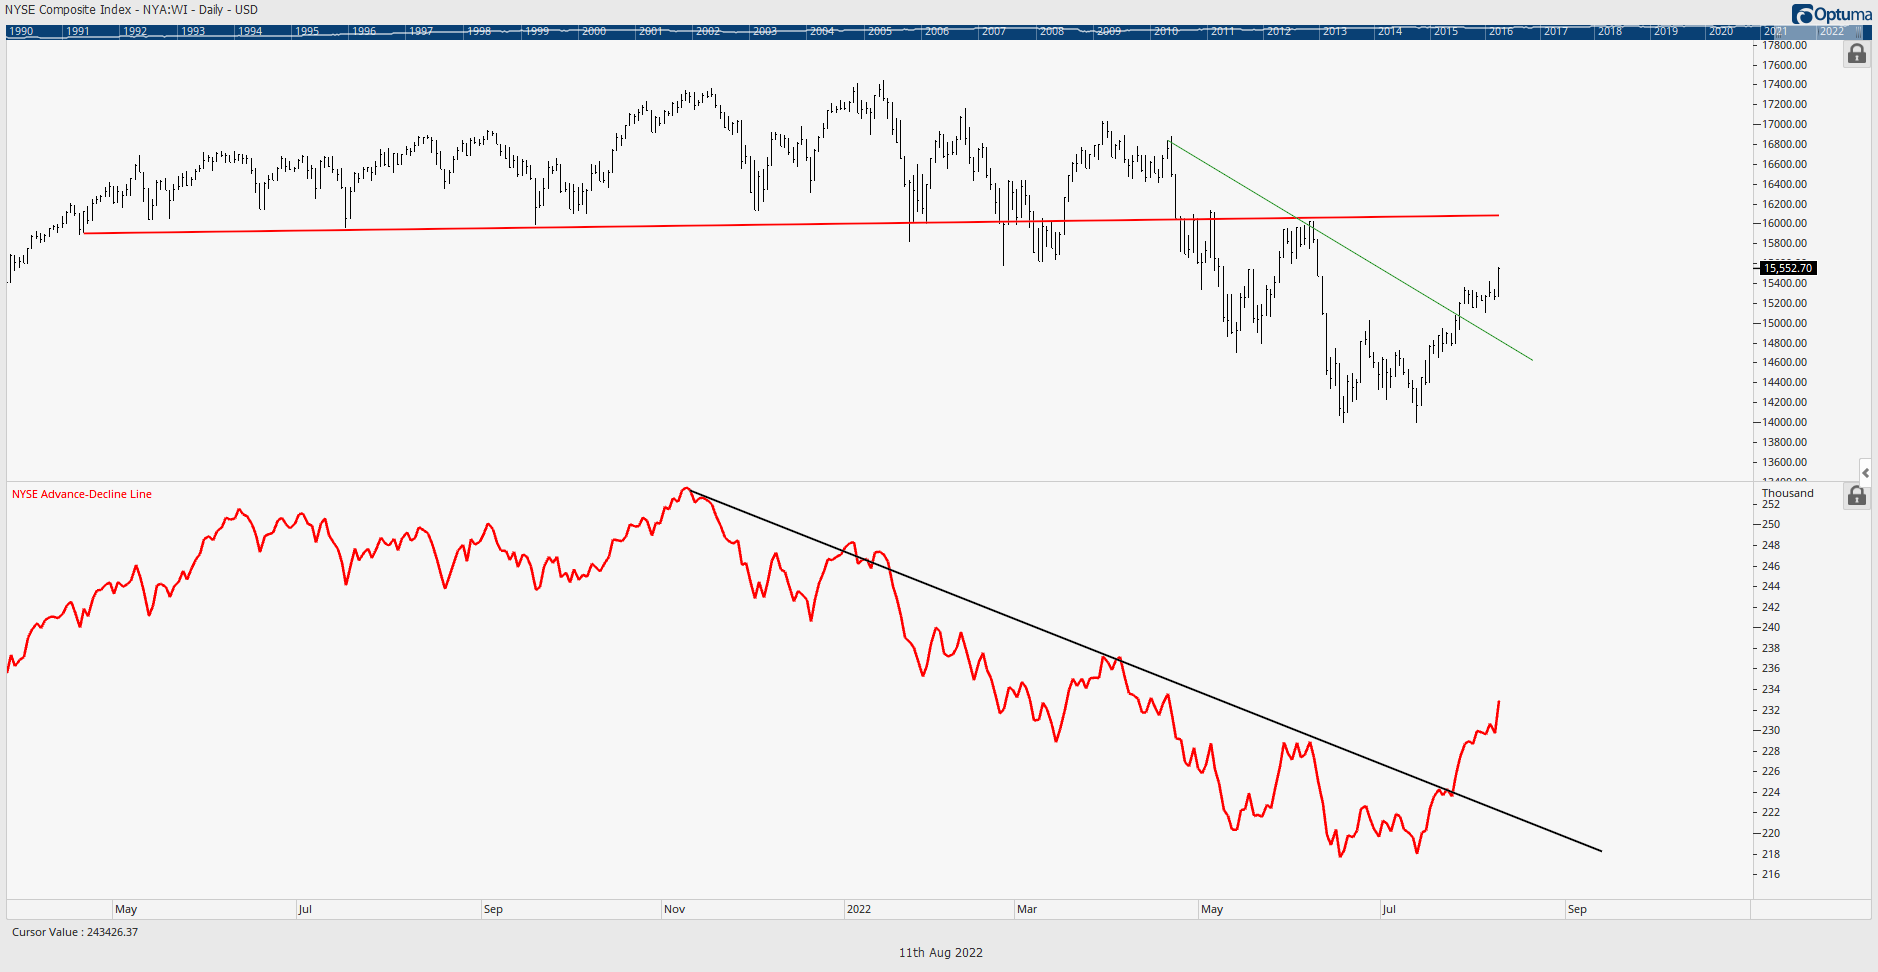
Notably, the breadth of this rally is expanding. There are multiple measures but Mark Newton, Head of Technical Strategy, notes two measures that are useful:
- the advance/decline line is breaking to the upside (see below)
- small-caps relative performance is breaking out to the upside
These are both solid measures of market breadth and show the rally in stocks is broadening. This lends further credence to the rally.
Rally breadth is expanding = risk/reward favors a focus on “lower quality” and “small-caps”
And in the past, when breadth is expanding, risk/reward improves for both “lower quality” and “small-caps” with the rationale being:
- improving financial conditions favor companies with lower margins = lower quality
- interest rates flattening favors companies with higher debt leverage = lower quality
- improving Fed outlook and lower inflation favor smaller players = small-caps
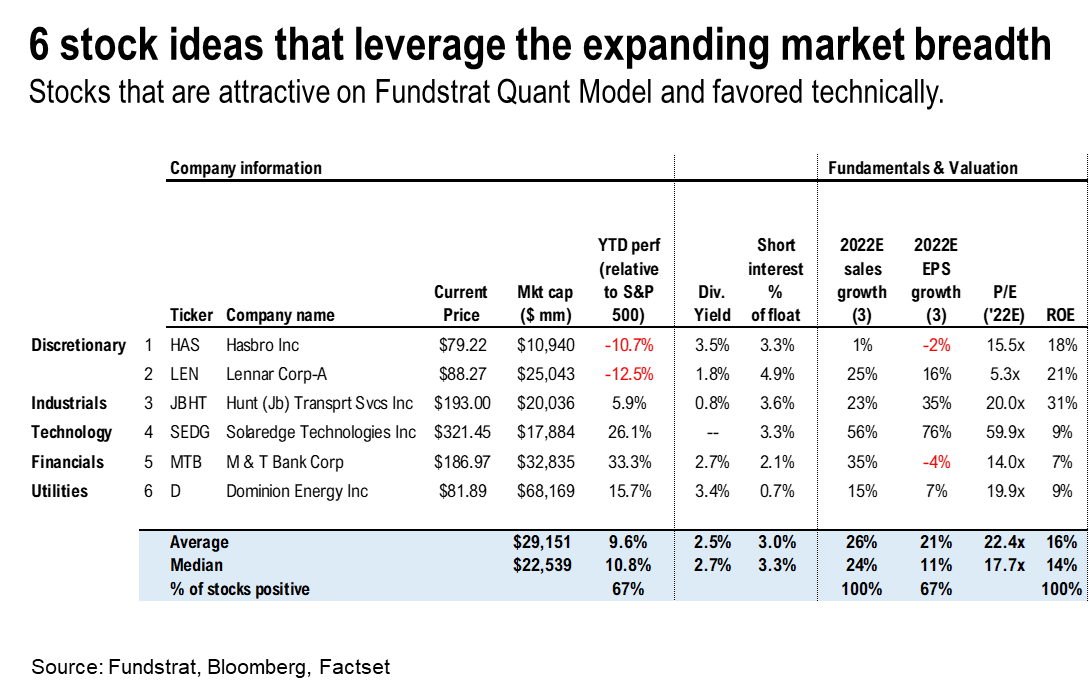
BREADTH STOCKS: 6 stocks that leverage the expanding market breadth
Our data science team, led by tireless Ken, has put together a list of stocks that have improved risk/reward. These stocks meet the following criteria:
- lower quality on margins
- higher leverage levels
- attractive on FSInsight’s Quant Model quintile 1
- attractive technical characteristics as determined by Mark Newton
There are 6 names. The list and tickers are below:
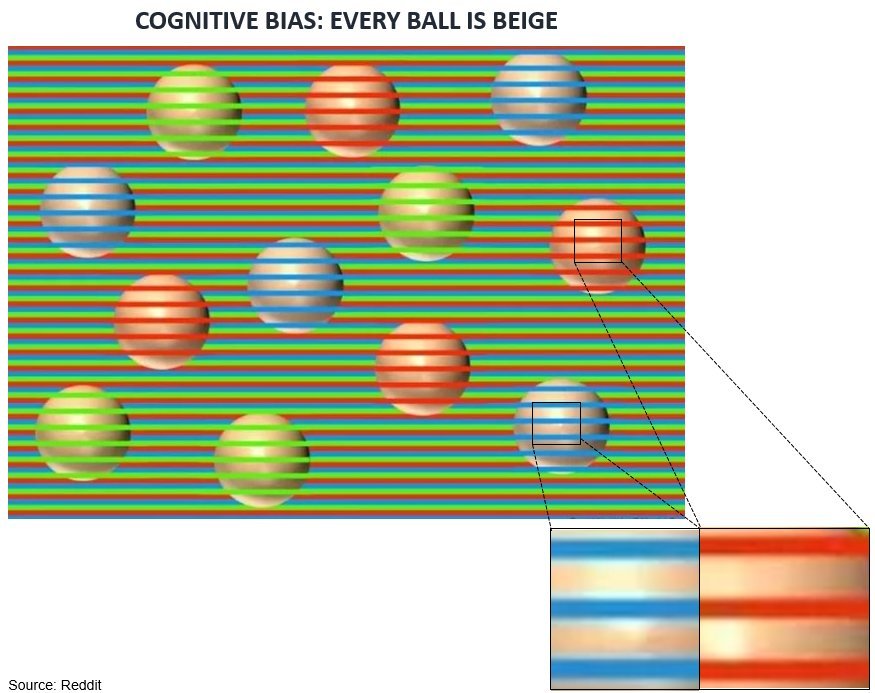
COGNITIVE BIAS:Humans have a cognitive bias that impacts perception of incoming data
We have posted this below example previously. Notice how our brains see these balls as colored? Yet, in fact, these balls are all the same color. I know this is not exactly the same as how investors view markets, but the same process is at work.
- every incoming data point is compared to a working baseline view
- and human cognitive bias can often overfit how this data is interpreted
Inflation seems to be inflecting in the “hard” data but many argue nothing has changed
At FSInsight, we suffer the same risk, but we try to course correct. And our collaborative process of incorporating demographics, historical context, technicals, fundamentals, quantitative and investor surveys provides us balance:
- today, we think the views on inflation are overly pessimistic
- inflation is difficult to predict and forecast
- but the July CPI (8/10) and July PPI (released 8/11) are showing a pronounced break in pattern
- this break is a sharp slowing
- and corroborates the visible and consistent easing of inflationary pressures seen in commodities, durable goods, inventory corrections, alternative data and even consumer surveys
July PPI is a “break” in pattern— DEFLATION
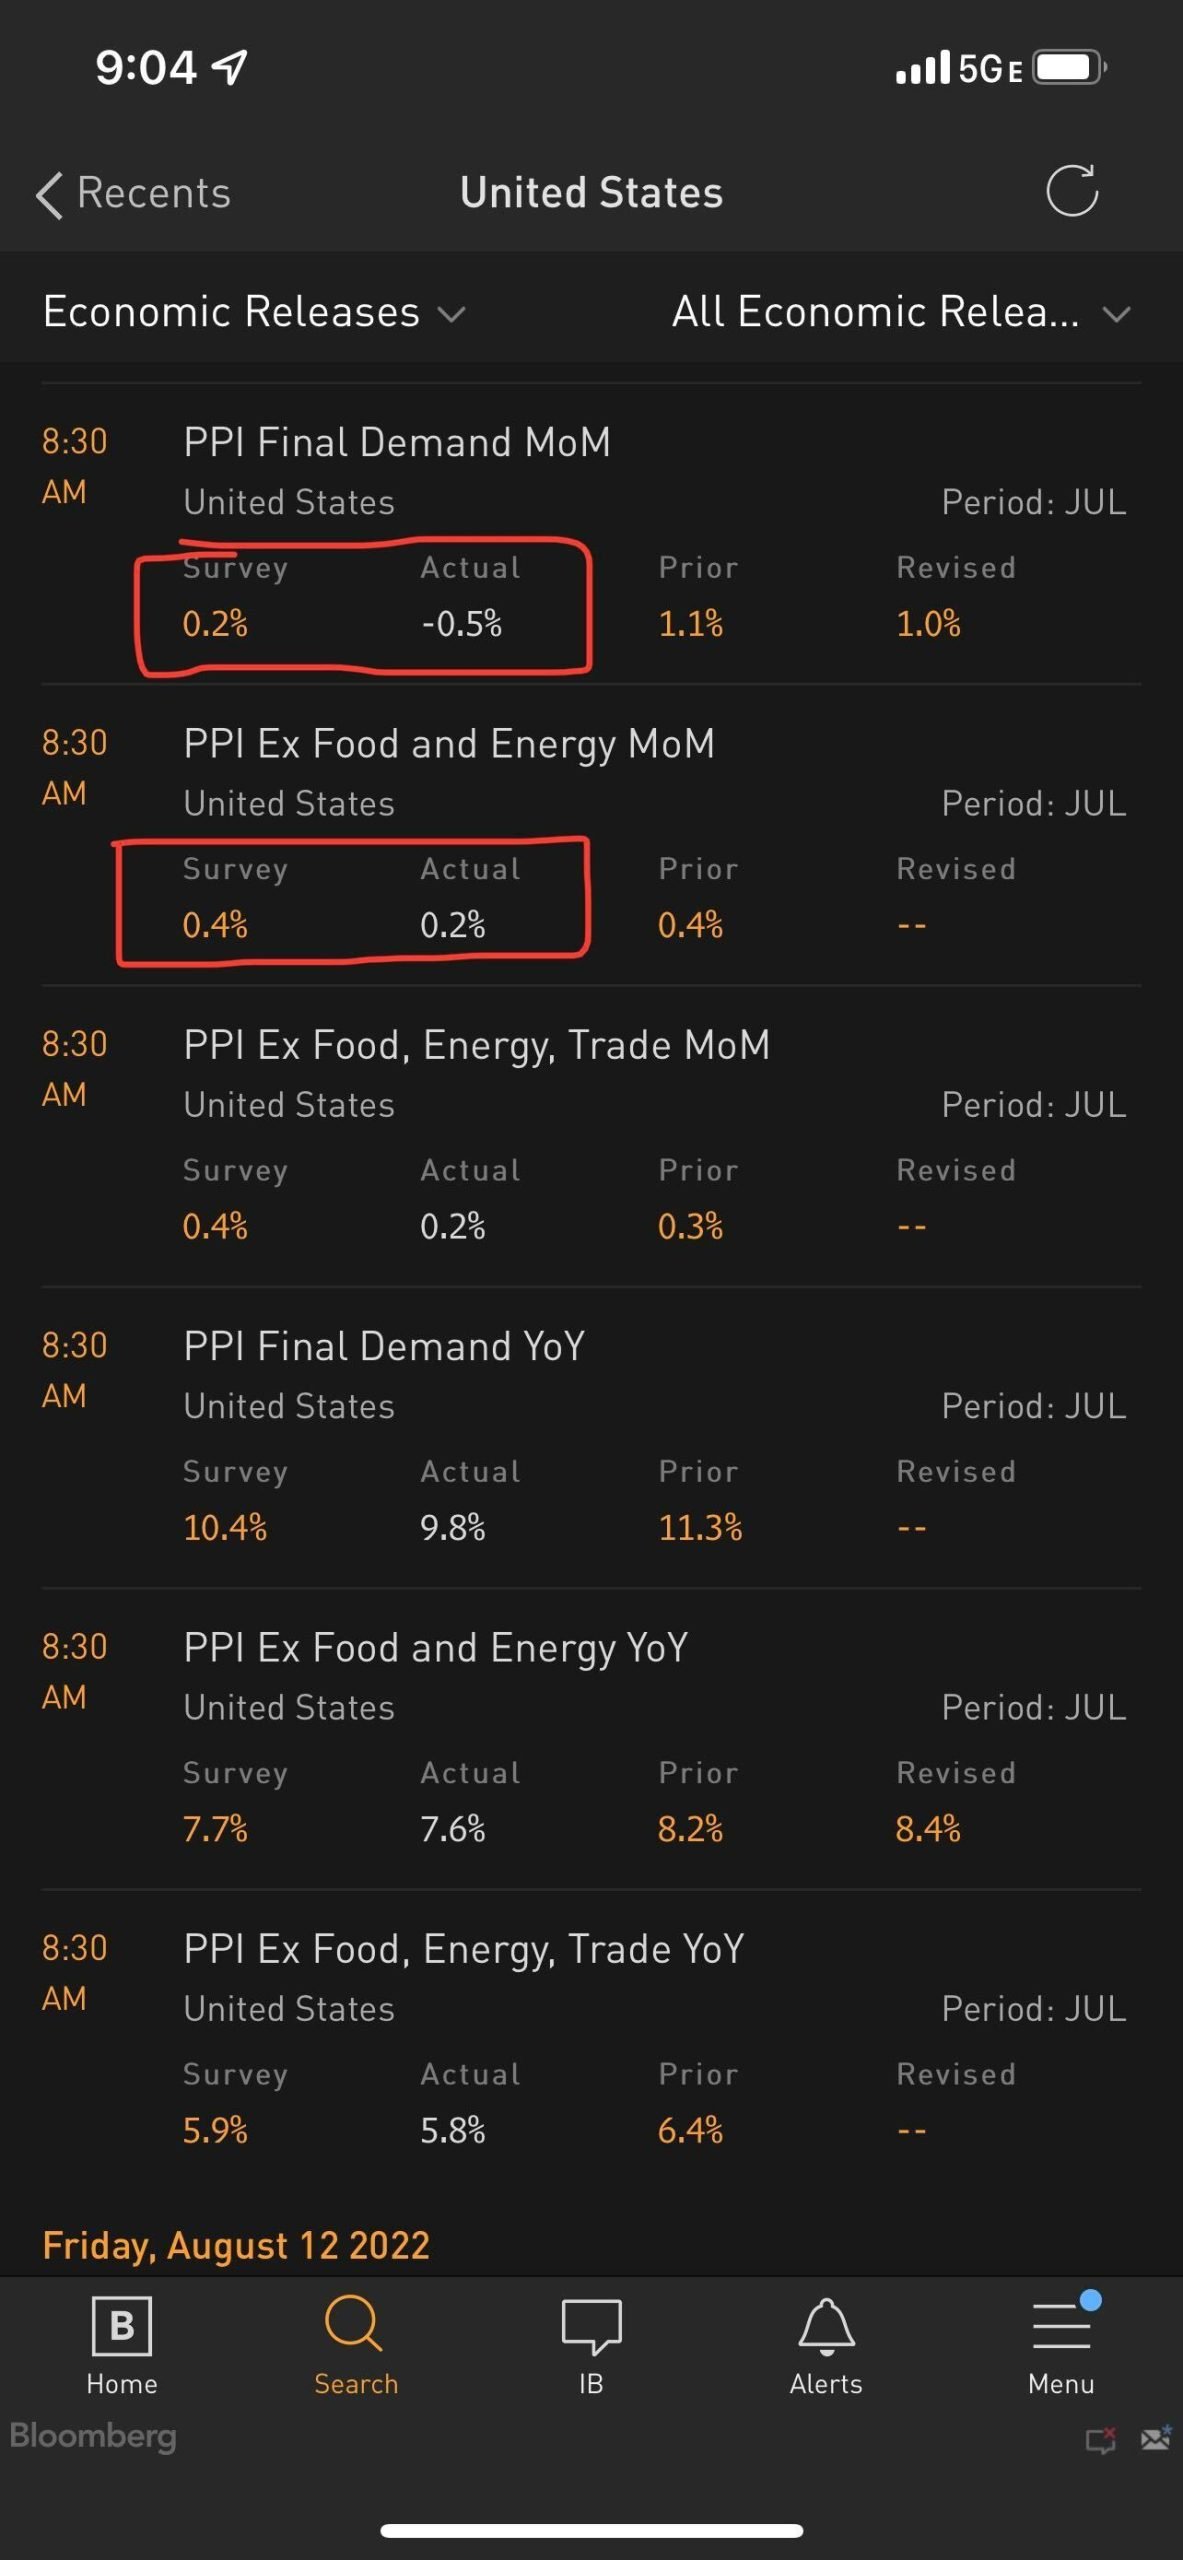
The July PPI came in below expectations with producer prices DEFLATING in July:
- PPI down -0.5% versus consensus +0.2%
- June PPI +1.1%
- deflation, yup
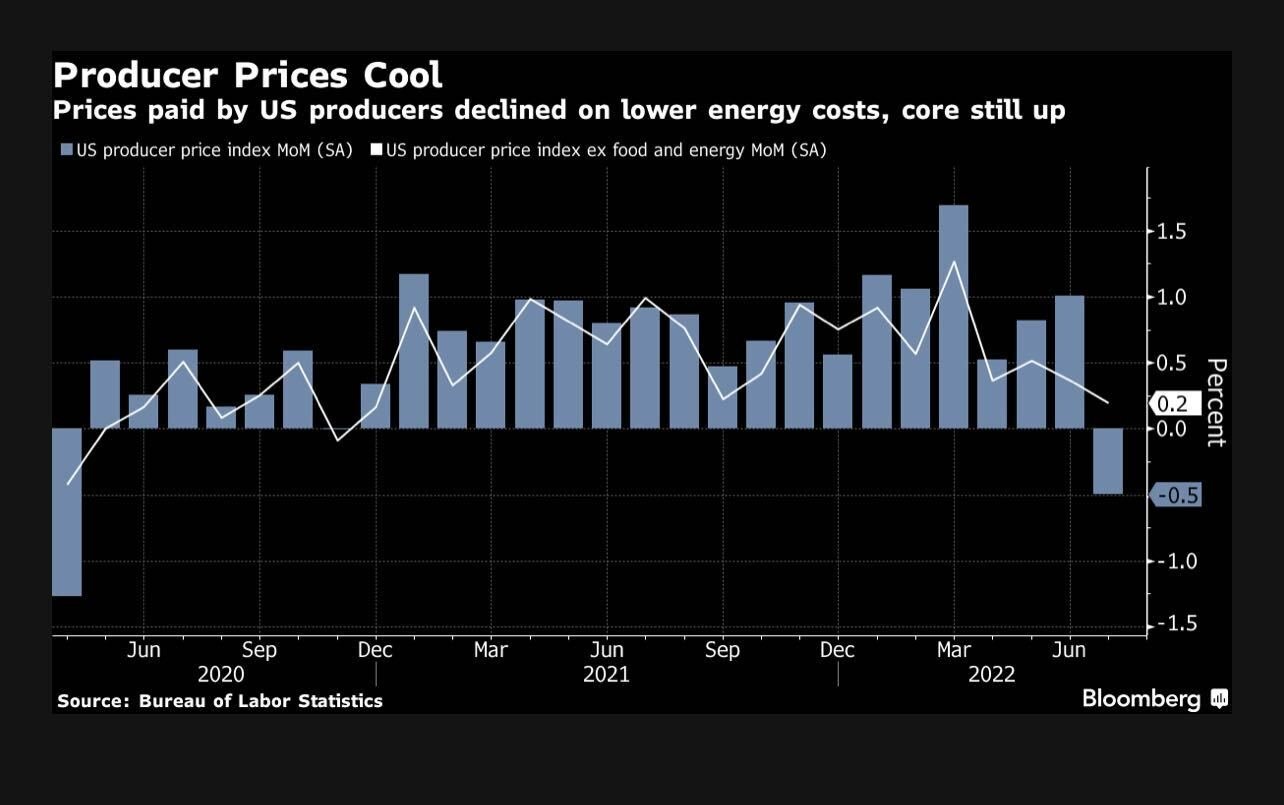
And as shown below, this is a break in pattern:
- PPI has not been negative MoM since May 2020
- hard to ignore, right?
July CPI is a “break” in pattern — “hard” data starting to reflect disinflation seen in leading indicators
The July CPI report seems to be changing the minds of the “inflationists” who have argued inflation would be sticky for years, and as a consequence, the Fed would need to “burn the economy to the ground.”
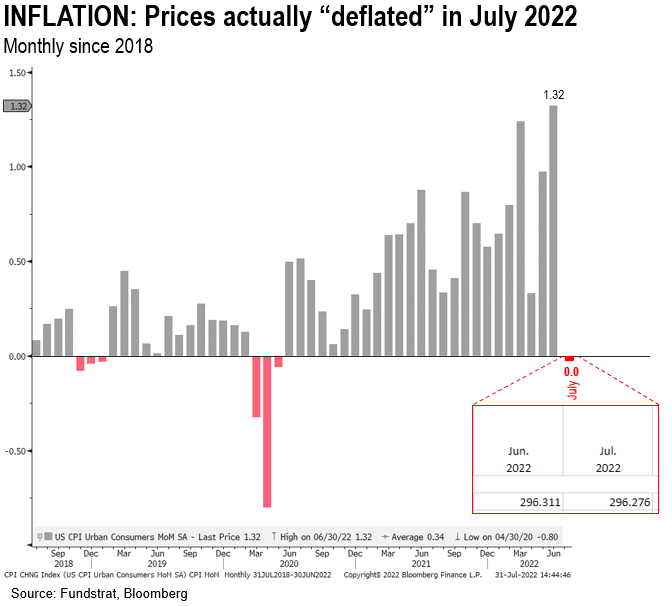
- instead, July CPI actually DEFLATED by -1.93bp month-over-month
- yup, deflation
- the July headline CPI is the lowest reading since June 2020
- inflation eased far faster than consensus argued
- bonus: July CPI came in -20bp below consensus estimates
The deflationary impacts of some categories show that inflationary pressures are not uniformly accelerating:
- Energy was the biggest contributor -0.42pp of the headline decline
- Travel was a -0.09pp
- Used cars and rentals was -0.02pp
- 3 categories that contributed to massive surges in inflation throughout 2022 turned into deflation contributors
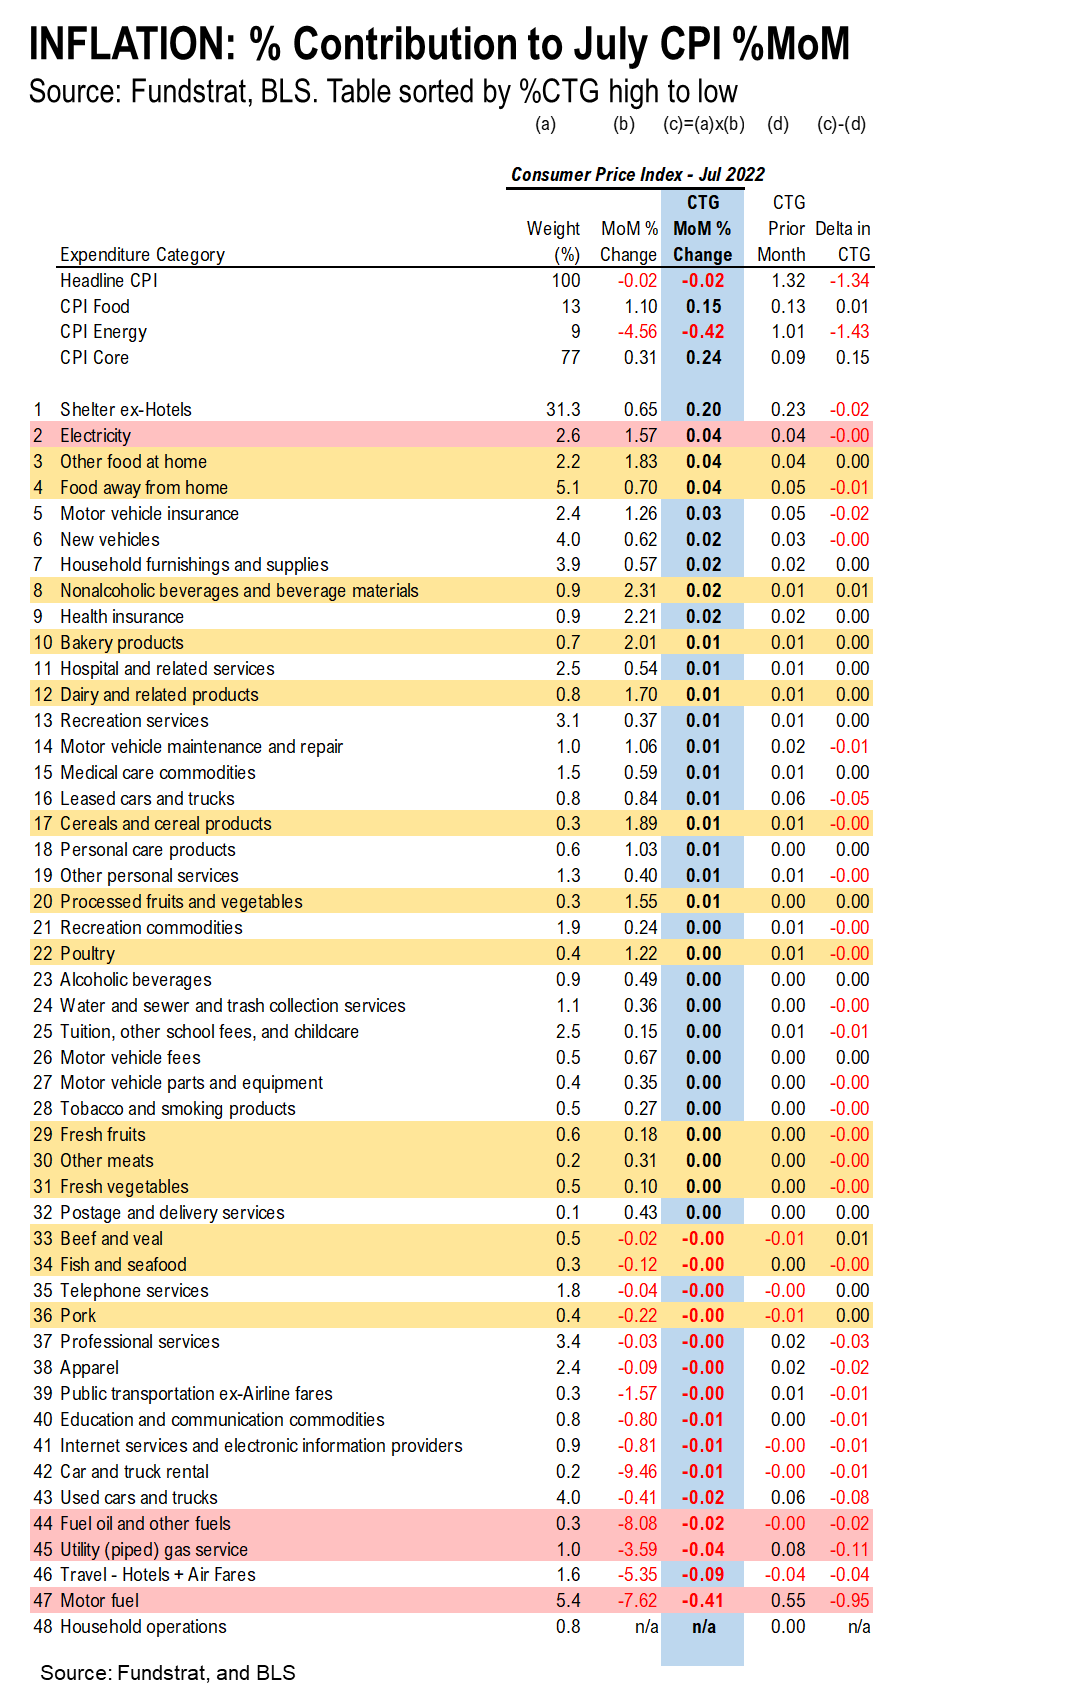
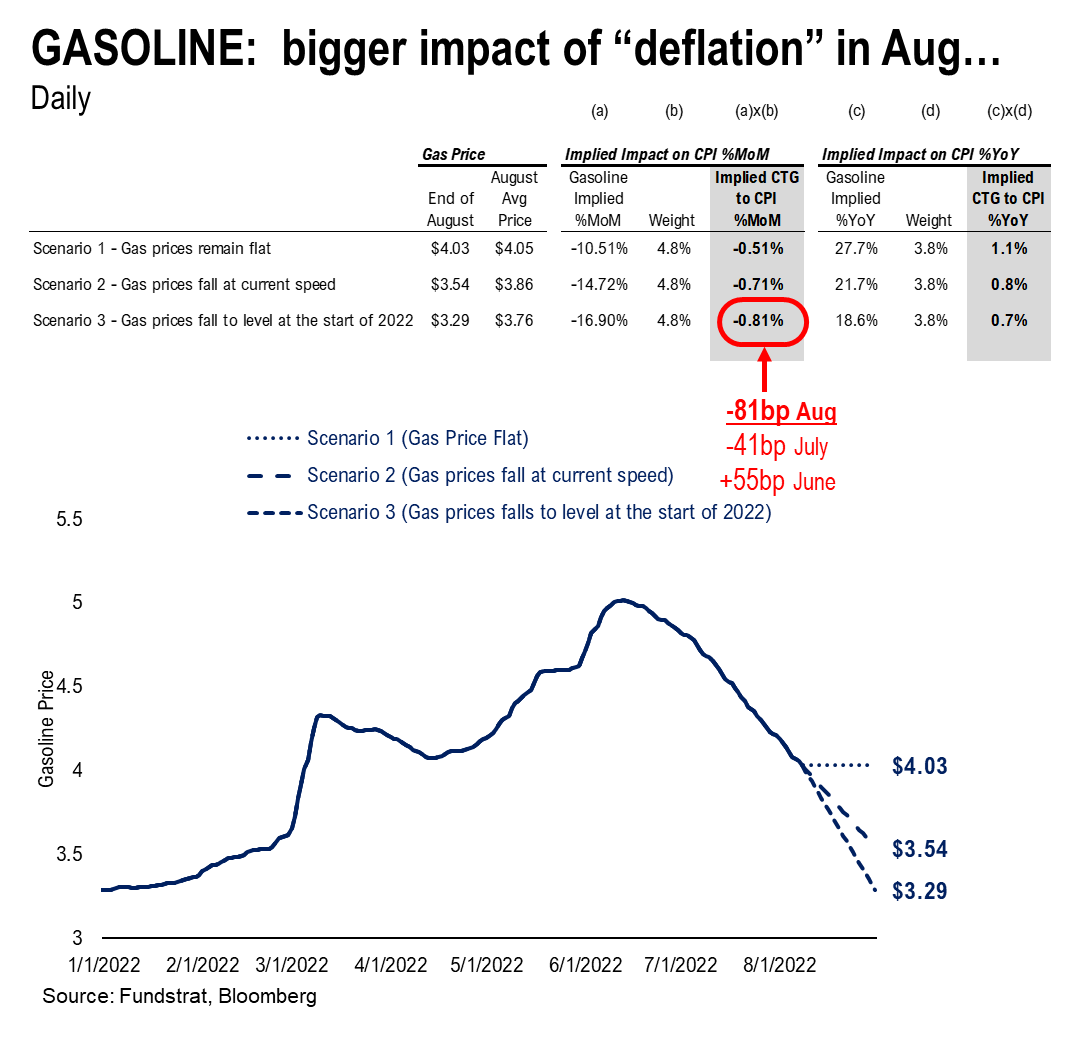
And as we noted earlier this week, gasoline is tracking for a decline in August. And the CPI impact will amplify:
- July gasoline subtracted -0.41pp
- August gasoline to subtract -0.81pp, or 2.0X the impact
- deflationary pressures larger in August
Cleveland Fed Inflation Nowcasting showing +0.19% CPI MoM in August, or 2.2% annualized
The July CPI downside surprise is influencing August CPI nowcasts. The Cleveland Fed inflation nowcasting model is looking for +0.19% MoM for August CPI, or 2.2% annualized
- as our gasoline analysis above shows
- august CPI could arguably be negative again
- especially if travel and used cars continue to cool

CPI lags real-time incoming data by 3-4 months
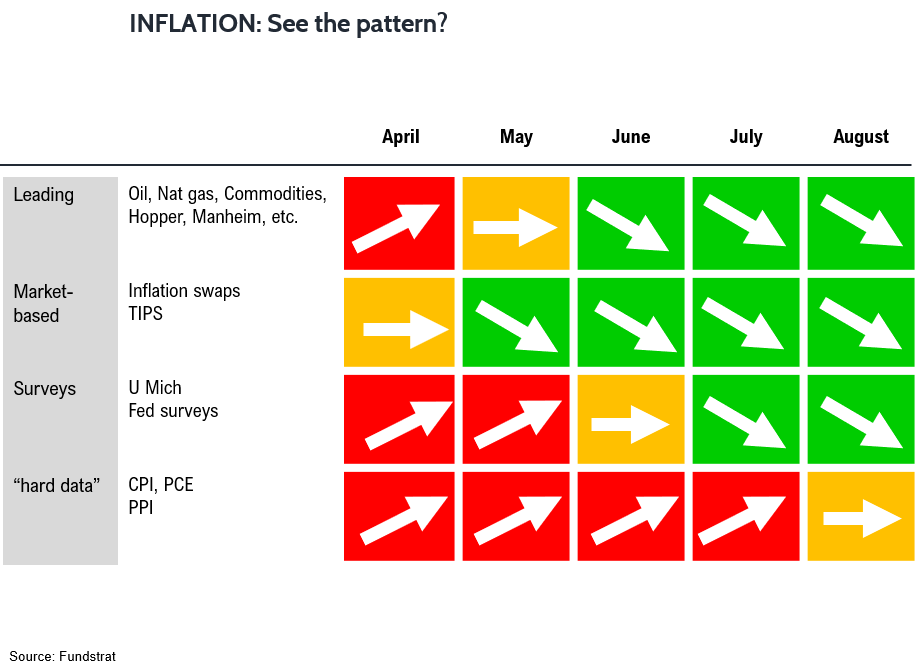
As our clients know, central to our thesis in 2022 is inflation would soften in 2H. This is counter to consensus and many of our clients, who generally believe inflation is sticky and would be elevated for many years ala 1970s to 1980s. And leading indicators for inflation have shown the underlying trend in inflation was substantially lower than the “hard” data (CPI, PCE or PPI reports).
- notice how many leading indicators of inflation, including surveys, show as vast improvement
- July CPI (reported in August) is the first CPI print that was not “hot”
- we published this table several months ago and are now updating it
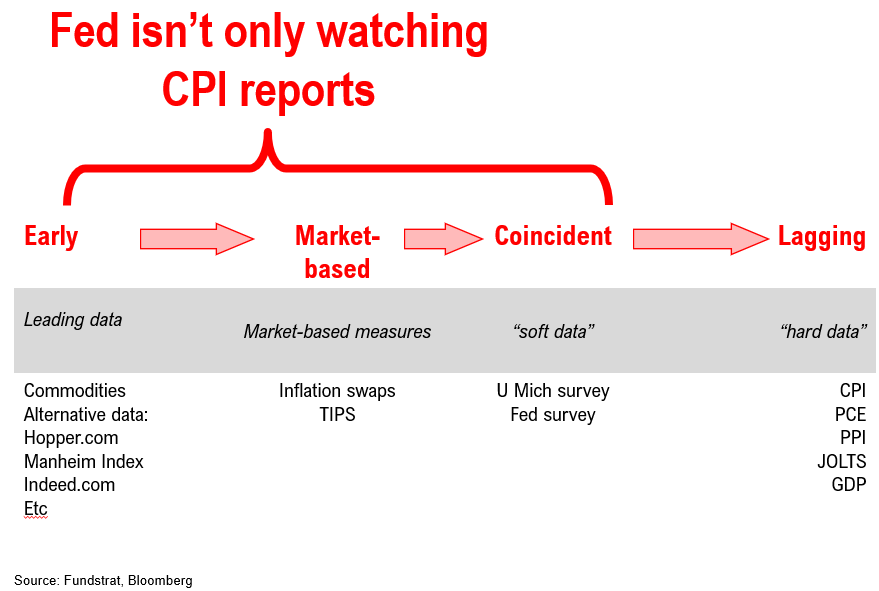
Hard data (“CPI”) lags soft data…Intuitively, Fed is not only watching “hard” data
And the above shows that “hard” CPI reports lag even the surveys by 2 months. If this is the case:
- realized inflation could be falling for 3-4 months
- consumers seen in surveys don’t recognize this for 5 months (+1)
- CPI report won’t show this for two additional months
- you get the picture
- we don’t think the Fed is primarily watching CPI
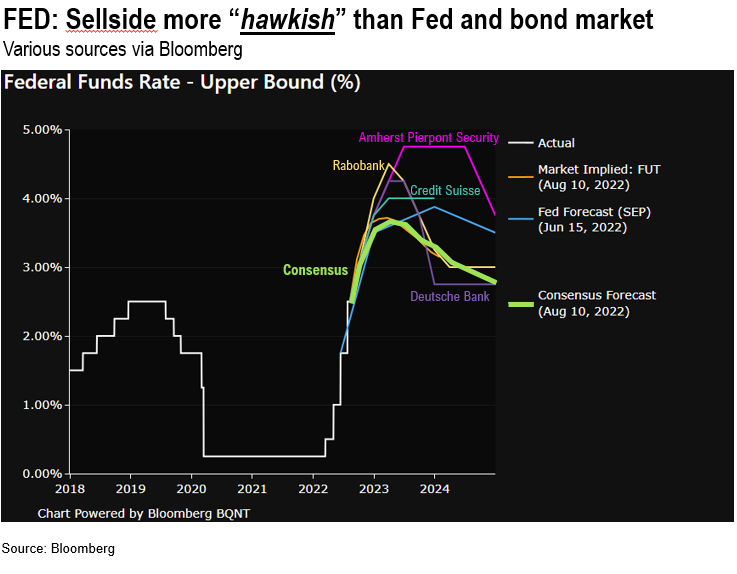
COUNTERTRADE: Sellside is more “hawkish” than Fed and more “hawkish” than inflation markets
In fact, this focus on CPI (almost solely) is the reason the sell-side seems so hawkish. Take a look at this chart based on the data collected by Bloomberg Analytics:
- there are Wall Street firms calling for 5% Fed Funds
- and hikes throughout 2023
- if the sellside is more hawkish than Fed and inflation markets
- it makes sense to “fade” that
COUNTERTRADE: 9 of 15 sellside equity strategists are outright bearish
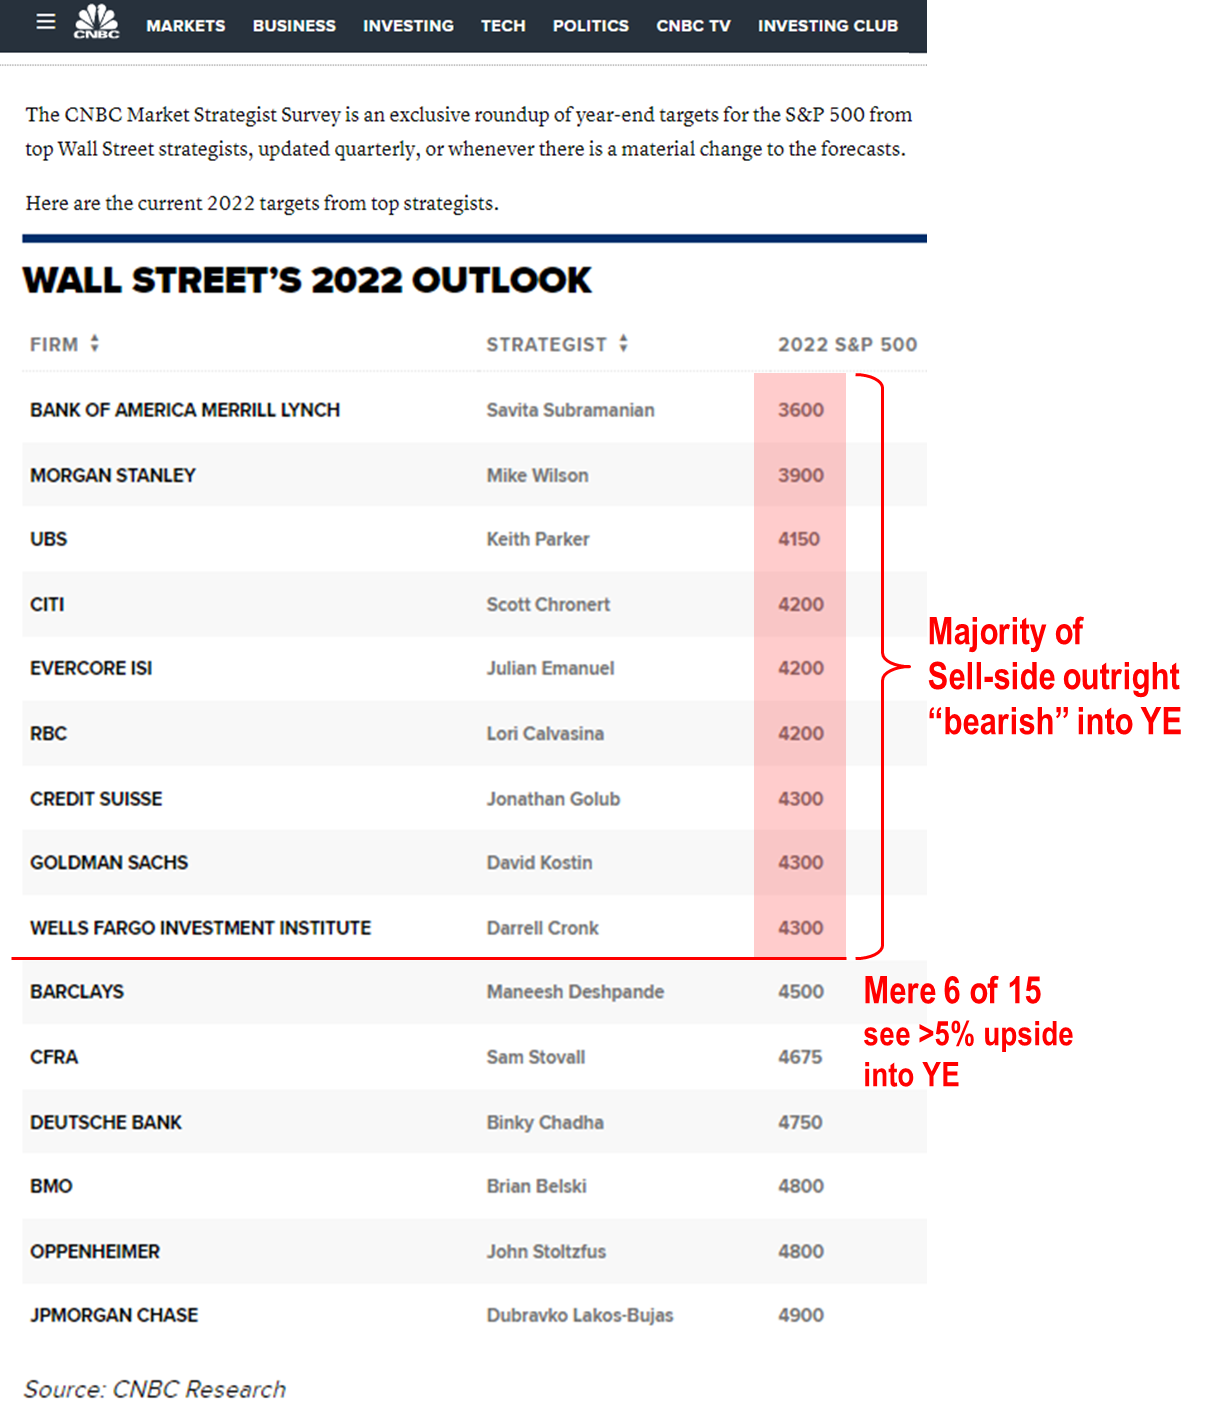
It is not only the economists on the sellside that seem too hawkish. Look at the YE 2022 S&P 500 price targets of sellside strategists:
- 9 of 15 are outright bearish, with upside for stocks below that of 2-year bonds
- 6 of these have declines in their forecast from today into YE with one at 3,600
- only 1 sees the S&P 500 posting positive gains by YE 2022
As our clients know, we believe the S&P 500 will see a recovery similar to 1982 and thus, recover YTD losses before YE.
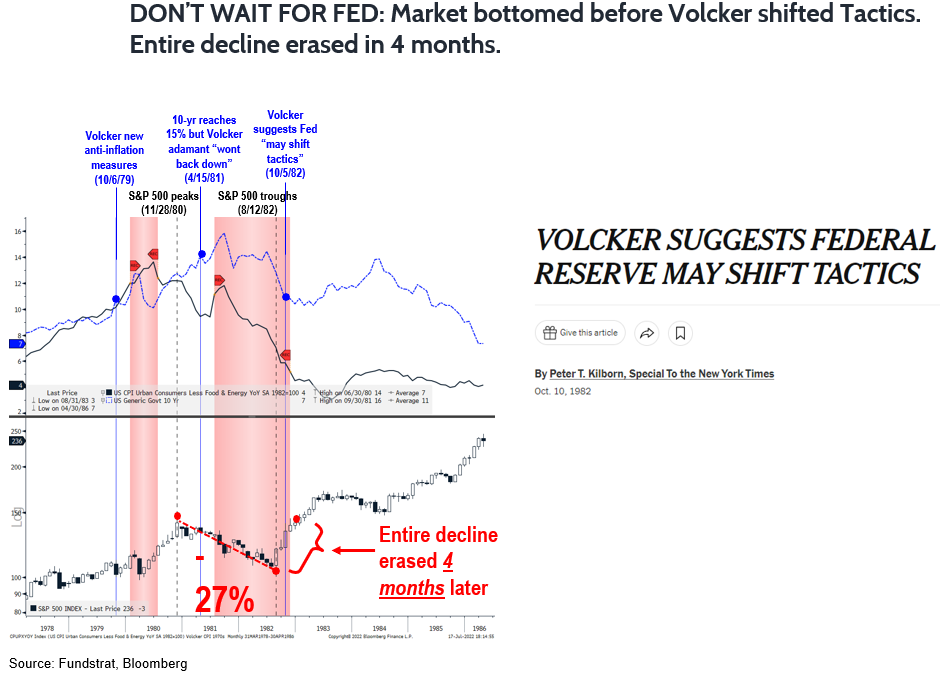
To clarify, in 1982, equities bottomed 9 weeks before the Fed even posited abandoning “anti-inflation” tactics:
- stocks bottomed 8/12/1982
- Volcker posited shifting on 10/5/1982
- stocks sniffed out this change well ahead of time
- the entire 36 month bear market was erased in 4 months
- yippey
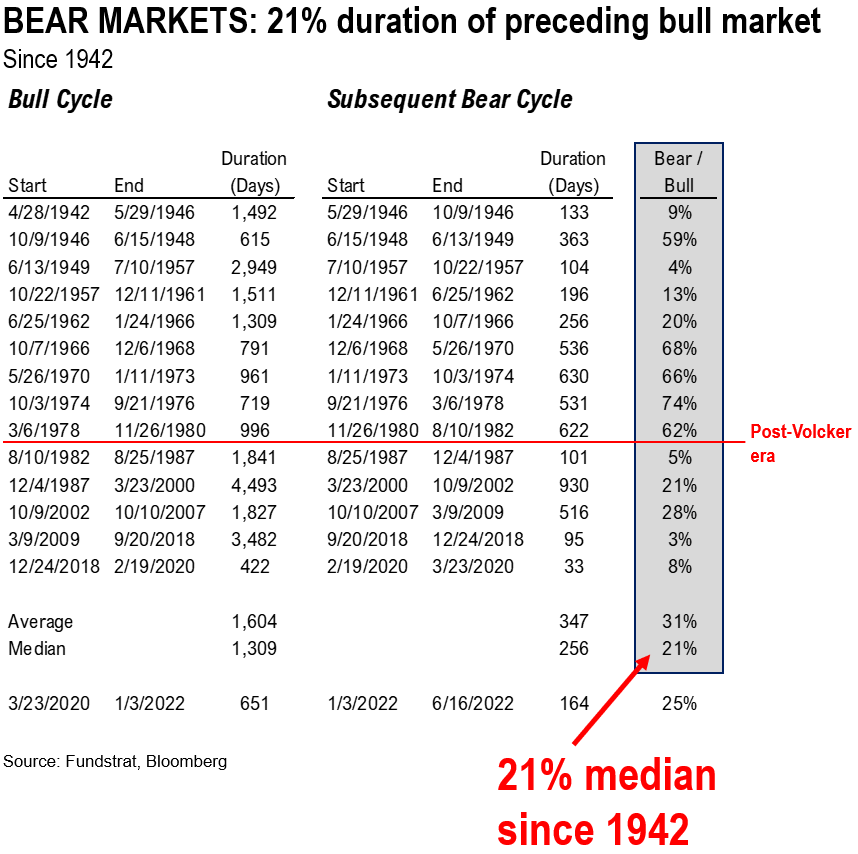
STRATEGY: 2022 Bear market was 164 days, or 25% duration of prior bull
Our data science team put together the comparative duration of bull markets and bear markets, and the corresponding ratio:
- since 1942, there have been 14 such cycles
- median ratio of bear vs bull is 31%, meaning a bear market is roughly 1/3 duration
- since 1982, this ratio is only 15%
- in 2022, the preceding bull market was 651 days
- the current bear market was 164 (using 6/16)
- or 25% ratio
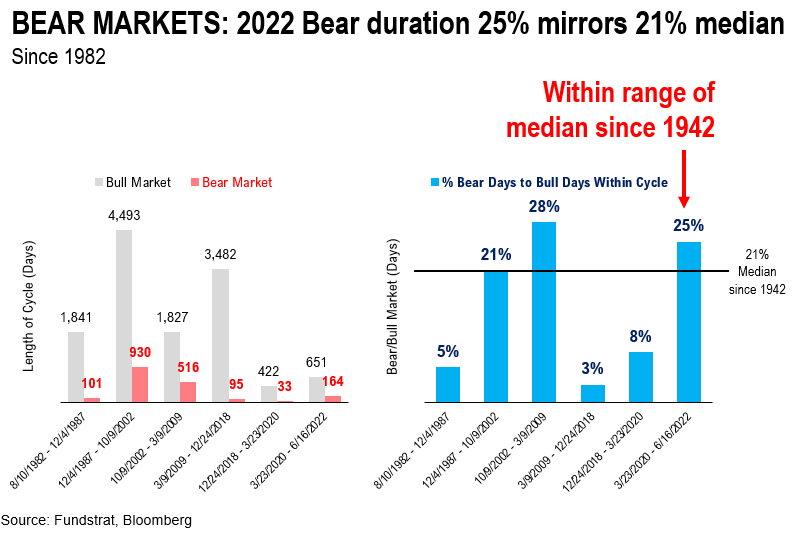
As seen below, this ratio is solidly within the ranges seen since 1982.
- many investors think “more time” is needed for this bear market
- but given the shortness of the preceding bull market 651 days versus 1,309 median
- the corresponding bear market should also be shorter
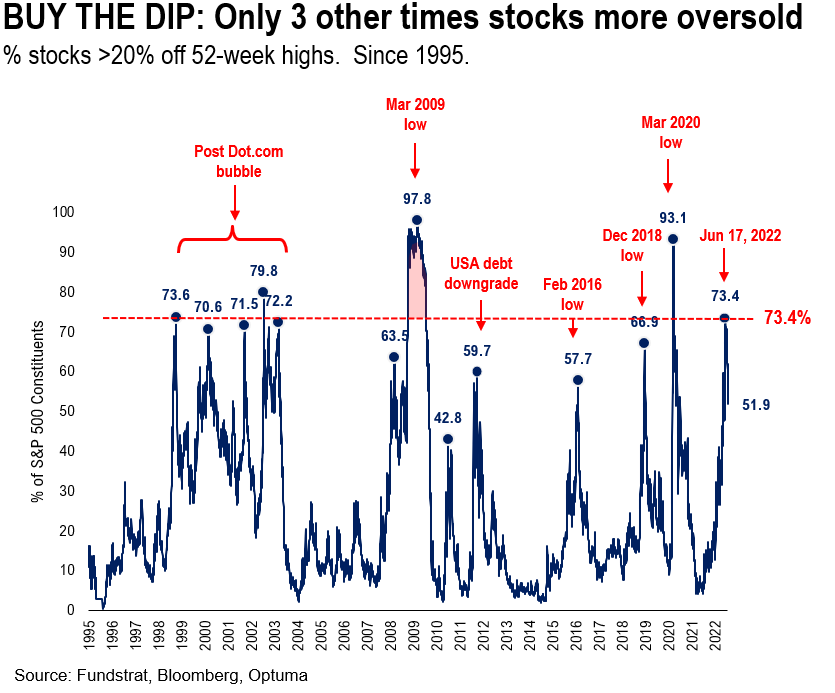
BUY THE DIP REGIME: Stocks already saw fundamental capitulation
And we want to revisit the chart below, which looks at the internals of the S&P 500 — the % stocks >20% off their highs, aka % stocks in a bear market.
- this figure surged to 73% on 6/17
- this was only exceeded 3 times in the past 30 years
- each of the 3 prior instances was the market bottom
- we think this is the 4th instance
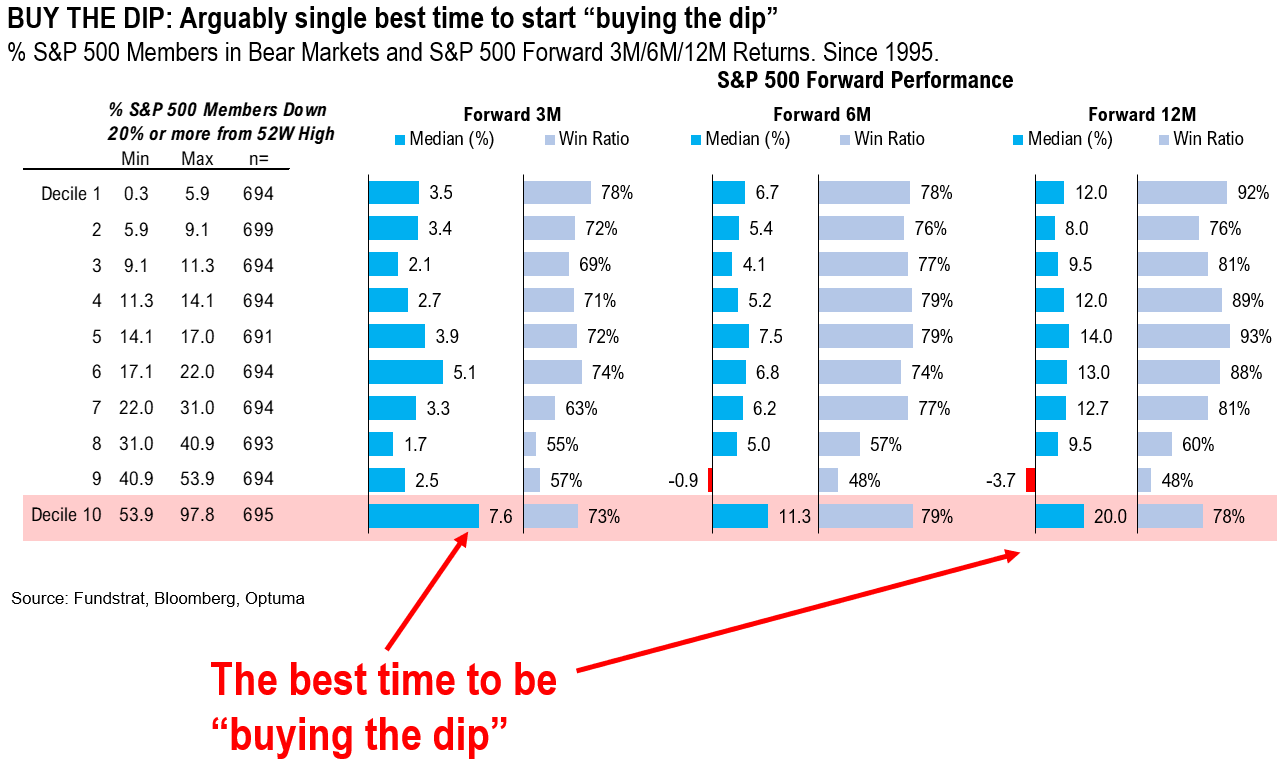
BUY THE DIP: forward returns strong
And stocks have the best forward returns when this figure exceeds 54% as shown below:
- in 3M, 6M and 12M
- the best decile for returns
- is when this figure is oversold >54%
- hence, buy the dip regime is in force
BOTTOM LINE: If equities sell-off after the July CPI, buying the dip makes sense
Our head of Technical Strategy, Mark Newton, sees higher odds of a pullback into August. There are multiple signs he is watching and are discussed in his notes. In short:
- he sees chances for S&P 500 to fall back towards 3,900 into August
- but this is a buyable pullback
TECHNICALS: S&P 500 could pull back to 3,900 = buying opportunity

Frankly, a pullback would be welcome, given stocks moved up so sharply in the past few weeks. And our clients remain mostly skeptical. In our conversations, most cite the fundamental risks:
- inflation is still high
- recession is still coming
- EPS downgrades coming
- too short to be a proper bear
- Fed still hiking
While many cite this, look at how well stocks are reacting to incoming news. The negative pre-announcements and lowered guidance by semiconductors.
- if these negative announcements happened in May/June, equities would have gone into a death spiral
- today, stocks are down but not that materially
- arguably, this shows how light positioning is within equities
- if investors are bracing for the worst, bad news itself has less impact
- argues to “buy the dip”
_____________________________
33 Granny Shot Ideas: We performed our quarterly rebalance on 7/12. Full stock list here –> Click here
______________________________

