-
Research
-
Latest Research
-
Latest VideosFSI Pro FSI Macro FSI Crypto
- Tom Lee, CFA AC
-
First WordFSI Pro FSI Macro
-
Intraday WordFSI Pro FSI Macro
-
Macro Minute VideoFSI Pro FSI Macro
-
OutlooksFSI Pro FSI Macro
- Mark L. Newton, CMT AC
-
Daily Technical StrategyFSI Pro FSI Macro
-
Live Technical Stock AnalysisFSI Pro FSI Macro
-
OutlooksFSI Pro FSI Macro
- L . Thomas Block
-
US PolicyFSI Pro FSI Macro
- Market Intelligence
-
Your Weekly RoadmapFSI Pro FSI Macro FSI Weekly
-
First to MarketFSI Pro FSI Macro
-
Signal From Noise
-
Earnings DailyFSI Pro FSI Macro FSI Weekly
-
Fed WatchFSI Pro FSI Macro
- Crypto Research
-
StrategyFSI Pro FSI Crypto
-
CommentsFSI Pro FSI Crypto
-
Funding FridaysFSI Pro FSI Crypto
-
Liquid VenturesFSI Pro FSI Crypto
-
Deep ResearchFSI Pro FSI Crypto
-
-
Webinars & More
- Webinars
-
Latest WebinarsFSI Pro FSI Macro FSI Crypto
-
Market OutlookFSI Pro FSI Macro FSI Crypto
-
Granny ShotsFSI Pro FSI Macro FSI Crypto
-
Technical StrategyFSI Pro FSI Macro FSI Crypto
-
CryptoFSI Pro FSI Macro FSI Crypto
-
Special GuestFSI Pro FSI Macro FSI Crypto
- Media Appearances
-
Latest Appearances
-
Tom Lee, CFA AC
-
Mark L. Newton, CMT AC
-
Sean Farrell AC
-
L . Thomas Block
-
⚡FlashInsights
-
Stock Lists
-
Latest Stock Lists
- Super and Sleeper Grannies
-
Stock ListFSI Pro FSI Macro
-
CommentaryFSI Pro FSI Macro
-
HistoricalFSI Pro FSI Macro
- SMID Granny Shots
-
Stock ListFSI Pro FSI Macro
-
PerformanceFSI Pro FSI Macro
-
CommentaryFSI Pro FSI Macro
-
HistoricalFSI Pro FSI Macro
- Upticks
-
IntroFSI Pro FSI Macro
-
Stock ListFSI Pro FSI Macro
-
PerformanceFSI Pro FSI Macro
-
CommentaryFSI Pro FSI Macro
-
FAQFSI Pro FSI Macro
- Sector Allocation
-
IntroFSI Pro FSI Macro
-
Current OutlookFSI Pro FSI Macro
-
Prior OutlooksFSI Pro FSI Macro
-
PerformanceFSI Pro FSI Macro
-
SectorFSI Pro FSI Macro
-
ToolsFSI Pro FSI Macro
-
FAQFSI Pro FSI Macro
-
-
Crypto Picks
-
Latest Crypto Picks
- Crypto Core Strategy
-
IntroFSI Pro FSI Crypto
-
StrategyFSI Pro FSI Crypto
-
PerformanceFSI Pro FSI Crypto
-
ReportsFSI Pro FSI Crypto
-
Historical ChangesFSI Pro FSI Crypto
-
ToolsFSI Pro FSI Crypto
- Crypto Liquid Ventures
-
IntroFSI Pro FSI Crypto
-
StrategyFSI Pro FSI Crypto
-
PerformanceFSI Pro FSI Crypto
-
ReportsFSI Pro FSI Crypto
-
-
Tools
-
FSI Community
-
FSI Snapshot
-
Market Insights
-
FSI Academy
-
Book Recommedations
- Community Activities
-
Intro
-
Community Questions
-
Community Contests
-
Part 2
How Is Inflation Measured?
In the previous part of this series, we discussed what inflation is, why policy makers try to manage it, and what can happen when they fail to do so. But we skipped over an important question: how is inflation measured?
Speaking generally, inflation is measured by tracking a representative sample of the prices of various goods and services across industries. The three most commonly used trackers of inflation in the U.S. economy are the Consumer Price Index (CPI), the Producer Price Index (PPI), and the Personal Consumption Expenditures (PCE) price index.
Consumer Price Index
Perhaps the most widely known measure of inflation is the Consumer Price Index, or CPI. In fact, our Washington Policy Strategist Tom Block frequently reminds us that, outside of the fields of economics and finance, many – including members of Congress – are unaware that any other measure of inflation even exists.
CPI is calculated by the Bureau of Labor Statistics (BLS). BLS economists and employees collect sample prices for a fixed basket of goods and services, as might be purchased by the average American consumer – as many as 94,000 data points each month. The majority of these prices are obtained through personal visits to brick-and-mortar stores, with the remaining information collected through phone surveys, websites, and e-commerce apps. The BLS also collects about 8,000 instances of prices for rented housing.
The data is weighted based on consumer surveys on household-budget allocations to various categories (housing, food, fuel, travel, etc.) This weighting is adjusted roughly every two years to account for changes in spending habits, which might include the introduction of new products and services, and the obsolescence of others (e.g., landline phones, VCRs, and film processing.)
The index itself is referenced to 1982-1984 prices (so a CPI of 300 means prices are about triple their levels in 1982-84). Most observers are more interested in the rate of change, either month over month (MoM) or year over year (YoY). It is common for many investment strategists and economists to focus on Core CPI, which strips out the more volatile food and energy prices; proponents argue that Core CPI gives a truer view of how consumer prices are changing.
Detailed information about CPI can be found here: https://www.bls.gov/cpi/
Producer Price Index
As the name suggests, the PPI focuses on how inflation affects producers rather than consumers. As such, it focuses on wholesale prices rather than prices at the retail level. Like the CPI, PPI is calculated by collecting data on a basket of goods and services. The PPI basket also includes non-consumer-focused categories – raw materials, machinery, intermediate goods (e.g., components), wages, etc.
Because of its focus on producers, the PPI is viewed as a leading indicator of consumer inflation. After all, if producers see a sustained period of higher prices, it is likely that they will eventually pass those price increases on to their customers.
Detailed information about PPI can be found here: https://www.bls.gov/ppi/home.htm
Personal Consumption Expenditure (PCE) Price Index
As the name implies, PCE also measures inflation from the perspective of a consumer, just like CPI. CPI and PCE used different formulas and methodologies, and many economists believe that the PCE’s methodology allows it to more quickly reflect changes in consumer spending habits, including those made in response to inflation. For example, during instances of challenging economic conditions such as rising inflation, PCE will reflect the consumer shift from beef to chicken, a less expensive alternative, more quickly.
The two metrics use different data sources and methodologies. CPI focuses on out-of-pocket expenditures, estimated based on household surveys. PCE relies on prices paid for consumer goods or services, even if the consumer is not directly paying out of pocket. For example, PCE takes into account the total sum paid to providers (including by insurers) for healthcare services, rather than just the sum the consumer pays out of pocket. While politicians focus on the CPI, the Federal Reserve’s preferred inflation metric is PCE. Both are important for investors to track.
Consequently, while the BLS largely relies on surveys of consumers to obtain data used in CPI, the Bureau of Economic Analysis (BEA) examines data about what businesses are charging at the consumer level for various goods and services.
Detailed information about PCE can be found here: https://www.bea.gov/data/consumer-spending/main
The FS Insight Perspective on Inflation
Fundstrat Head of Research Tom Lee and his team perform regular deep dives on all three of these inflation indicators, examining not just Headline Inflation and Core Inflation, but also the individual components that go into calculating these indicators and the data that the BLS uses, getting granular whenever needed.
Consider CPI, for example. On October 12, 2023, September Core CPI came in more or less in line with Street expectations. However, when looking at the BLS’s data, Lee and his team noticed a startling detail: “The largest contributor to the rise in Sept. Core CPI was shelter,” Lee wrote in his Intraday note, “and more specifically, ‘lodging away from home,’ which is hotel stays.” This accounted for about 30% of Core CPI – a huge percentage from a single line item.
The hotel component of CPI rose +4.21% MoM – a 51% annualized rate. That is to say that from August to September, hotel prices rose at an annualized rate of 51%. “Does anyone really think hotel prices [rose that much] in September? This doesn’t make sense,” Lee argued.
So Lee put his team to work, examining not just BLS data, but also data from industry sources. They found that much of this increase had to do with a surge in hotel prices in just one place – New York City.
The team did not reach a conclusion as to why, but the working theory was that a new change in New York City regulations regarding short-term vacation rentals (think AirBnBs) caused a short-term slump in supply of temporary lodgings, and thus an increase in demand for hotel rooms. The FS Insight team also suggested that this increased demand might have been exacerbated by an influx of migrants being housed in hotels.The cause was unimportant in this context: Lee and his team correctly concluded that the Federal Reserve was unlikely to hike rates in November and December due to what turned out to be a spike in NYC hotel prices, and that consequently, that markets could rise into the end of 2023.
In our next installment, we will discuss some causes and contributing factors of high inflation, and what policymakers can do in response.

Related Guides
-
 Series of 3~11 minutesLast updated3 years ago
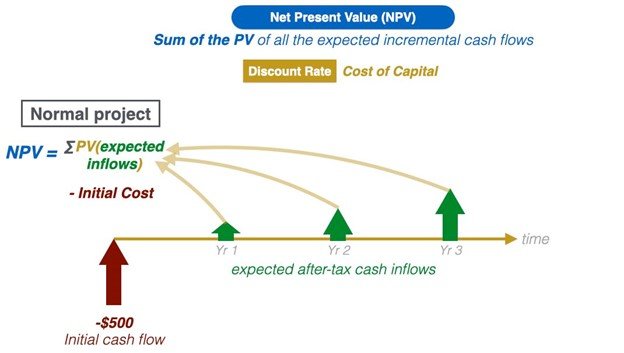
Understanding Net Present Value and The Basics of Discounted Cash Flow Models (DCF)
Acquaint yourself with the basics of net present value and discounted cash flow (DCF) models.
-
 Series of 6~12 minutesLast updated3 years ago
Introduction to Hedging
In this guide, we will cover the basics of hedging, what is hedging and what is the user for it.
-
 Series of 8~27 minutesLast updated2 years ago
Bitcoin Guide
Is it a good time to get in? How much should I invest?
-
 Series of 5~21 minutesLast updated3 years ago
The VIX Series
What is the VIX? What does it indicate? How can I use it to improve my strategies?