-
Research
-
Latest Research
-
Latest VideosFSI Pro FSI Macro FSI Crypto
- Tom Lee, CFA AC
-
First WordFSI Pro FSI Macro
-
Intraday WordFSI Pro FSI Macro
-
Macro Minute VideoFSI Pro FSI Macro
-
OutlooksFSI Pro FSI Macro
- Mark L. Newton, CMT AC
-
Daily Technical StrategyFSI Pro FSI Macro
-
Live Technical Stock AnalysisFSI Pro FSI Macro
-
OutlooksFSI Pro FSI Macro
- L . Thomas Block
-
US PolicyFSI Pro FSI Macro
- Market Intelligence
-
Your Weekly RoadmapFSI Pro FSI Macro FSI Weekly
-
First to MarketFSI Pro FSI Macro
-
Signal From Noise
-
Earnings DailyFSI Pro FSI Macro FSI Weekly
-
Fed WatchFSI Pro FSI Macro
- Crypto Research
-
StrategyFSI Pro FSI Crypto
-
Market UpdateFSI Pro FSI Crypto
-
Funding FridaysFSI Pro FSI Crypto
-
ConceptsFSI Pro FSI Crypto
-
CommentsFSI Pro FSI Crypto
-
Liquid VenturesFSI Pro FSI Crypto
-
Deep ResearchFSI Pro FSI Crypto
-
MiscellaneousFSI Pro FSI Crypto
-
DeFi DigestFSI Pro FSI Crypto
-
Technical AnalysisFSI Pro FSI Crypto
-
-
Webinars & More
- Webinars
-
Latest WebinarsFSI Pro FSI Macro FSI Crypto
-
Market OutlookFSI Pro FSI Macro FSI Crypto
-
Granny ShotsFSI Pro FSI Macro FSI Crypto
-
Technical StrategyFSI Pro FSI Macro FSI Crypto
-
CryptoFSI Pro FSI Macro FSI Crypto
-
Special GuestFSI Pro FSI Macro FSI Crypto
- Media Appearances
-
Latest Appearances
-
Tom Lee, CFA AC
-
Mark L. Newton, CMT AC
-
Sean Farrell AC
-
L . Thomas Block
-
⚡FlashInsights
-
Stock Lists
-
Latest Stock Lists
- Super and Sleeper Grannies
-
Stock ListFSI Pro FSI Macro
-
CommentaryFSI Pro FSI Macro
-
HistoricalFSI Pro FSI Macro
- SMID Granny Shots
-
Stock ListFSI Pro FSI Macro
-
PerformanceFSI Pro FSI Macro
-
CommentaryFSI Pro FSI Macro
-
HistoricalFSI Pro FSI Macro
- Upticks
-
IntroFSI Pro FSI Macro
-
Stock ListFSI Pro FSI Macro
-
PerformanceFSI Pro FSI Macro
-
CommentaryFSI Pro FSI Macro
-
FAQFSI Pro FSI Macro
- Sector Allocation
-
IntroFSI Pro FSI Macro
-
Current OutlookFSI Pro FSI Macro
-
Prior OutlooksFSI Pro FSI Macro
-
PerformanceFSI Pro FSI Macro
-
SectorFSI Pro FSI Macro
-
ToolsFSI Pro FSI Macro
-
FAQFSI Pro FSI Macro
-
-
Crypto Picks
-
Latest Crypto Picks
- Crypto Core Strategy
-
IntroFSI Pro FSI Crypto
-
StrategyFSI Pro FSI Crypto
-
PerformanceFSI Pro FSI Crypto
-
ReportsFSI Pro FSI Crypto
-
Historical ChangesFSI Pro FSI Crypto
-
ToolsFSI Pro FSI Crypto
- Crypto Liquid Ventures
-
IntroFSI Pro FSI Crypto
-
StrategyFSI Pro FSI Crypto
-
PerformanceFSI Pro FSI Crypto
-
ReportsFSI Pro FSI Crypto
-
-
Tools
-
FSI Community
-
FSI Snapshot
-
Market Insights
-
FSI Academy
-
Book Recommedations
- Community Activities
-
Intro
-
Community Questions
-
Community Contests
-
Part 1
What Is The VIX And How Does It Work?
“A good forecaster is not smarter than everyone else, he merely has his ignorance better organized.”
-Anonymous
This recent crisis saw the Chicago Board Options Exchange (CBOE) Volatility Index closing at its highest level in history, above $82. But, many may ask themselves what is the VIX? What does a closing reading of 82 even mean?! This is the highest closing reading for stock market volatility ever. The market has now retraced all of its losses since that time and made a new all-time high (ATH). However, due to the uncertainty associated with COVID-19, VIX levels remain elevated relative to historic norms. We believe they will soon decline to levels that will attract a lot of the $5 trillion in capital on the sidelines.
One of the reasons investors are so skittish is because of the extraordinary pace of the virus-driven drop in March. The market lost a lot quicker, but as we predicted in the heat of the March lows, a ‘V-shaped’ stock market recovery would follow and we would soon retrace and even achieve new highs. Still, the VIX recently hit levels higher than it has ever in its now substantial history, and once you know what the VIX actually means, it may seem even more peculiar to you.
This extraordinary number, shown above, surpassed even the highest close during the financial crisis. You might have heard of the Volatility Index, or VIX as it’s known by shorthand; most investors know that they at least see it flashing higher when things go bad. However, the VIX is an important market signal to understand. We would like to make it an even more valuable tool during a time of high uncertainty. What does the number mean? If the VIX is at 25 today and let’s say the market is at 100 (for ease), then the stock market believes within a 68% confidence level that the market will be within $75 and $125 in 1 month. This is what the VIX tells us, and though it cannot predict the future, the action in options markets is often predictive.
What is market volatility?
What is market volatility? What is market noise, and are they different? How can we tell when it’s just normal volatility or a secular directional change? In statistics, noise is irrelevant data, and signals are the pieces of information that illuminate truth. In this spirit, our Chief Editor Vito Raccaneli runs a column called “Signals From The Noise” in which he regularly provides single name stock picks with actionable price targets and unlike many competitors, a section where he candidly explains where he could be wrong. For those concerned about market volatility he also ran a superb webinar on using covered calls, the lowest risk derivative strategy that all stock-owners should know, to help stabilize returns and income during periods of heightened uncertainty like we currently face. Many different data are continually being assessed by investors and the machines that do their bidding. Option prices have proven one of the most significant pieces of this information in managing risk.
There are so many different index options these days, but perhaps none is as famous and ominous as Wall Street’s well-known ‘fear index’. We’ve all heard fear index, and we all know the VIX goes up when things are volatile, but what is the VIX, exactly? Most of the constant flow of information is nothing but noise, however, buried deep within these copious data points, and headlines are hints to what will happen in the future. We have to determine which is more critical when selecting the important signals from the noise—deciding which is signal and which is noise is what makes the difference between who makes money and who loses money. Luckily, over the past decades, new and exciting tools like VIX have proliferated, which calculated the implied volatility of S&P 500 index options to arrive at a number that expresses implied volatility. This number should now be less ‘noisy’ to you. You cannot buy the VIX index because it is interpolated from a wide range of strike prices on the stock market. It is literally the market’s expectation of 30-day volatility for the broader index based on the difference between put options and call options.
Mohammed El Erian, in his 2007 book When Markets Collide, recounts the story of a trader he started working for in London who had a higher level of ‘street smarts’ than some of the other newer analysts at the time, including El-Erian. On average, market days, he would regularly solicit the fundamental-driven views of the better-studied analysts. On days when the market was experiencing turmoil, he would instruct all the newbies, sometimes aggressively, to stay as far away from his desk as possible to avoid becoming confused by some fundamental analysis that was irrelevant to the days’ exciting market action. This trader, it appears, was trying to keep the noise out. Even though, under different circumstances, that noise might have been useful information. Unfortunately, much of this comes down to experience, training, and a firm grasp of financial mathematics. If you’re new to investing, you could probably use a little understanding of things like volatility and how to hedge against it.
Even if you’re a veteran investor you may still find yourself wondering what is the VIX? We bet you could use a little refresher on volatility and some of the most popular ways it is measured. We have written this piece for all skill levels. Hopefully, we can help turn the famous Volatility Index, widely known at perhaps a disservice to the investor, as the market’s fear gauge. It would probably make a little more sense to most investors if you called the VIX what it is, the 30 day implied volatility of the S&P 500. This is where it gets its gloomy moniker because implied volatility is measured in the price of options on the most important index. Generally, people want to purchase put options when uncertainty, or fear of an unknown outcome, is higher.
Related Guides
-
Series of 3~15 minutesLast updated11 months ago
Inflation – What’s All the Fuss About?
A multi-part series about inflation and its impact on stock investors.
-
Series of 3~11 minutesLast updated2 years ago
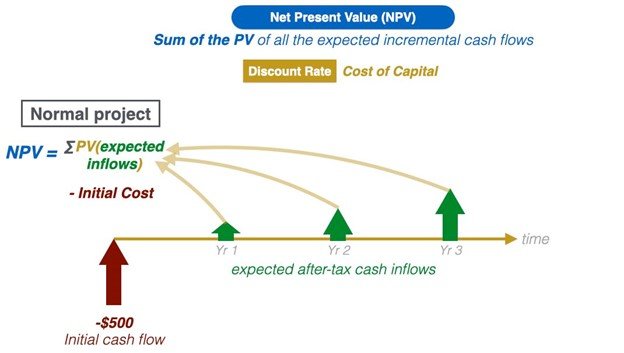
Understanding Net Present Value and The Basics of Discounted Cash Flow Models (DCF)
Acquaint yourself with the basics of net present value and discounted cash flow (DCF) models.
-
Series of 6~12 minutesLast updated2 years ago
Introduction to Hedging
In this guide, we will cover the basics of hedging, what is hedging and what is the user for it.
-
Series of 8~27 minutesLast updated1 year ago
Bitcoin Guide
Is it a good time to get in? How much should I invest?