


-
Research
-
Latest Research
-
Latest VideosFSI Pro FSI Macro FSI Crypto
- Tom Lee, CFA AC
-
First WordFSI Pro FSI Macro
-
Intraday WordFSI Pro FSI Macro
-
Macro Minute VideoFSI Pro FSI Macro
-
OutlooksFSI Pro FSI Macro
- Mark L. Newton, CMT AC
-
Daily Technical StrategyFSI Pro FSI Macro
-
Live Technical Stock AnalysisFSI Pro FSI Macro
-
OutlooksFSI Pro FSI Macro
- L . Thomas Block
-
US PolicyFSI Pro FSI Macro
- Market Intelligence
-
Your Weekly RoadmapFSI Pro FSI Macro FSI Weekly
-
First to MarketFSI Pro FSI Macro
-
Signal From Noise
-
Earnings DailyFSI Pro FSI Macro FSI Weekly
-
Fed WatchFSI Pro FSI Macro
- Crypto Research
-
StrategyFSI Pro FSI Crypto
-
CommentsFSI Pro FSI Crypto
-
Funding FridaysFSI Pro FSI Crypto
-
Liquid VenturesFSI Pro FSI Crypto
-
Deep ResearchFSI Pro FSI Crypto
-
-
Webinars & More
- Webinars
-
Latest WebinarsFSI Pro FSI Macro FSI Crypto
-
Market OutlookFSI Pro FSI Macro FSI Crypto
-
Granny ShotsFSI Pro FSI Macro FSI Crypto
-
Technical StrategyFSI Pro FSI Macro FSI Crypto
-
CryptoFSI Pro FSI Macro FSI Crypto
-
Special GuestFSI Pro FSI Macro FSI Crypto
- Media Appearances
-
Latest Appearances
-
Tom Lee, CFA AC
-
Mark L. Newton, CMT AC
-
Sean Farrell AC
-
L . Thomas Block
-
⚡FlashInsights
-
Stock Lists
-
Latest Stock Lists
- Super and Sleeper Grannies
-
Stock ListFSI Pro FSI Macro
-
CommentaryFSI Pro FSI Macro
-
HistoricalFSI Pro FSI Macro
- SMID Granny Shots
-
Stock ListFSI Pro FSI Macro
-
PerformanceFSI Pro FSI Macro
-
CommentaryFSI Pro FSI Macro
-
HistoricalFSI Pro FSI Macro
- Upticks
-
IntroFSI Pro FSI Macro
-
Stock ListFSI Pro FSI Macro
-
PerformanceFSI Pro FSI Macro
-
CommentaryFSI Pro FSI Macro
-
FAQFSI Pro FSI Macro
- Sector Allocation
-
IntroFSI Pro FSI Macro
-
Current OutlookFSI Pro FSI Macro
-
Prior OutlooksFSI Pro FSI Macro
-
PerformanceFSI Pro FSI Macro
-
SectorFSI Pro FSI Macro
-
ToolsFSI Pro FSI Macro
-
FAQFSI Pro FSI Macro
-
-
Crypto Picks
-
Latest Crypto Picks
- Crypto Core Strategy
-
IntroFSI Pro FSI Crypto
-
StrategyFSI Pro FSI Crypto
-
PerformanceFSI Pro FSI Crypto
-
ReportsFSI Pro FSI Crypto
-
Historical ChangesFSI Pro FSI Crypto
-
ToolsFSI Pro FSI Crypto
- Crypto Liquid Ventures
-
IntroFSI Pro FSI Crypto
-
StrategyFSI Pro FSI Crypto
-
PerformanceFSI Pro FSI Crypto
-
ReportsFSI Pro FSI Crypto
-
-
Tools
-
FSI Community
-
FSI Snapshot
-
Market Insights
-
FSI Academy
-
Book Recommedations
- Community Activities
-
Intro
-
Community Questions
-
Community Contests
-
Part 3
How To Trade (And Read) The CBOE Volatility Index (VIX)
Trading VIX futures and VIX options can be incredibly difficult. Technically, the CBOE Volatility Index should represent one standard deviation of market returns for whatever period an index is calculating within a 68% confidence interval. If you were to increase the confidence interval, the number would also increase, for example, a VIX reading of 22 would be higher with a 96% or 99% confidence interval. The main CBOE Volatility Index calculates 30 calendar days of implied volatility and interpolates options between 23 days and 37 days to expiry (remember not how it’s settled!). The spot price of the VIX is calculated on a minute to minute basis to keep up with the fast-paced markets. The CBOE Volatility Index is not an ETF, and it cannot be bought and sold, only futures and options contracts that derive their value from its price and time to expiry can be purchased. The index value acts as price mechanism, so if your strike price is $15 and the VIX is at $20 then your option’s intrinsic value would be $5. Of course, in a real situation the intrinsic value would be supplemented by time value, the longer until expiry, the higher the time value.
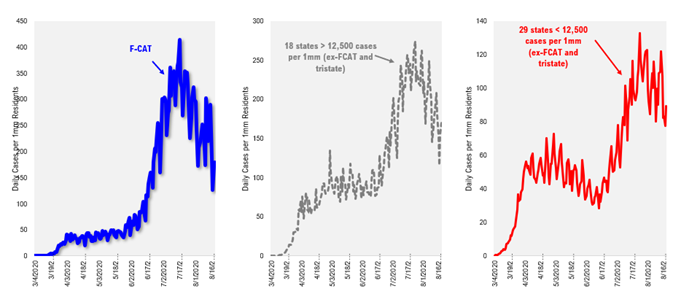
Trading volatility is hard though. Especially in times like these when market movement may be dependent on completely exogenous data, like how we have all had to become amateur epidemiologists to have any hope of investing success on shorter time horizons. However, if you have the stomach for it, then we will certainly be able to help you. These charts above show some of the in-depth analysis and monitoring of virus data that we do every single day for our clients. As you can see, based on our previous analysis of the infection curve in the New York/Tri-state outbreak, which caused the stock market collapse in March, we see a different narrative developing around where cases will go then is being represented in the wider media. There is no conspiratorial allegation here, we simply think we do data analysis of the highest efficacy that often exceeds what is available to much of the mainstream public. We crunch the numbers on virus data every day, keep our eye out for discrepancies, and provide timely and actionable advice to our members.
Since the index is made of options instead of stocks, which makes things a little bit different, similarly to other indexes, options, not commodities, are selected by rules to make up the wider index. The actual components of the VIX are the near and next-term SPX options. In fact, because of how the VIX needs to roll-over based on its rules the number of options used to calculate the VIX may change from day to day or even minute to minute, particularly since traders can game it a little bit by bidding zero on a strike price and therefore getting excluded from the index at that moment since zero bid/asks are not able to be used in the formula.
Volatility Term Structure: Getting Signals From CBOE VIX
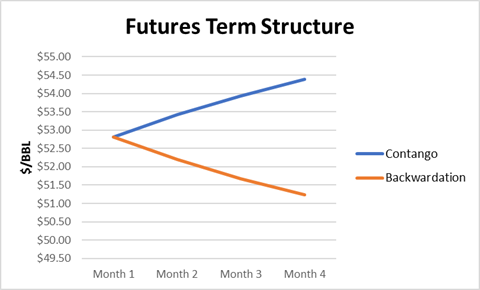
There are robust futures markets for the CBOE Volatility Index. Futures contracts create curves similar to interest rate curves (think T-cure) which can tell us quite a lot about anticipated index value. The properties of these markets can tell us a lot about how markets perceive the future, particularly in the event of an ongoing disaster. For instance, during the panicked selling in March when the VIX reached highs its curve was in backwardation which happens rarely in times of great tumult. This means that the market expects more volatility in the near term than the short-term. If you picture a curve of VIX futures going out into the future like an interest rate curve, that is how the term structure usually is shaped; in contango.
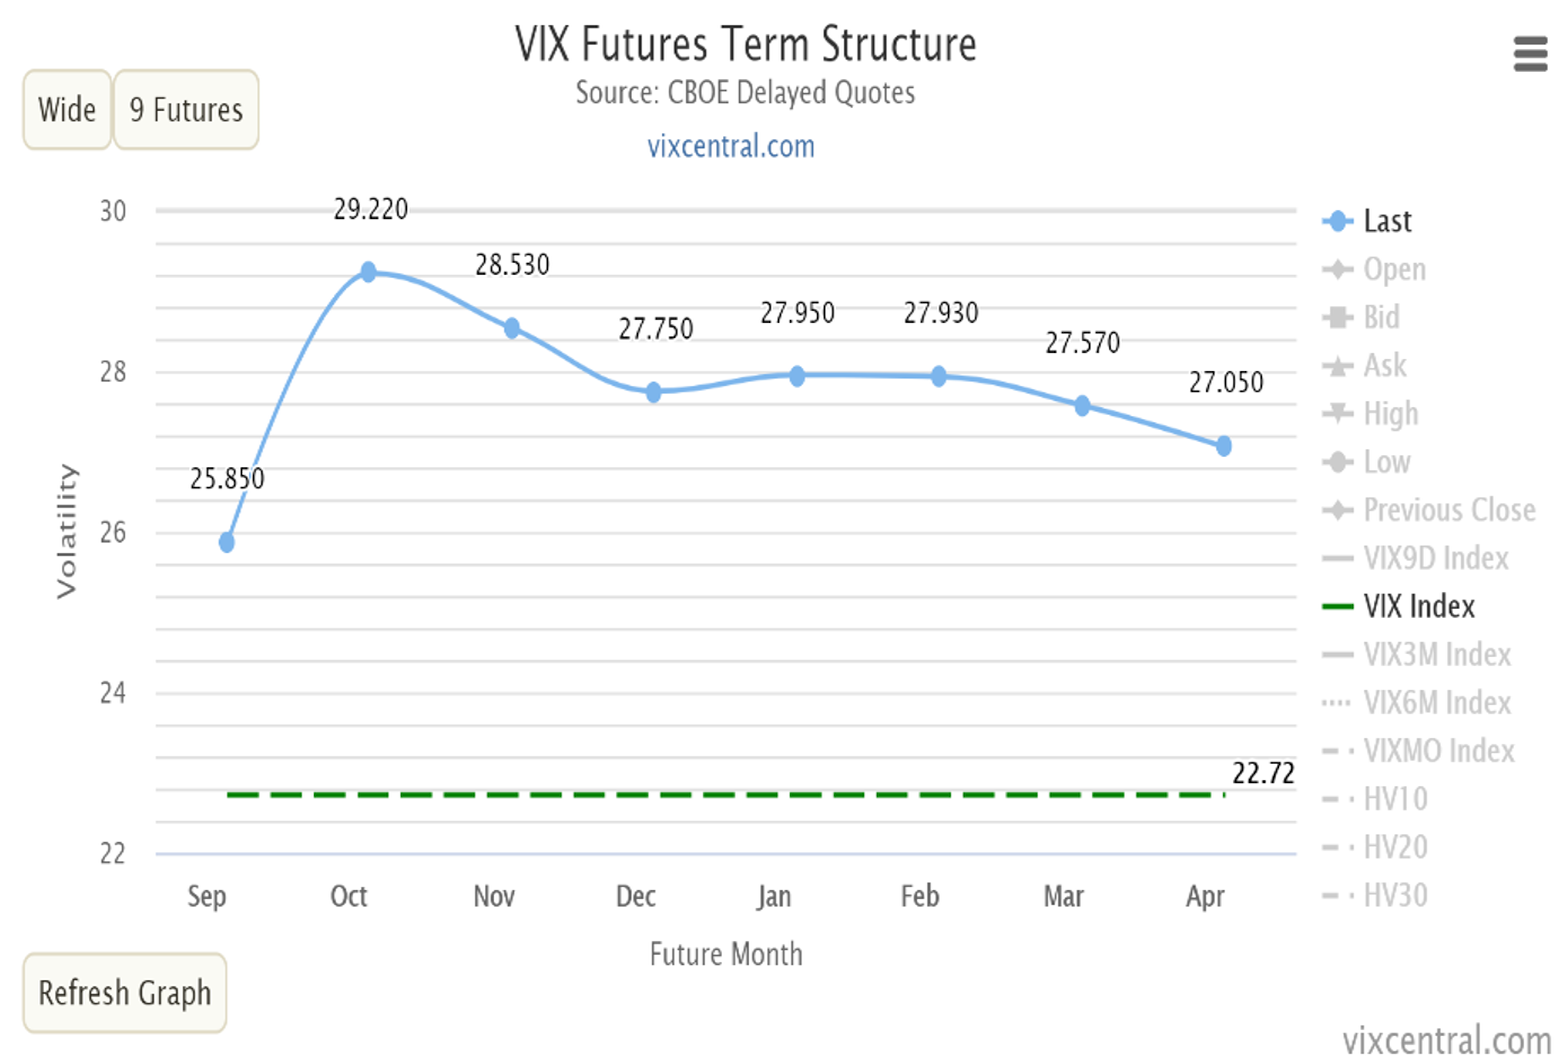
This means the market, as would be generally the case, would expect more volatility as time goes on. Since the rise in stock prices further out maturities like Dec 20 and Jan 21 have started to normalize, but the VIX curve still shows potential for elevated risk around the election, which is also normal. When the VIX goes into full and normalized contango again, it will be a very positive sign for markets. Generally when $VIX.X goes below $20 it is also considered a bullish market indicator.
Stock returns have been observed over time to negatively correlated with realized volatility and positively correlated with implied volatility. One thing you can do is get into the weeds and calculate a volatility index of some of your favorite stocks and then compare the volatility term structures to see how they diverge and how they are similar. There are also many new ETFs and ETNs that own primarily, or partially a lot of volatility assets.

Related Guides
-
 Series of 3~15 minutesLast updated1 year ago
Inflation – What’s All the Fuss About?
A multi-part series about inflation and its impact on stock investors.
-
 Series of 3~11 minutesLast updated3 years ago
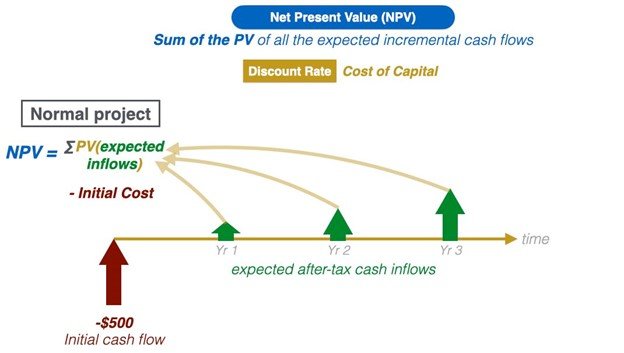
Understanding Net Present Value and The Basics of Discounted Cash Flow Models (DCF)
Acquaint yourself with the basics of net present value and discounted cash flow (DCF) models.
-
 Series of 6~12 minutesLast updated3 years ago
Introduction to Hedging
In this guide, we will cover the basics of hedging, what is hedging and what is the user for it.
-
 Series of 8~27 minutesLast updated2 years ago
Bitcoin Guide
Is it a good time to get in? How much should I invest?