‘Smart Money’ Vs. ‘Dumb Money’?; Both Buying Stocks
1 and can accesss 1
In this strategy briefing… |
FS Insight Investment Views
|
Your Weekly Roadmap
‘Smart Money’ Vs. ‘Dumb Money’?; Both Buying Stocks
Who you gonna believe, smart money or dumb money?
There are times when the trading activity of smart money—that is, institutional investors, hedge funds and that illustrious ilk—differs markedly from the dumb money. On Wall Street, the latter is the less than respectful way the pros refer to the retail investor, and it has always reminded me of the great book, “Where are the Customers’ Yachts.” (The title refers to a story about a visitor to New York who admired the yachts of the brokers. Naively, he asked where all the customers’ yachts were? But none could afford yachts though—or because—they followed their brokers’ advice.)
The smart money indicator, as traditionally interpreted, says that the emotional ‘dumb’ money tends to trade in the morning, typically at the open, while the more measured ‘smart’ money waits until the end of the day to make moves. It’s trend-based view of intraday price patterns demonstrating investors’ sentiment. It was popularized by money manager Don Hays.
The main idea is that the majority of traders (emotional, news-driven) overreact at the beginning of the trading day because of the overnight news and economic data. There is also a lot of buying on market orders and short covering at the opening. Smart, experienced investors start trading closer to the end of the day, after having the opportunity to evaluate market performance.
If smart money is buying an asset and dumb money is selling, the pros take that as a bullish sign. The inverse is taken as a bearish sign.
You might or might not agree with that, but there’s a contrarian logic there. But what does it mean when they are both buying? That’s the case in 2019, according to data from Bespoke Investment Group.
For BIG, “dumb money” is considered to be the more reactive traders/investors who trade based on the headlines right at the open. Conversely, the more thoughtful “smart money” waits for things to shake out before acting. In order to track the sentiment of each group and make comparisons, BIG considers the dumb money to be the market’s action during the first half hour of the trading day, while the last hour of the trading day is representative of the smart money.
Let’s start with the latter, since they are supposed to be so smart. What are they doing with equities? In short, they are buying.
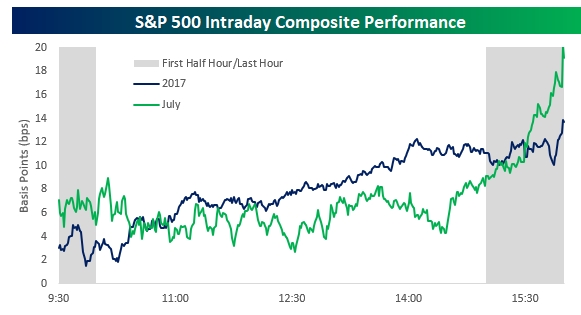
In a recent report, BIG notes that in 2019 there has been a consistent trend of buying in the last hour of trading and that’s continued into the first half of July. The S&P 500 index’s average last hour gain of 11 basis points as of mid-July is nearly twice the average of any other hourly interval.
The chart nearby shows a composite of the S&P 500’s intraday performance in 2019 (blue line) and so far in July through 7/16 (green line). As shown in the chart, the last hour of trading has been positive both on a year to date and month to date basis. That kind of strength into the close is generally considered a positive trend as it indicates a willingness on the part of investors to tolerate the overnight risk of any potential negative headlines. That’s even more impressive these days given all the potential issues swirling around out there, BIG says.
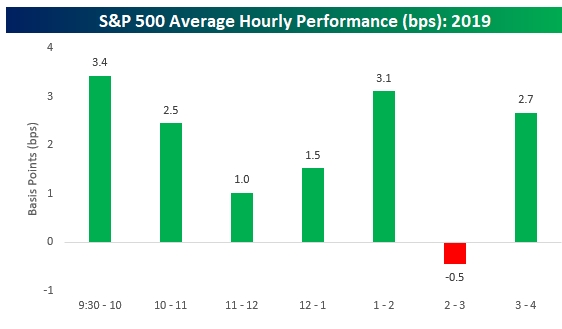
The chart below breaks out the intraday performance of the S&P 500 on an hourly basis throughout the trading day so far in 2019. For the entire year, performance has been strong nearly throughout the day.
You can see that the so-called “dumb money” has been buying too, at the open. The strongest interval of the day has been the opening half-hour with an average gain of 3.4 basis points, and the only hour of the day that has averaged a decline is the hour from 2-3PM Eastern time. From there, though, the bulls have stepped in during the last hour of the day and the rally reaccelerates.
To me, this suggests that—as our team has been saying on this website—that it’s rally on for stocks. I’ll be watching for what the so-called smart money does, and if they begin to sell en masse, it would be a negative sign, especially if “dumb money” kept on buying.
Last week, the Standard & Poor’s 500 index closed at 2,932, down 3.1%.
Quote of the Week: WSJ: An [Instagram] ‘LIKE’ has value beyond its function as a digital ego stroke.
Questions? Contact Vito J. Racanelli at vito.racanelli@fsinsight.com or 212 293 7137. Or go to www.fsinsight.com.
Tom Lee's Equity Strategy
The Fed Cut and Trump Tariff are fueling the "asset light" trade
It seems these days the markets are a broken record. The latest, confusing Fed cut (was it dovish? hawkish? we think somewhere in between), coupled with Trump’s latest tariff announcement and a 2.4% drop in the S&P 500 over two days is a scenario that should no longer surprise markets. But yet again we have seen a resulting surge in bearish sentiment and confidence levels appropriate for an economy in late-cycle (which it’s not).
There are three macro factors that belie this reborn market bearishness and support further upside for equities.
i. Falling 10-year yield
ii. Weakening USD
iii. Odds of a rate cut in September have risen to 100%
Remember folks, since 2009, with rare exceptions, pullbacks NEED TO BE BOUGHT. What to buy? Here are the four trades that this Fed cut supports: i) Overweight US vs. rest of world; ii) asset-light stocks over asset-heavy stocks; iii) large caps; iv) cyclicals over defensives.
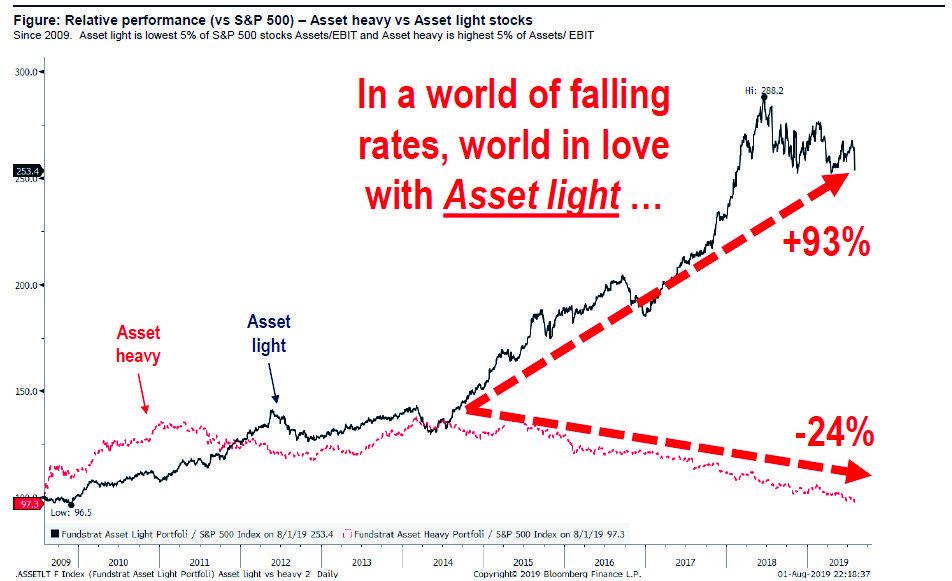
The Fed cut is especially adding gasoline to asset-light stocks because it is further cementing the market belief that interest rates can only fall lower, which makes asset heavy businesses less attractive to investors. And by the way, we define asset-light stocks as those with low assets to EBIT (earnings before interest and tax expenses).
Need proof? Since 2015 our asset-light index, composed of 5% of stocks from the S&P 500 with the lowest assets to EBIT ratio outperformed our asset-heavy index (5% of stocks from S&P 500 with highest assets to EBIT ratio) by 11,070 basis points! See chart below.
The question to consider though is how much longer this trade can continue. We believe the asset-light trade will jump the shark when the market is convinced interest rates will stay low forever. But here’s the secret. “Forever” is a dangerous word in markets and we believe reflationary conditions will resurface in 2020 for two reasons.
First, we’ve witnessed the recent steepening of the long-term yield curve (30Y-10Y) and this has led the ISM Manufacturing Index by 16 months. So, expect ISM to bottom sometime in late 2019 at 48 (was 51.2 in July). Second, we expect labor markets to tighten in 2020. Hence, asset-heavy stocks should start working again in 2020.
What could go wrong? Markets do not like trade wars and China could escalate tensions.
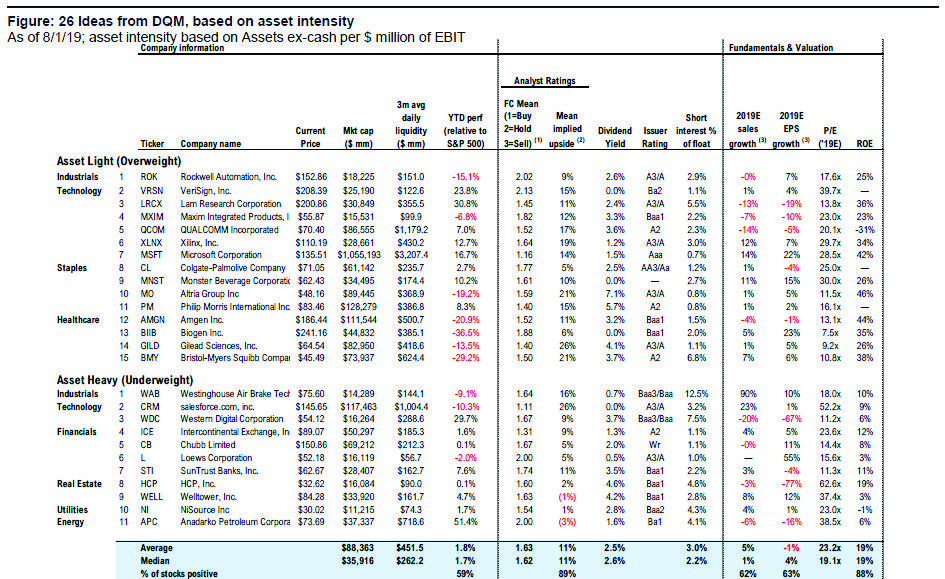
Bottom line: We remind investors that 2019 is the strongest YTD gains for markets since BEFORE 2009. And we see falling 10-yr and weakening USD and higher odds of a September cut as VERY BULLISH—hence, we strongly urge investors to take advantage of this weakness. For now, we believe Fed is adding gasoline to support the trades that are working in 2019 (now new regime) and especially asset light stocks. We have identified 15 “asset light” stocks which are top decile of asset light + DQM ranked 1 and 11 underweights which are “asset heavy” and DQM ranked 5. The OW tickers are ROK, VRSN, LRCX, MXIM, QCOM, XLNX, MSFT, CL, MNST, MO, PM, AMGN, BIIB, GILD, BMY, while the UW tickers are WAB, CRM, WDC, JPM, ICE, CB, L, STI, HCP, WELL, NI.
Fed Watch
Read my lips. No more rate cuts!
On Wednesday, the Federal Open Market Committee (FOMC) cut the target for its overnight lending rate by 25 bps to a range of 2% to 2.25%. Investors widely expected this cut, but oh boy did Powell leave them wanting more. Asked if he was tamping down expectations for further rate cuts, he asserted, “Let me be clear. What I said was it’s not the beginning of a long series of rate cuts.” To his credit, this is a show of atypical transparency by our usually opaque Fed overlords who may not want markets pricing in additional easing. But, is it just us, or does this comment remind anyone of George Bush Sr.’s infamous words spoken at the 1988 Republican National Convention: “Read my lips, no new taxes!”?
If this isn’t the start of a rate-cutting cycle, what is it? Well, our own Tom Lee has been writing that the US economy is in mid-cycle, not late-cycle since the start of the year and Powell agrees…”We’re thinking of it as essentially in the nature of a mid-cycle adjustment to policy.” So there it is folks, a mid-cycle adjustment to support the economy’s current expansion, and confirmation that Tom’s macro call has been right all along.
Still, if in fact this economy is in mid-cycle, the question we must ask is whether such a policy action was justified, or if Trump has succeeded in bending Fed policy to his will. The stated justification (which came prior to the latest tariff announcement) was weak global growth, trade policy uncertainty, a slowdown in business investment, and inflation below the usual 2% target. Yet according to our analysis and the analysis by the Fed, the US economy is in the middle of an economic expansion.
Thus, these are elements which threaten that expansion. As we wrote last week, members of the Fed have openly stated that the FOMC must now anticipate economic weakness rather than react to it. Given Trump’s announcement on Thursday that an additional 10% tariff will be hitting ~$300 billion of Chinese goods, the cut may have helped soften the market’s reaction.
The problem is that this philosophical shift in the Fed’s approach to policy, if genuine, is concerning because history is rife with predictions that show that most economists, even those employed in the Marriner S. Eccles building, are notably poor forecasters.
Perhaps even more concerning though is that the self-directed mandate to anticipate is also a very good mask for a politicized Fed to hide behind. Rather than admit to political influences (i.e. Trump tweets), the FOMC can now point to potential threats to the economy which require policy adjustments to mitigate.
How the Fed acts in the coming months will hinge on economic events outside of their control such as trade negotiations, economies ex. US, and other central bank actions. To paraphrase George Bush Sr., it was just on Wednesday that Powell said, “Read my lips, no more rate cuts.” Well it doesn’t seem the market believes him, particularly in light of the coming tariffs in September. CME Fed futures are showing 88% probability of another cut at the next FOMC meeting in September.
The 10-year Treasury note yield closed Thursday at 1.87% versus 2.08% the Thursday before. As noted above, CME Fed futures currently places 83% probability of another cut at the next FOMC meeting in September. Our Policy Analyst Tom Block disagrees, believing rate policy will remain unchanged through year-end.
Upcoming: 8/17-18 – FOMC meeting.
Recommended Stock Ideas
Focus Insight Stock List - Week 31
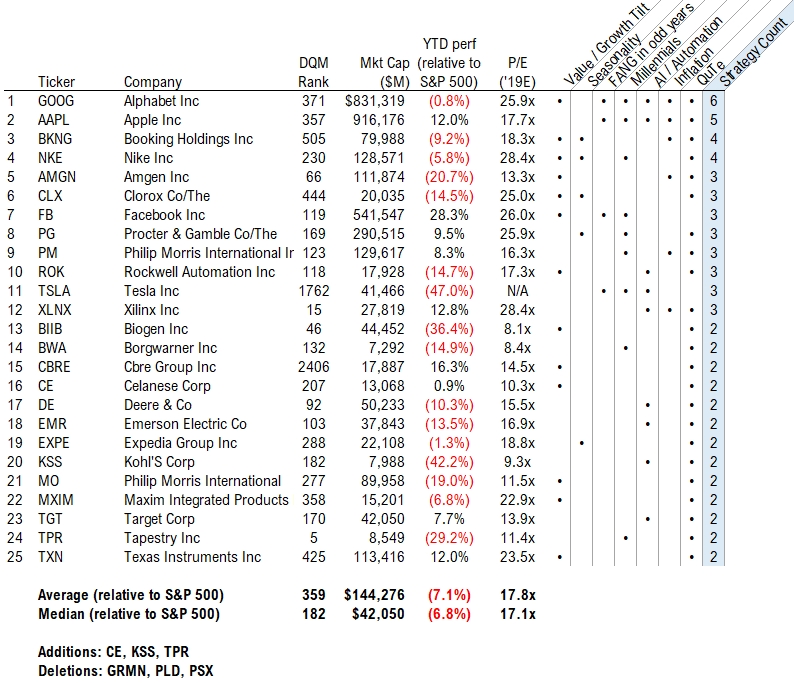
Below we’ve highlighted the FocuS stocks that we recommend across at least two of our investment strategies for 2019.
Figure: Focus Insight Stock List
As of 08/01/19, source: FS Insight, Factset
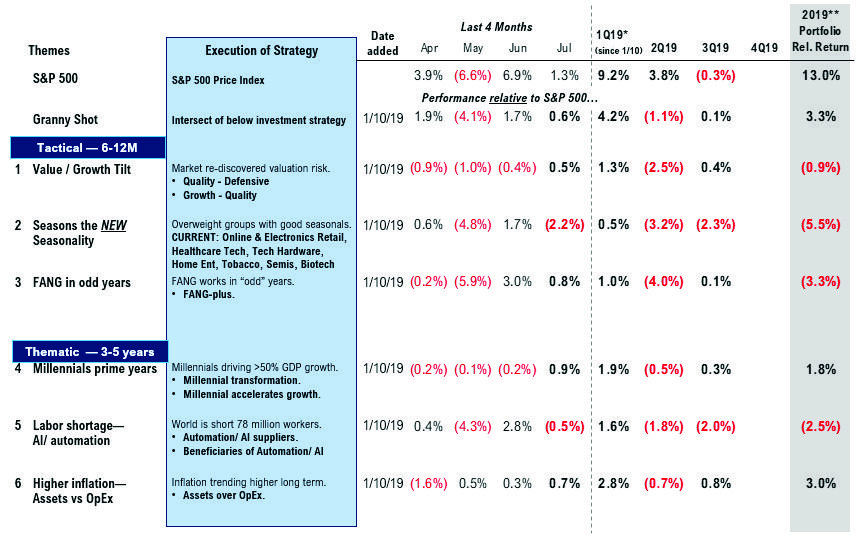
The Focus Portfolio underperformed the S&P 500 by 710 bps since its inception.
Technical Strategy
Another look back at 2016 as a guide through Q3 weakness
This week’s market sell-off on renewed tariff concerns has understandably alarmed investors to reduce risk and seek safety.
However, what I find interesting technically is that this risk-off move continues to track the 2016 market cycle surprisingly well and suggests the correction window will likely be short-lived.
As readers here may recall, the 2016 roadmap was an excellent guide navigating the ebb and flow through late Q1 into early Q3. Until I see the technical data notably diverge, the 2016 analog should prove helpful through YE into 2020.
Let’s compare the current technical Q3 set-up with Q3 2016 and think about what it might mean for the S&P through year-end. In the summer of 2016, the S&P made marginal new highs only to begin a correction in August (sound familiar?) that conveniently bottomed in at the 40-week (200-day) moving average.
A similar correction this Q3 would imply a pullback toward 2780 (-5%) which is also near support at the Q2 lows of 2728. In addition, the proprietary momentum indicator in the bottom panel, tracking the percentage of S&P 500 stocks with positive weekly momentum, is also following the Q3 2016 pattern peaking just above 50%. (See below.)
I’ll be looking for this indicator to unwind back to oversold territory over the coming 6- 8 weeks, which, and I’m speculating of course, could be just the right amount of time to resolve the tariff dispute.
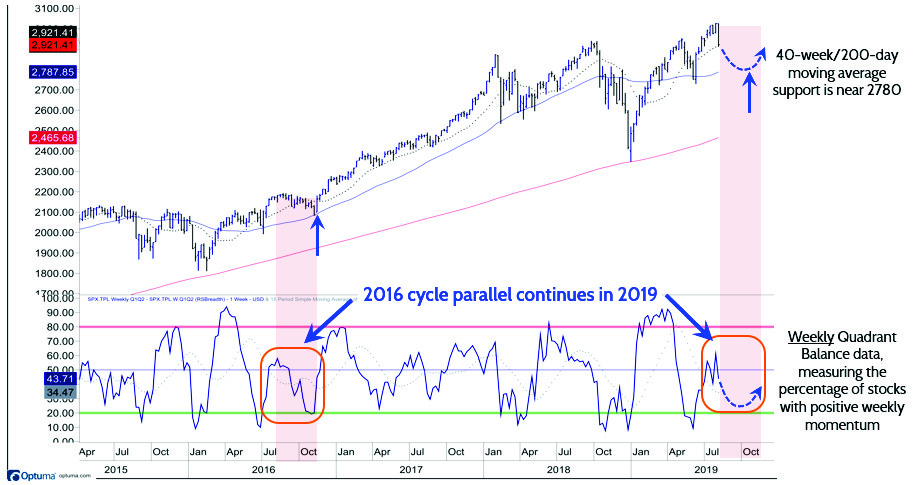
Weekly momentum oscillator continues to track 2016 cycle suggesting shallow seasonal pullback into late Q3-early Q4)
Source: FS Insight, Bloomberg, Optuma
So, as unnerving as this week’s market weakness feels, my expectation is that the S&P will track a similar path through the seasonally weak Q3 as it did in 2016. I fully appreciate many of you may be skeptical of such a simple analogy, but so far, the longerterm, multi-year market cycle remains bullish, with seasonal weakness in Q3 fairly common.
Bottom line: Remain patient through the current pullback and be prepared to add to add more cyclical exposure later in Q3 and early Q4.
US Policy
Budget deal approved; US-China Trade Tensions Worsen with One Trump Tweet
Well, they did it. The House and Senate have finally given approval to the two-year budget and debt ceiling bill. It’s now in the President’s hands for his signature while the legislature is on holiday until Labor Day. The budget and debt deal removes the threat of a government default and allows the Treasury to resume normal debt financing operations. The budget agreement establishes spending ceilings but does not actually appropriate money to fund the government for the new fiscal year that begins October
1. That piece must be done with specific appropriations for each department of
government.
It is the failure to pass these appropriations that have caused the government shutdowns, and therefore there is still the risk of a shutdown in the fall. Gulp. However, with or without the drama of a shutdown threat, spending bills will pass and the government will be injecting the economy with increased defense and non-defense spending because of the raised debt ceiling. Net-net, this is a positive development for the economy.
US-China trade negotiations in Beijing ended with no break-through this past week. Nothing too terrible about that though, right? There were no signs of serious tensions between either trade party and there were also plans for talks to resume in September.
So much to the market’s surprise, on Thursday the President announced that he was placing a 10% tariff on an additional $300 billion of Chinese goods entering the American market. It is hard to imagine that the Chinese won’t be reacting with some retaliatory action in the next few days.
With some promise of expanded food sales to China, and the possibility of the US granting limited new licenses to Huawei, these trade threats remain up in the air. The President appears to take these actions without a plan for the next step, hence everyone will wait to see how the talks between the two global economic superpowers’ progress.
While the President is taking a tough stance with the Chinese on trade, he seems indifferent to the missile tests by the North Koreans, dismissing them as “short range”. These “short range” missiles may not be able to hit the US, but South Korea and Japan (US allies) are within North Korea’s missile range, and the implications for this threat seems to be acceptable. It is yet another demonstration of how the heightened risk in that area and shows the Trump Administration must weigh its options with both friends and foes alike.
More from the author
Articles Read 2/2
🎁 Unlock 1 extra article by joining our Community!
You’ve reached your limit of 2 free monthly articles. Please enter your email to unlock 1 more articles.
Already have an account? Sign In fb7ed0-20f8fc-e4ac12-a70f54-22d635
Already have an account? Sign In fb7ed0-20f8fc-e4ac12-a70f54-22d635


