-
Research
-
Latest Research
-
Latest VideosFSI Pro FSI Macro FSI Crypto
- Tom Lee, CFA AC
-
First WordFSI Pro FSI Macro
-
Intraday WordFSI Pro FSI Macro
-
Macro Minute VideoFSI Pro FSI Macro
-
OutlooksFSI Pro FSI Macro
- Mark L. Newton, CMT AC
-
Daily Technical StrategyFSI Pro FSI Macro
-
Live Technical Stock AnalysisFSI Pro FSI Macro
-
OutlooksFSI Pro FSI Macro
- L . Thomas Block
-
US PolicyFSI Pro FSI Macro
- Market Intelligence
-
Your Weekly RoadmapFSI Pro FSI Macro FSI Weekly
-
First to MarketFSI Pro FSI Macro
-
Signal From Noise
-
Earnings DailyFSI Pro FSI Macro FSI Weekly
-
Fed WatchFSI Pro FSI Macro
- Crypto Research
-
StrategyFSI Pro FSI Crypto
-
CommentsFSI Pro FSI Crypto
-
Funding FridaysFSI Pro FSI Crypto
-
Liquid VenturesFSI Pro FSI Crypto
-
Deep ResearchFSI Pro FSI Crypto
-
-
Webinars & More
- Webinars
-
Latest WebinarsFSI Pro FSI Macro FSI Crypto
-
Market OutlookFSI Pro FSI Macro FSI Crypto
-
Granny ShotsFSI Pro FSI Macro FSI Crypto
-
Technical StrategyFSI Pro FSI Macro FSI Crypto
-
CryptoFSI Pro FSI Macro FSI Crypto
-
Special GuestFSI Pro FSI Macro FSI Crypto
- Media Appearances
-
Latest Appearances
-
Tom Lee, CFA AC
-
Mark L. Newton, CMT AC
-
Sean Farrell AC
-
L . Thomas Block
-
⚡FlashInsights
-
Stock Lists
-
Latest Stock Lists
- Super and Sleeper Grannies
-
Stock ListFSI Pro FSI Macro
-
CommentaryFSI Pro FSI Macro
-
HistoricalFSI Pro FSI Macro
- SMID Granny Shots
-
Stock ListFSI Pro FSI Macro
-
PerformanceFSI Pro FSI Macro
-
CommentaryFSI Pro FSI Macro
-
HistoricalFSI Pro FSI Macro
- Upticks
-
IntroFSI Pro FSI Macro
-
Stock ListFSI Pro FSI Macro
-
PerformanceFSI Pro FSI Macro
-
CommentaryFSI Pro FSI Macro
-
FAQFSI Pro FSI Macro
- Sector Allocation
-
IntroFSI Pro FSI Macro
-
Current OutlookFSI Pro FSI Macro
-
Prior OutlooksFSI Pro FSI Macro
-
PerformanceFSI Pro FSI Macro
-
SectorFSI Pro FSI Macro
-
ToolsFSI Pro FSI Macro
-
FAQFSI Pro FSI Macro
-
-
Crypto Picks
-
Latest Crypto Picks
- Crypto Core Strategy
-
IntroFSI Pro FSI Crypto
-
StrategyFSI Pro FSI Crypto
-
PerformanceFSI Pro FSI Crypto
-
ReportsFSI Pro FSI Crypto
-
Historical ChangesFSI Pro FSI Crypto
-
ToolsFSI Pro FSI Crypto
- Crypto Liquid Ventures
-
IntroFSI Pro FSI Crypto
-
StrategyFSI Pro FSI Crypto
-
PerformanceFSI Pro FSI Crypto
-
ReportsFSI Pro FSI Crypto
-
-
Tools
-
FSI Community
-
FSI Snapshot
-
Market Insights
-
FSI Academy
-
Book Recommedations
- Community Activities
-
Intro
-
Community Questions
-
Community Contests
-
Part 3
Technical Analysis, Part III: Momentum and Volume
This is Part Three of our three-part FSI Academy piece on Technical Analysis.
Momentum and Volume
Momentum
Momentum measures the rate of change in a security’s price by examining the movement of big money in and out of a given security. It helps traders identify the strength of a trend and potential reversal points. Common momentum indicators include the Relative Strength Index (RSI) and the Moving Average Convergence Divergence (MACD).
- Relative Strength Index (RSI): The RSI compares the magnitude of recent gains to recent losses to identify overbought or oversold conditions. It is typically plotted on a scale of 0 to 100. An RSI above 70 suggests overbought conditions, while an RSI below 30 indicates oversold conditions.
- Moving Average Convergence Divergence (MACD): The MACD is a trend-following momentum indicator that shows the relationship between two moving averages of a security’s price. It consists of the MACD line (the difference between the 12-day EMA and the 26-day EMA), the signal line (a 9-day EMA of the MACD line), and a histogram representing the difference between the MACD line and the signal line.
Volume
Volume represents the number of shares traded in a security over a given period. It provides insights into the strength of a price move and the level of interest (often institutional) in that security. High volume often accompanies significant price moves, confirming the trend, while low volume can indicate weak momentum or consolidation.
Using momentum and volume
- Confirming trends: High momentum and increasing volume confirm the strength of a trend. For example, a rising price with high volume suggests strong buying interest and a sustainable uptrend.
- Identifying reversals: Divergences between price and momentum indicators can signal potential reversals. For instance, if prices are making new highs, but the RSI is not, it could indicate weakening momentum and a possible trend reversal.
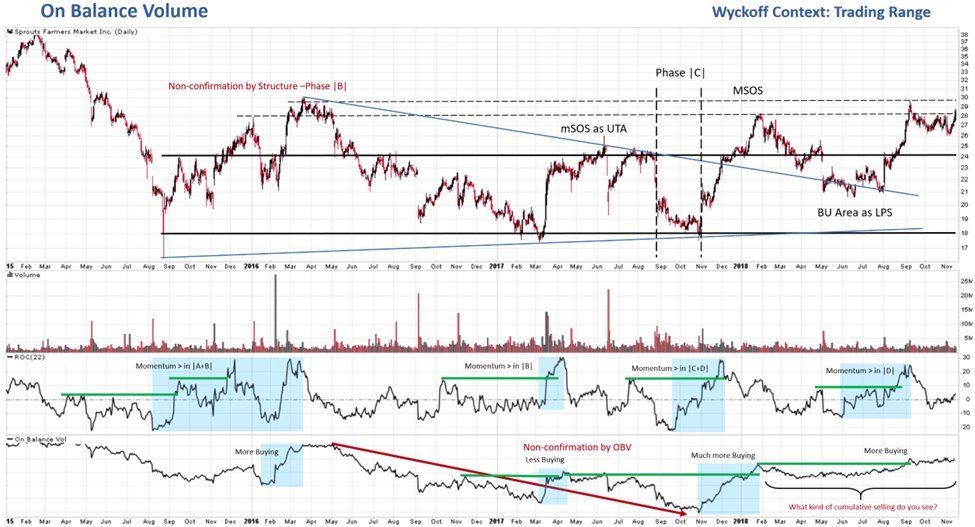
- Volume-based indicators: Indicators like the On-Balance Volume (OBV) and the Volume Weighted Average Price (VWAP) combine price and volume data to provide additional insights. OBV measures buying and selling pressure by adding volume on up days and subtracting volume on down days, while VWAP provides the average price of a security, weighted by volume, over a specified period.
Popular strategies that employ momentum and volume
- Divergence strategy: This strategy involves looking for divergences between price and momentum indicators (e.g., RSI or MACD). Bullish divergences occur when prices make lower lows, but the indicator makes higher lows, suggesting a potential upward reversal. Bearish divergences occur when prices make higher highs, but the indicator makes lower highs, indicating a potential downward reversal.
- Volume breakout strategy: This strategy focuses on significant price moves accompanied by high volume. Traders look for breakouts above resistance or breakdowns below support with a spike in volume, indicating strong conviction and potential continuation of the move.
Limitations of momentum and volume indicators
Momentum indicators can produce false signals in choppy or sideways markets, and they may not always provide timely alerts in rapidly changing conditions. Volume indicators, while useful, can be affected by external factors such as news events or market sentiment, making it essential to use them in conjunction with other technical analysis tools.
Conclusion
Technical analysis offers a comprehensive set of tools for analyzing markets, placing them within the broader context of trends and making informed trading decisions. By understanding and applying trend lines, moving averages, and momentum and volume indicators, traders can gain valuable insights into market behavior and improve their chances of success. Still, it is crucial to remember that no single tool or indicator is infallible. Combining multiple techniques and maintaining a disciplined approach to risk management are essential for navigating the complexities of the financial markets and trading successfully.
With this foundational knowledge, traders can begin to explore more advanced techniques and refine their strategies, continually improving their skills and adapting to ever-changing market conditions.
Bonus: Here are three very different books on technical analysis personally recommended by Mark Newton, CMT, Fundstrat’s Global Head of Technical Strategy.
How to Make Money in Stocks, by William O’Neil
The Wave Principle of Human Social Behavior and the New Science of Socionomics, by Robert Prechter Jr.
Dynamic Trading, by Robert Miner. “One of the first resources on how to combine price and time for the purposes of timing markets that I found helpful.” – Mark Newton

Related Guides
-
 Series of 3~5 minutesLast updated1 month ago
Keep Calm and Carry on Investing
A guide to managing your emotions during market downturns.
-
Series of 2~4 minutesLast updated2 months ago
FS Insight Decoded
An ad-hoc series that explains sayings frequently used by members of the FS Insight research team
-
Series of 3~6 minutesLast updated5 months ago
Your Price Target Is Likely Going to be Wrong. Here’s Why You Should Set One Anyway.
Price Targets
-
Series of 4~10 minutesLast updated2 years ago
Commodities 100
An introduction to commodities for novice investors.