Equities have extended gains and remain in a new short-term bullish uptrend as part of intermediate-term uptrends which never wavered during the recent three-week decline. While more evidence of falling Yields and US Dollar is likely beginning in the days/weeks ahead, it’s likely that the recent uptick in Healthcare, Financials and Industrials are constructive factors for this market technically and should help it broaden out. Moreover, Small and Mid-cap styles have come back to life over the last week and this recovery is also important despite it being in its infancy. Overall, I expect that SPX has begun its trek back to late March highs at 5264.85 and should exceed this en route to 5400.
Four sectors rose more than 1% to kick off the new week, and Industrials, Financials, Communication Services and Technology all led performance Monday.
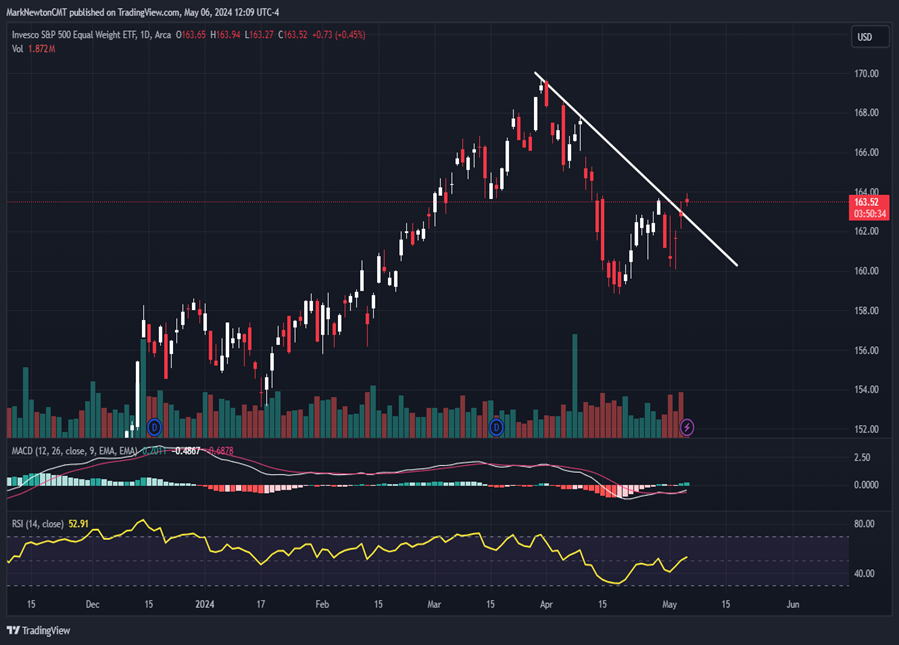
As shown below, the act of the Equal-weighted S&P 500 (RSP 0.66% ) regaining its two-month downtrend along with rallying back above its late April highs is encouraging for the prospects of this rally getting more broad-based in the days and weeks to come.
Both Industrials and more importantly, Financials (more importantly given its size within SPX) rose back above late April peaks on a closing basis. Moreover, Energy also made a convincing stand and recouped its former lows that were broken from mid-April.
These are all encouraging moves from a sector standpoint that visually help to demonstrate why the RSP breakout (below) is so helpful to US Equities.
Overall, as discussed, SPX targets initially lie near 5265 while QQQ should regain March peaks just above 349.
S&P 500 Equal Weight
Seasonality typically shows a strong push higher from May into August
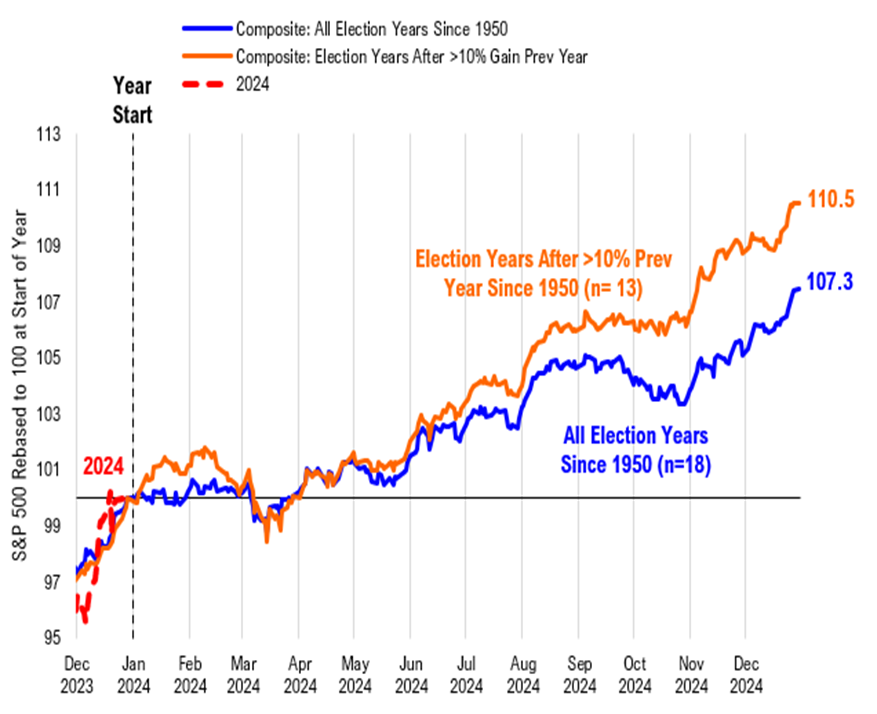
The Election year composites are shown below which illustrate typical election years along with those where the prior year gained 10% or more.
Both tend to rise sharply between now and the Fall, something which the median return averages for May into July have proven to confirm as being likely, just as over the last 70 years.
Interestingly enough, this composite tends to peak in the early Fall which my own cycle composite says likely occurs in August before consolidating into the US Election.
Thereafter, regardless of the Election outcome, markets have shown the tendency to rise sharply into the new year.
Bottom line, my own cycle composites combined with the Election year tendencies suggest that a Spring rally should be underway into June, and might not show meaningful corrective activity until the month of August comes around.
While SPX-5265 looks initially important, getting above that level should allow for a push up to 5400 and then 5630-50 cannot be ruled out for 2024. This latter scenario would prove highly likely on a breakdown under 4% in US 10-Year Treasury yields.
Election Year Composite
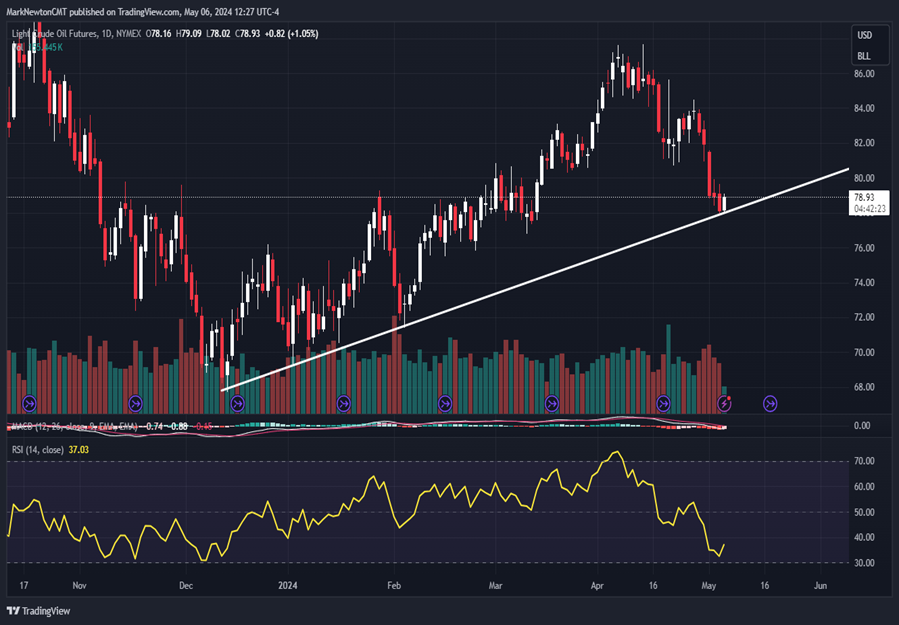
WTI Crude oil looks to be trying to bottom out
I discussed the possibility of WTI Crude oil nearing support and I feel that Monday’s lift likely means a bottom is in place for Crude, and for Energy stocks.
Since early April, WTI Crude has lost more than 10% down to the high $70’s. This level looks to represent important trendline support for WTI Crude at a time when Saudi Arabia has made the decision to hike prices in June to Light Sweet Crude oil prices for a third consecutive month.
Given my thinking of Crude rising over the next month, a cease-fire in the Middle East might prove elusive for now. Technically speaking, any move back over $81 should help Crude start to push up to the high $80’s and should be bullish for Energy.
Light Crude Oil Futures
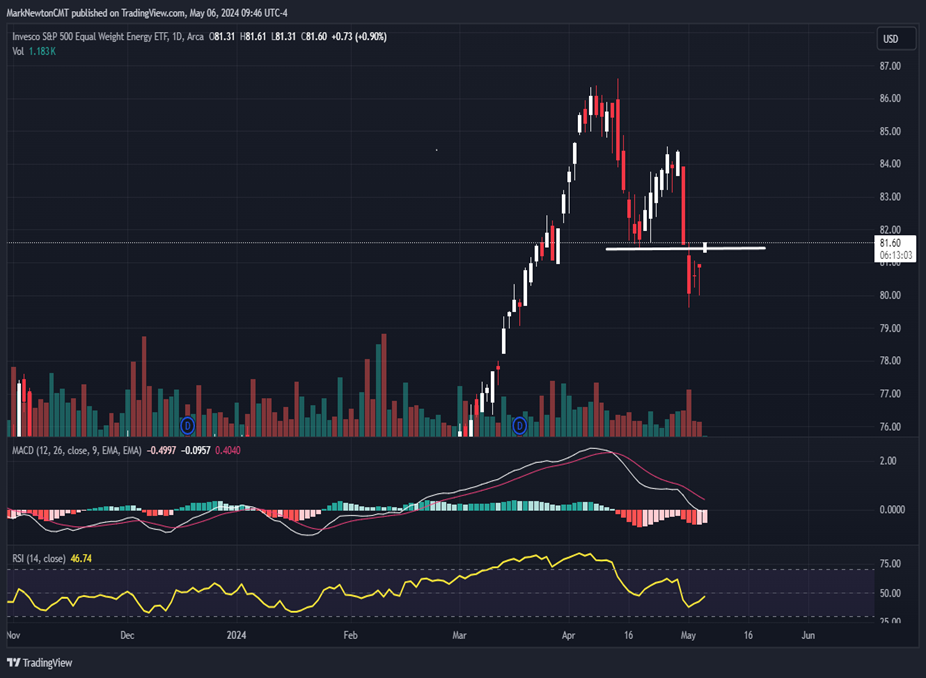
Recent stabilization in Energy sector looks encouraging
The chart below shows the recent push in Equal-weighted Energy back up from the prior lows from mid-April.
This is a bullish development for Energy, likely signaling that the recent consolidation in Energy from early April might have run its course.
Near-term, I believe Energy should be overweighted coinciding with a bottoming out in WTI Crude oil.
As discussed last week, XLE should be favored within Energy followed by XOP, while OIH is the weakest of the three Energy ETF’s at present, technically speaking.
RYE 0.97% , the Invesco Equal-weighted Energy ETF, is likely to push higher to the mid-$80’s initially and should benefit as more signs arise of Crude trying to bottom out.
S&P 500 Equal Weight Energy