I feel that lows are close in US Equities, but that Monday’s finish didn’t accomplish enough to think that the “Coast is clear” just yet. However, both breadth and momentum have turned higher on a short-term basis, and I feel this is constructive towards thinking both of these have bottomed. Even if price attempts to break last week’s lows, I expect this to prove temporary and create a very attractive risk/reward situation for risk assets.
US Equities gave back a bit of the early breadth surge from mid-day on Monday’s advance. However, Technology and Financials both finished higher than 1.00% for the day and likely could help lead markets higher.
A couple key points are worth mentioning:
Both US Dollar and US Treasury yields look close to peaking and their highs for the month happened last Tuesday. Thus, while US Equities continued down into Friday before Monday’s bounce, there looked to be a noticeable stalling out in both DXY along with ^TNX.
Breadth looks to have bottomed, after percentage of SPX names above their 20-day moving average bottomed out near 8% mid-week last week. Since that time, this has more than doubled, which is a positive, despite prices not having moved materially off the lows. This sets the stage for positive momentum divergence and any revisiting of last week’s lows should create a very attractive situation for SPX and QQQ into mid-week.
Technology relative to SPX has pulled back to important former lows, and while many might view stocks like NVDA -3.34% and/or others within the “Magnificent 7” as being broken, both should begin to stabilize and turn higher this week.
Momentum did officially reach oversold levels, and while this is largely irrelevant for those looking to time bottoms, it is important when a number of stocks stop moving lower after having lost ground in recent weeks.
Counter-trend indicators per DeMark were not in place to suggest a low as of Monday but would likely be in place on any test and break of last week’s lows. This would allow TD Buy Setups to develop on daily ^SPX charts and offer a bit more conviction of a low that would be more sustainable. Other timeframes which could show a confluence of exhaustion on one final move to new lows would be 60-, 120- and 240-minute timeframes.
Sentiment has also shifted to much more cautious after the recent selling and the contraction in AAII sentiment back to neutral territory from bullish was pretty dramatic and should be telling that a market low could be getting near.
Overall, a bottom to this recent decline should be close, but it’s very tough to say that it’s in place as of Monday’s close. Any move back under last Friday’s lows should mark a bottom based on the factors listed above.
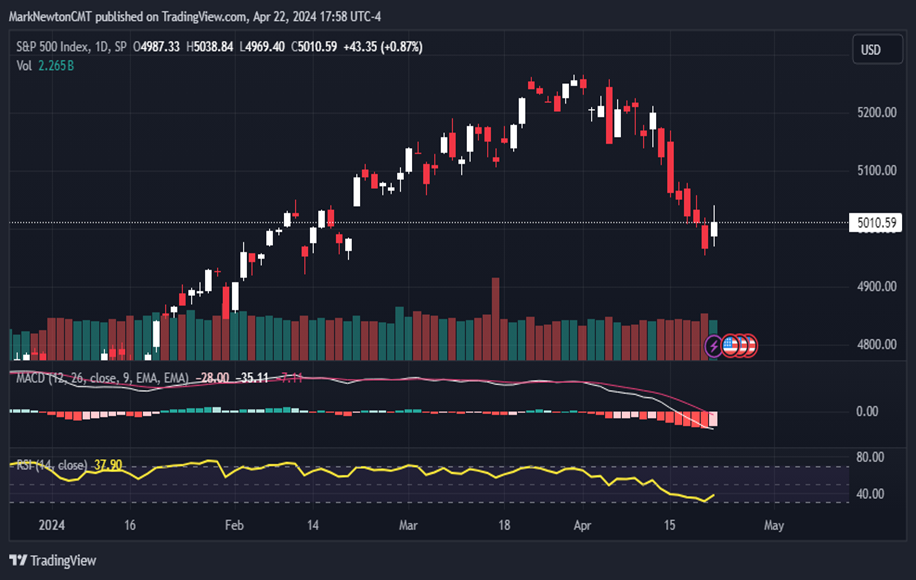
SPX daily chart shows prices having rallied initially above, but then failing to eclipse last Friday’s highs on a closing basis. Overall, the area from 4900-4945 should be important heading into Tuesday/Wednesday towards carving out a low for ^SPX.
S&P 500
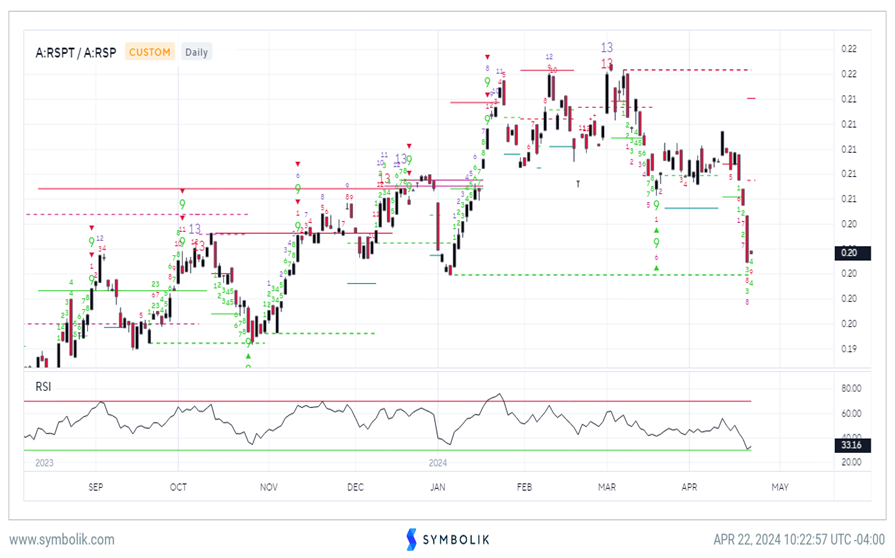
Technology vs. SPX is now down to support near January 2024 lows
This recent decline in Technology over the last few days of last week proved to be quite severe when eyeing Equal-weighted Technology ETF by Invesco (RSPT -2.01% ) vs. Equal-weighted S&P 500 (RSP -0.36% ).
However, one can see on daily ratio charts of RSPT/RSP that this ratio now lies near January lows. Overall, I feel that this level does mark some good support for Technology, and while minor weakness might transpire Tuesday and/or Wednesday ahead of Technology earnings, I feel like this area represents good support for an upcoming bounce.
From an Elliott-wave standpoint, it’s not incorrect to use the same rules-based logic to view this relative chart pattern as one would with an absolute chart. In other words, a three-wave decline normally does not mark a peak in prices.
Therefore, one could easily see a snapback rally based on this formation that could carry Technology back to new relative highs vs. the S&P.
Bottom line, I like Technology here as a risk/reward to overweight on recent weakness and do not feel like the sector has peaked out on an intermediate-term basis. Weakness has proven short-term and temporary only and should lead back to new highs.
Equal-Weighted Technology vs Equal-Weighted S&P 500
Growth has dipped a bit vs. Value but this recent underperformance should translate into Growth snapping back
Overall, this recent underperformance in Growth over the last two weeks, as shown below in a relative relationship by the Ishares S&P 500 Growth ETF (IVW -1.69% ) relative to Ishares S&P 500 Value ETF (IVE -0.70% ) should prove temporary and short-lived.
The relative relationship between Growth and Value has not sustained any real technical damage. Therefore, recent weakness can’t be seen as the start of true Value outperformance.
It’s thought that if Technology earnings prove better than expected, or US Treasury yields begin to turn back lower, both events would result in Growth turning back higher vs. Value.
Overall, it looks right to favor Growth bottoming this week vs. Value and I feel this is an attractive risk/reward on recent underperformance.
iShares S&P 500 Growth

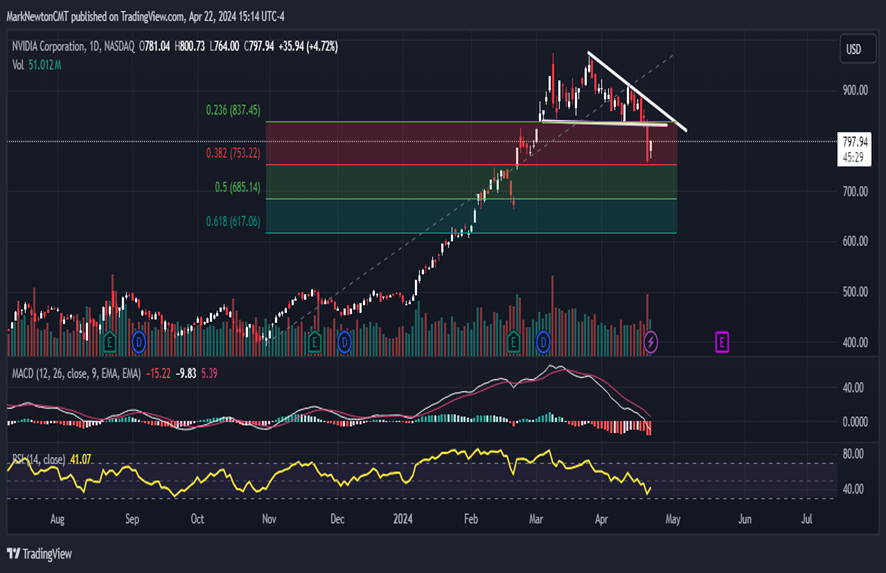
NVDA has suffered Short-term damage only; Move back above $830 should lead back to new all-time highs
While a break of $830 was a short-term negative development for NVDA -3.34% , such a breakdown creates opportunity for long-term investors who have never witnessed NVDA’s RSI momentum gauge get near oversold territory.
NVDA -3.34% carved out an Inside day in Monday’s trading, where the entire daily range is within the prior day’s (last Friday) decline. Normally, these 2-day patterns can be promising in suggesting a turning point has arrived.
As daily charts show for NVDA, this pattern produced a vicious breakdown of the prior one-month range, and the act of undercutting $830 allowed for outsized selling pressure to take over last Friday. However, after having erased more than 200 points off the 3/25 peaks, NVDA managed to get very close to testing its first meaningful Fibonacci retracement level of the prior advance from last Fall, which intersects near $753.
While some investors might be inclined to view this pattern as a Head and Shoulders formation, it’s important to recognize that it has only been a three-wave decline and very likely could allow for a push back to new all-time highs into May.
The key area in question lies near this prior $830 which was violated last week. The act of regaining that level would constitute a positive and then recouping $878 would help to surpass the minor downtrend from the peaks. Overall, I like owning NVDA here technically, and do not feel at this time that sufficient damage has occurred to avoid it. While the stock has undergone some technical damage, it very well could recoup this quickly as this week’s “Magnificent 7” earnings get underway. One should look to see what happens on a test of $830 and above that level very likely would mean that a bottom is in for NVDA -3.34% . Furthermore, this should help to carry the stock back to $1050-$1100.
NVDA