In the very short-term, there does look to be a chance for a bit more technical selling as a result of Wednesday’s decline. Equity index uptrends were broken and breadth came in very heavily negative. Moreover, the minor breakout in US Dollar as well as US Treasury yields will need to show some evidence of stalling and reversing course. Overall, I don’t see the potential for more than a 1.5-2% decline from here, and SPX should find strong support near 5100 before turning back higher. In the bigger scheme of things, the next big move should be higher, not lower, yet one has to allow for a big more weakness to complete this recent pattern. Neither NASDAQ, nor SPX cash have broken last week’s lows yet to match what happened in Futures markets, so this remains important to keep an eye on.
CPI’s upside surprise likely postpones the immediate snapback rally in Equities, and a bit more weakness looks possible in both Equities and Treasuries before a rally can get underway.
The sharp rise in US Dollar along with US Treasury yields broke near-term resistance levels and arguably might result in US 10-Year Treasury yields climbing up to 4.63% or a max near 4.70% before the start of their pullback.
Importantly, I do not view SPX weakness as something which will prove long-lasting, and should be buyable on any weakness into 4/20, an important cyclical time which I felt previously might turn out to be a high for stocks.
However, as charts below show, the break of the recent consolidation and in particular, the breaks of last week’s lows in S&P 500 Futures and DJIA are technical negatives that follow a recent violation of the entire uptrend from January.
While this uptrend break was something to ignore previously given consolidation near recent highs, this latest snapback makes it important to address.
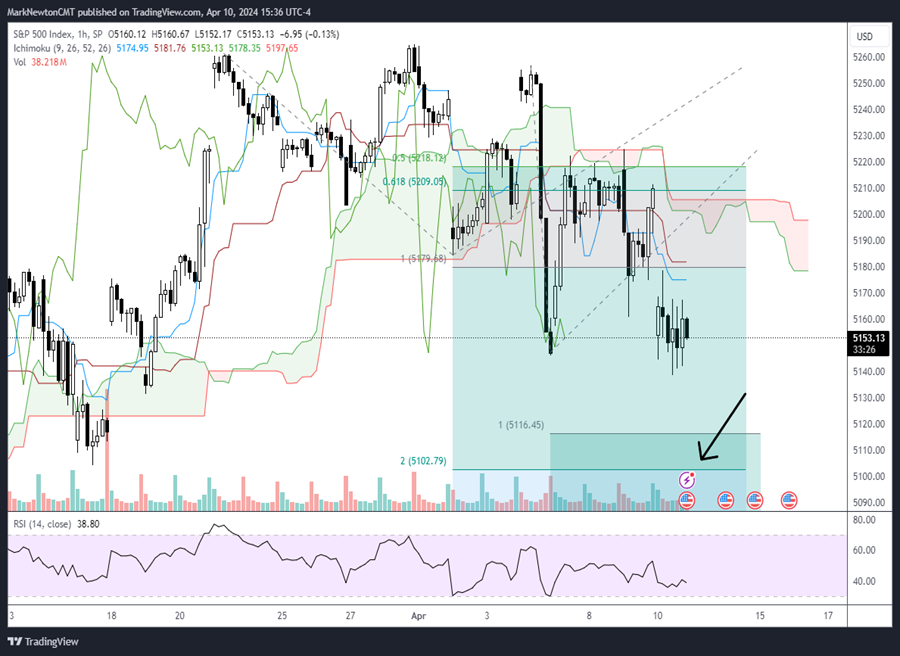
S&P 500 Index
Overall, it’s important to note that this weakness really hasn’t been seen yet in the NASDAQ, which has held up much better than DJIA, or S&P 500 Futures.
As might be expected, Small-caps underperformed sharply as rates spiked further today, and Large-cap Technology is actually acting better than either Utilities, or REITS, which is a minor positive.
However, the breadth of Wednesday’s decline is a decidedly negative factor and seven sectors out of 11 fell more than 1.5% on the day: Materials, Discretionary, Financials, REITS, Comm. Svcs., Utilities and Technology.
To think that this consolidation has run its course at this point, SPX requires a close back above 5224. Until then, minor bounces on Thursday might still find selling pressure into end of week.
Bottom line, I don’t expect that SPX gets under 5091 and a target on a closing basis could materialize near 5110.
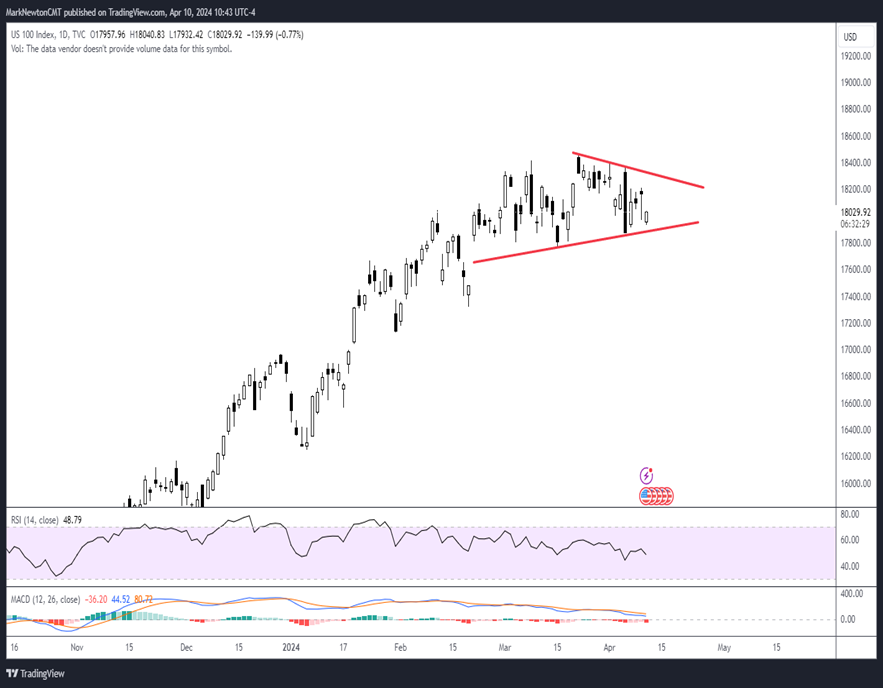
NASDAQ 100 is holding up relatively better than S&P 500
As mentioned above, despite the breakdown in DJIA and S&P 500 Futures, there is a decidedly positive divergence when eyeing the NASDAQ 100, which is holding up admirably and has not yet broken down.
I often scan for numerous indices to validate a support violation, and in this case, the price action hasn’t really confirmed the start of a big pullback for “the Bears”.
This act of holding up within its ongoing consolidation is considered a positive for NASDAQ, but needs to be monitored closely in the days to come.
Key support lies at $17875 for NASDAQ 100, and it should also be mentioned that SPX-5146 held on a close and was not broken.
Unfortunately, the combination of the hugely negative breadth readings on Wednesday’s decline combined with the structural negative of DJIA and S&P 500 Futures having (briefly) violated last week’s lows looks negative.
Thus, more confirmation is necessary to have more conviction at this point of a bullish or bearish move given the recent consolidation, and one cannot assume that Wednesday’s decline automatically translates into a strong bearish case for US Equities.
See the NASDAQ 100 index’s consolidation below which has not been broken.
NASDAQ 100 Index
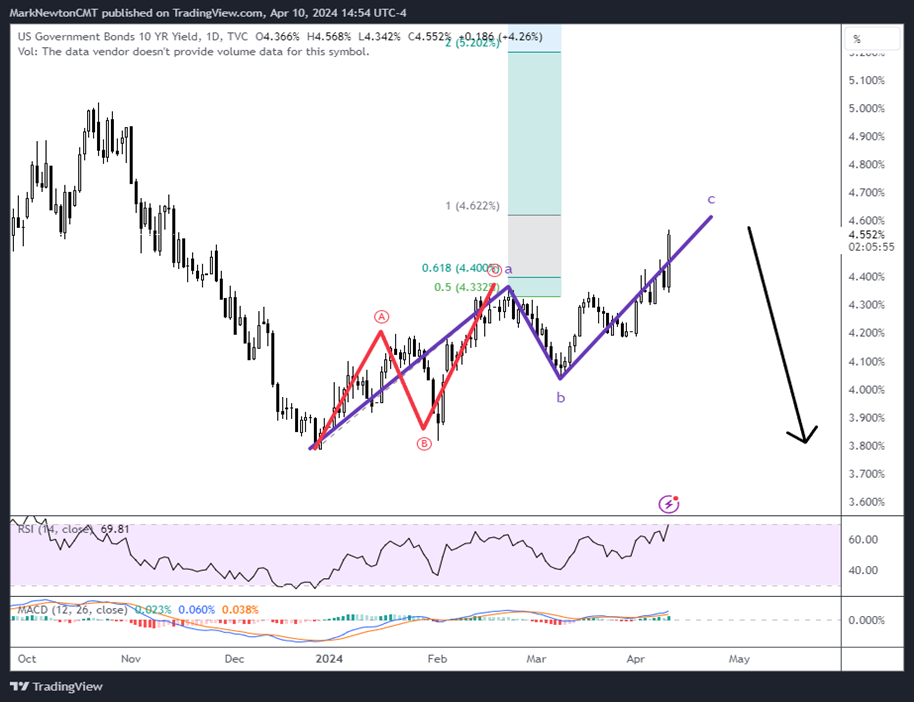
US 10-Year Treasury Index Yields spiked higher to 4.55% which is a minor negative for risk assets; Yet, yields are nearing resistance
After nearly a week when ^TNX had straddled the all-important 4.35% area, Wednesday’s strong CPI report resulted in a sharp rally in 10-year yields back to 4.55%.
Overall, I do not expect a move back to 5.00% and to new highs right away. As discussed in recent weeks, given the technical structure of this recent bounce combined with cyclical projections, this recent lift should prove short-lived before rolling back over.
This bounce from December 2023 lows looks to be just that, a bounce, and should lead to yields promptly rolling over at a time when no one suspects it. My 2024 target for TNX lies down at 3.25% and this should be quite likely once yields get back under 4.038%.
While it’s difficult to make the case that 4.55% is important after Wednesday’s lift, I feel like 4.62% has importance, which would make the initial wave higher from December equal to the more recent bounce from March.
See below that the first move off December 2023 lows proved to be very choppy and overlapping indeed. This makes it difficult to call for a continued advance to new yield highs and adds to the likelihood that this bounce will prove short-lived.
US 10-Year Treasury Yield Index
Treasury Yield cycle looks to turn down quite sharply post 4/20 into August
If the daily Treasury yield cyclical composite is to be believed, the recent sharp bounce (which was forecast to run from late February into mid-April) should be nearing completion.
This daily composite which I showed back in January 2024 did pinpoint the possibility of a lift in yields into the Spring.
However, this should prove to be the final move higher into the next 1-2 weeks, technically speaking, before the start of yields moving lower.
I agree with this composite given Elliott wave structure along with Sentiment and feel like adding duration into April election should make sense for the start of a Treasury rally which might last four months (or potentially longer)
The specific date after which yields are likely to turn lower arrives near 4/20/24 for Yields, and this might prove to be an important time for Currencies and Equities as well.
Daily Treasury Yield Cyclical Composite
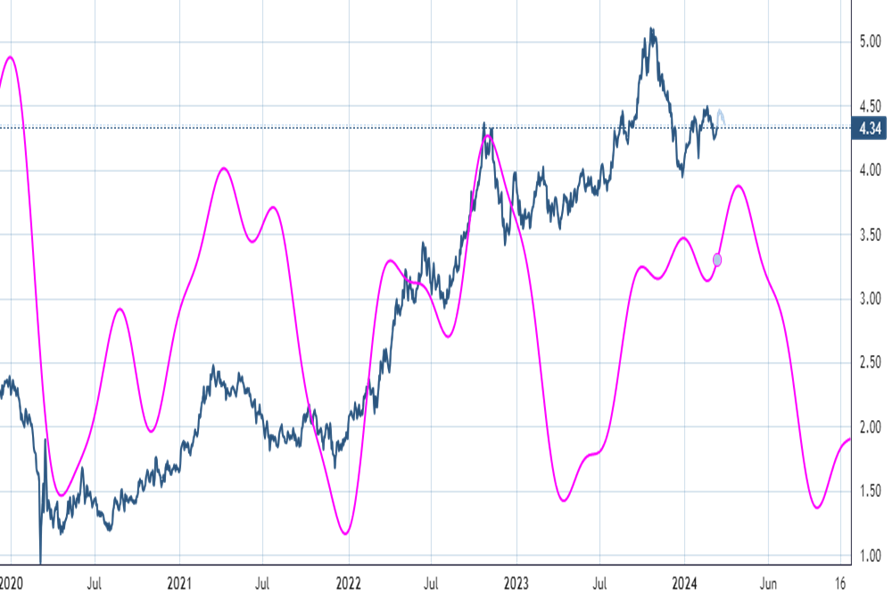
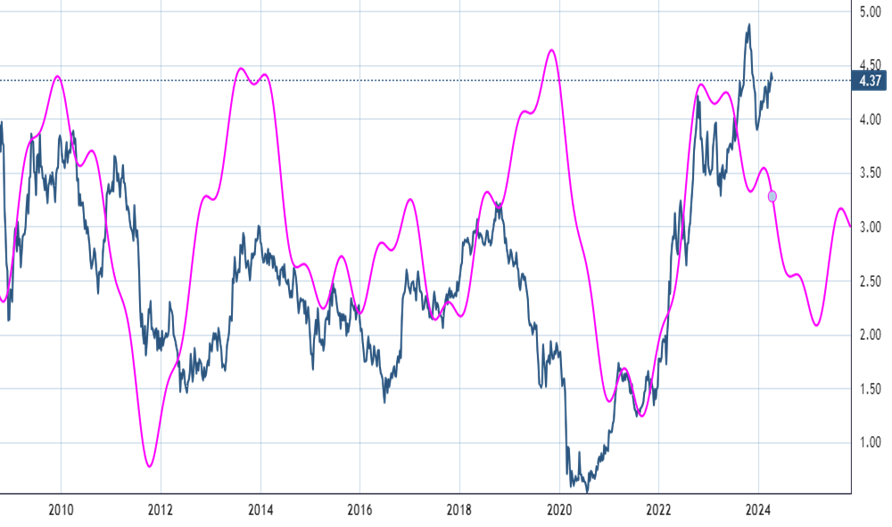
Weekly Treasury yield cycle shows persistent weakness in yields into Spring 2025
While the daily cycle composite showed yields getting close to turning lower, the weekly composite very well could have already peaked.
This weekly composite previously showed some confluence with Yield peaks back in 2010, 2014 and 2018. It bottomed in 2012, 2017 and 2021.
If this is to be believed, then the intermediate-term trend from now into next year could prove quite bullish for Treasuries. This should allow for 3.25% to be tested in US 10-year yields
As shown below, this cyclical projection goes lower into next Spring, into March-May of 2025. While the magnitude of this pink line is less important than the amplitude and inflection points shown on this chart, it does look to be trending down sharply into 2025 before moving higher.
Once the near-term inflection area of the Daily cycle is reached and starts to turn down, then both daily and weekly cycles will be in alignment and moving lower, at least until August, in our view.
Weekly Treasury Yield Cyclical Composite