Please click here to view my appearance on Fox Business News this morning with Maria Bartiromo.
I continue to see the US stock market as being attractive, technically speaking, and do not feel sufficient risk is there to warrant a selloff at this time. While momentum gauges like RSI have gotten overbought, there remains precious little other technical evidence with regards to frothy speculation to excessive valuation measures that would warrant a major selloff. Powell’s recent dovishness likely won’t change too dramatically despite a second “hot” CPI reading, and it appears like bounces in US Dollar and Treasury yields could prove short-lived before weakness back to new monthly lows into this Summer. Rallies up to SPX-5250-5300 look possible ahead of a possible late March pullback into April. However, without any evidence of this, it pays to wait for signs of weakening breadth and/or momentum before expecting a selloff of any sort.
Tuesday’s price action was more indicative of how many have felt this market has seemed in recent months, as the top-heavy Technology stocks drove the outperformance, while many other sectors failed to keep pace. Those companies, like ORCL -1.80% , which cited heavy AI demand, along with NVDA benefited, while four sectors fell in Tuesday’s session: REITS, Utilities, Materials, and Communication Services.
Note that these underperformers for Tuesday were precisely some of the pockets of recent strength over the past few weeks, and some rotation into these groups isn’t all that worrisome provided that Technology, Industrials and Financials all show sufficient evidence of maintaining recent uptrends and not giving way (which is precisely what has happened in recent weeks).
Overall, the key takeaway from CPI as reported by the media was that “The second straight 0.4% reading for core CPI suggests that January wasn’t a one-off anomaly” (Bloomberg).
I, along with Tom Lee, tend to disagree with this view, but from a technical standpoint that has more to do with falling bond yields and a falling US Dollar. Thus, Tom’s take of “residual seasonality” proving to be a key reason why CPI proved to be “Hotter” than expected this month would suggest that the bond market hasn’t been wrong to rally over the past few weeks.
Technically, based on a combination of market cycles as well as traditional trend following tools, I couldn’t agree more.
My own study of bond yields and US Dollar both suggests that these should be starting to trend sharply lower in the next few months, which would run counter to the market’s thinking that inflation is making a big comeback.
As seen below, a couple key technical points are worth making:
First, momentum gauges like MACD remain negatively sloped on both weekly and monthly charts for ^TNX, suggesting that the late year bounce in Treasury yields hasn’t had a big effect on turning momentum back higher.
Second, the Elliott-wave pattern is suggestive of a three-wave bounce in Yields into late February, which might be now rolling back over, and will undercut 3.783%. As Elliott practitioners are aware, the extent of the Bond yield decline from 2/22 is a bit problematic toward the thinking that yields can still move higher. It has undercut the prior swing high from 1/19/24, creating a three-wave corrective bounce, not an impulsive five wave move higher.
TNX- US Government bound 10-year Yield Index – Minor bounce only before turn back lower
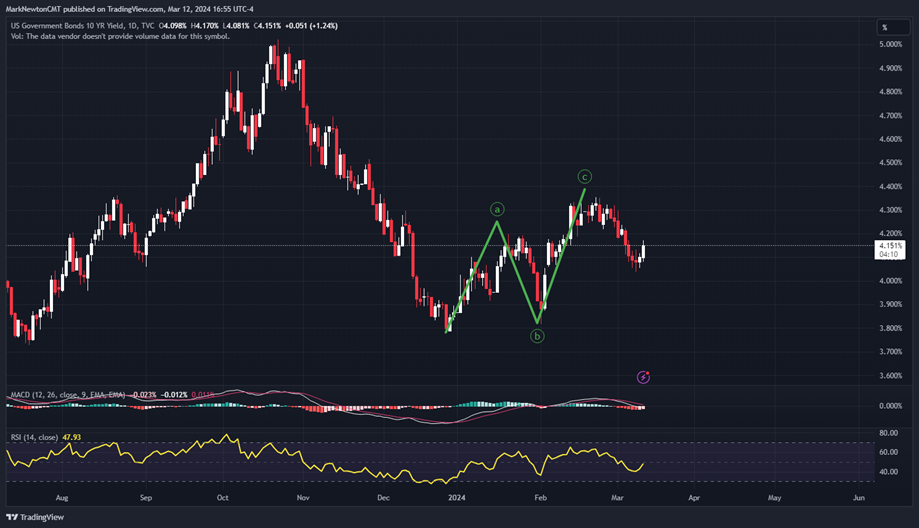
In plain English, the two comments above point to the fact that it might be unlikely that ^TNX climbs back to 4.50-4.60, which I thought might be possible into late March/April before a decline lasting into late Summer 2024.
I’m more on board with the possibility that both US Dollar and also Treasury yields made their peaks last Fall 2023, and are now sliding back to challenge and break the prior lows made in December 2023.
Two key areas to watch as necessary support for Treasury bears are 4.038% and then 3.80%. If this latter area is broken, then a decline down to 3.25% should be underway.
Bottom line, the media likely will discuss that the recent bond market rally (decline in Yields) was unfounded given a second “hot” CPI print. However, Powell certainly came across as much more dovish in his recent comments and likely realizes that much of the CPI print was based on seasonal factors and Energy.
Furthermore, as MLIV discussed this week, with February core CPI y/y falling to 3.8%, the real Fed funds rate increased to 1.7%. Compared to a Fed model estimate of a neutral real rate of roughly 0.7%, this makes the current policy stance the most restrictive since 1989. Therefore, this leaves plenty of room for FOMC cuts.
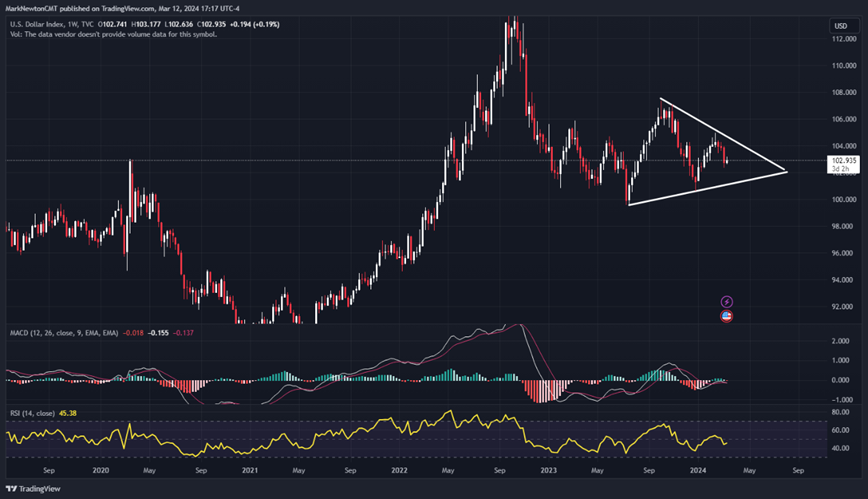
US Dollar could mimic bond yields and bounce just briefly before turning back lower to new 2024 lows.
Similar to my comments on TNX above, the US Dollar has also begun to turn down a bit more aggressively in recent weeks that argues for the potential for additional weakness to challenge and undercut the prior lows from late 2023.
While DXY bounced over the last few days, I’m unsure that a rally back over 105 makes sense technically speaking for the weeks ahead. Moreover, any decline down under 102 would be highly suggestive of further intermediate-term weakness for DXY (US Dollar index).
Key areas of support technically lie near 100.61-101. Any decline which breaches 100.61 should begin a multi-month decline down to 95.
Such a move in the DXY along with a declining TNX would embolden Emerging markets along with commodities, and I suspect that precious metals would thrive in such an environment.
For such a technical thesis to play out, it’s important that the DXY remain under 105, as the wave count and structure would change over 105. However, at present, momentum and the recently deteriorating trend argue that this week’s minor bounce attempt might prove short-lived into the FOMC meeting before rolling over again. (This might mean that Powell reiterates his recent dovishness, regardless of the second straight “hot” CPI print.)
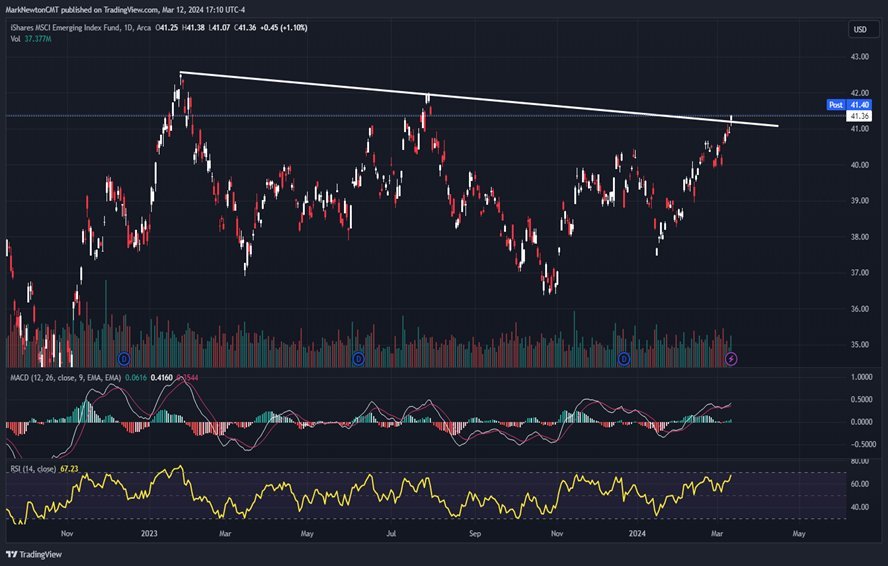
Emerging market ETF breakout bodes well for continued strength, thanks to China
EEM -0.26% , the IShares MSCI Emerging market ETF, has achieved the same technical progress which happened with Chinese equities on Tuesday, breaking out above the lengthy area of resistance that has marked a peak the last time it was tested.
I think this is important and bullish for Emerging markets and given China’s heavy weighting among EEM, some of this recent constructive stance can be correctly attributed to strength in Chinese Equities in the last month.
In the short run, a rally to test 42.50 looks likely. However, moving above this looks quite possible in the months ahead and given the choppiness of the pattern since early 2023, one can point to the possibility of a rally back up to $46, or even $49 in EEM.
India, and Mexico remain quite attractive within the more liquid Emerging markets and some evidence of South Korea also trying to stabilize is evident.
One should keep a close eye on Latin America as ILF 1.27% , the Latin America 40 ETF (which is heavily Brazil focused) could be set to make a large move higher in the months to come.
Overall, recent positive price action in many Emerging market countries Equity markets makes me more positive on this group for 2nd-3rd quarter 2024 and expect that absolute strength should happen in many countries Equity ETF’s which could coincide with a drop in the US Dollar and Treasury yields.
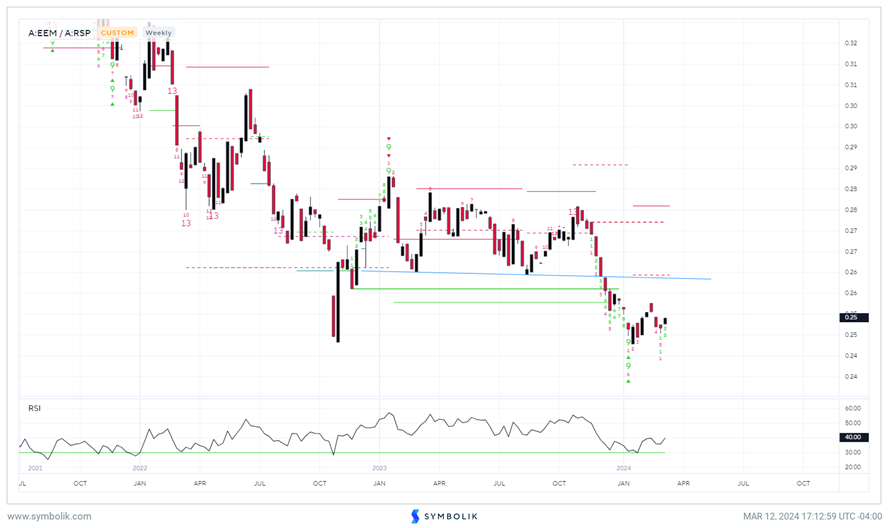
Emerging markets vs. Equal-weighted S&P 500 look to be gradually stabilizing and turning higher
This recent strength in EEM has also begun to turn relative charts of EEM vs. the S&P 500 ( In Equal-weighted terms) back higher in recent weeks.
While this ratio chart has some necessary “work to do” before suggesting a large intermediate-term period of outperformance vs. US Stock indices, I think that’s definitely possible for 2024 if/when December 2023 lows are breached by the US Dollar index and 10-Year Treasury yields.
Daily TD Sequential indicator “13 Countdown” confirmation signals were present at the recent lows of this ratio chart, and while weekly signals are not currently seen, I suspect that a drop in the US Dollar could help this relative chart move up quite nicely.
Overall, I intend to revisit this chart in the months to come. However, it stands to reason that any move in the ratio of EEM to RSP back above the two prior swing lows from 2023 would serve to strengthen this ratio chart immensely.
Thus, a large intermediate-term period of outperformance from Emerging markets (EM) looks possible this year, which could have just gotten underway.