Divergence between the top performing stocks within Technology and the broader market could eventually lead Stock indices to consolidate. Yet, currently, we’re seeing the opposite, as groups like Industrials and Healthcare have both pushed back to new all-time highs. A minor broadening out in sector performance has happened, and this week has brought about a rally back to new all-time highs for MSCI World index, along with a breakout in Equal-weighted SPX to the highest levels in nearly two years. While many have avoided chasing some of the highflyers that have dominated performance, there’s been precious little sign of these stocks turning down. Conversely, the broader market has now begun to show signs of mean reversion higher after a weak January.
Does poor breadth matter? Sure. However, the breadth expansion from October 2023 into year-end was so robust that many intermediate-term breadth gauges remain in good shape, despite some of the waning in short-term measures.
While investors are right to be curious about how far SPX or QQQ can extend, if DJ Transportation Avg., Equal-weighted S&P 500 and/or Value Line are not keeping up the stock market does seem to be gradually starting to broaden out. Dow Theory purists will largely tend to hold off on celebrating barring a larger broad-based rally getting underway.
Yet, performance data has shown lately that it’s not just Technology (and specifically, NVDA 0.53% and MSFT -0.02% ) that has led the US indices higher from a sector perspective. Healthcare, along with Industrials and Financials, are the three sectors along with Technology which are higher Year-to-Date (YTD).
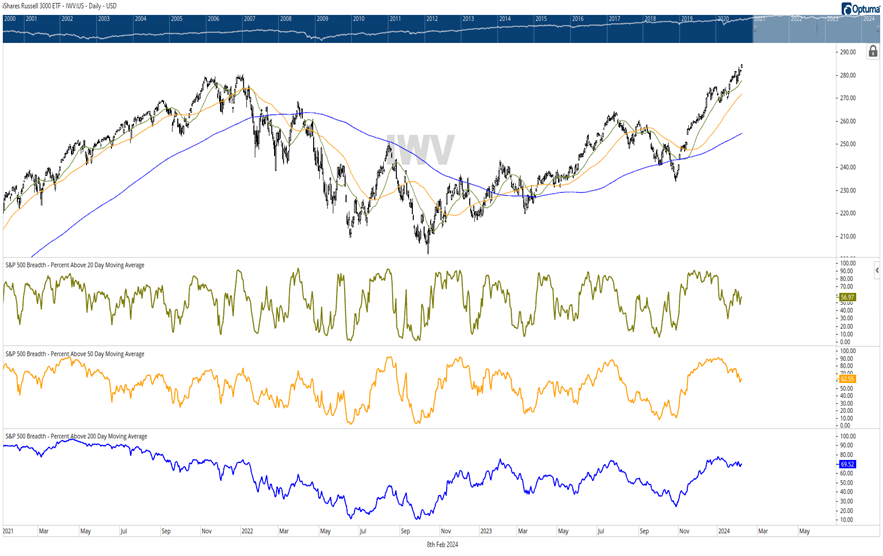
Bottom line, it’s certainly right to keep a close eye on breadth, percentage of stocks above their 20, 50, 200 day moving averages and if DJ Transports and/or Small or Mid-caps are participating (or not) in a given move. (Thursday happened to be a very good day for Small-caps.) However, when indices like Russell 3000 ETF (IWV 0.06% ) push back to new all-time highs (which roughly represents 95% of all publicly traded issues) it’s worth paying attention, even if Value Line and/or Equal-weighted SPX have not yet achieved this goal.
Given no evidence of trend failure, and lack of counter-trend exhaustion, I feel that ^SPX and QQQ -0.17% likely continue up into Presidents Day weekend before any real consolidation and NVDA 0.53% earnings on 2/21 might have importance in this regard.

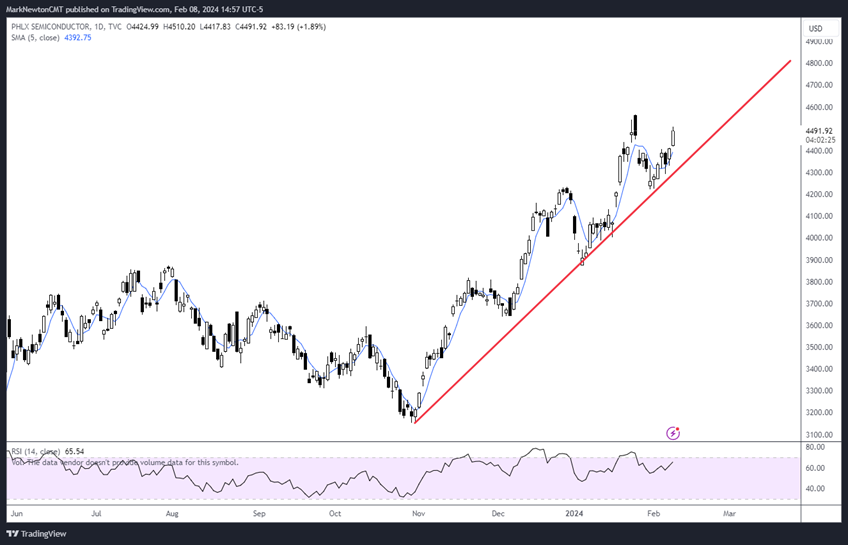
Semiconductors remain strong within Technology and SOX might push to 4800 before any consolidation
Technically, SOX appears to be turning back higher again following just a minor amount of consolidation.
Semiconductor names have been stronger than Software and Hardware names lately, and while some of my intermediate-term charts do show a good likelihood of Software kicking into gear vs. “Semis” and outperforming in 2024, thus far in 2024 the outperformance thus far has been NVDA and AMD related and has proven powerful.
Daily SOX charts show a steadily rising uptrend with higher highs and higher lows. I expect a push up to 4750 with 4800 being important in the month of February. Until/unless some evidence of trend damage occurs, SOX still looks to have a good chance of pushing higher.
Is this week’s WTI Crude rally the start of a larger move?
The lack of a material ceasefire seems to have been chalked up as the reason why WTI Crude spiked in recent days, but technicals argue that more still needs to be done ahead of endorsing this as the start of a push back materially higher.
A few key technical points to discuss:
- Elliott patterns on the rally from last December 2023 still appear choppy and corrective (If this is true as it appears, than WTI Crude would still be vulnerable to weakness this Spring).
- WTI Crude has not exceeded its Fibonacci 38.2% retracement area of the decline from last year, making price still quite weak as it straddles near the lows of the last couple months.
- Equal-weighted Energy ETF’s like Invesco’s RYE 1.20% , have not broken out of existing downtrends form last Fall, which intersect near $74. Until/unless this happens, it’s thought to be a choppy time for Crude, but not a rally that we’re able to embrace just yet.

Market breadth has waned, and Small-caps remain well off all-time highs. How big of a problem is this?
The chart below shows the percentage of SPX names above their respective 20, 50, and 200-day moving averages.
As can be seen, these gauges peaked in November/December timeframe and have been dropping throughout the start of 2024. However, there are a few important things to highlight:
- Industrials and Healthcare have both pushed back to new all-time highs. While Industrials doesn’t count as a large part of SPX, Healthcare is the 2nd largest sector by market capitalization and certainly a lot more important.
- Those citing poor breadth have to reconcile this with the fact that percentage of SPX stocks above their 200-day moving average are still hovering around 70%. While this is down from late last year, it remains at a healthy level.
Following a 700-point SPX rally from late October into late December in roughly two months’ time, markets rose in a very broad-based fashion late last year. Thus, it’s normal for consolidation to happen, which US Equity markets seemed to do in January (despite SPX and QQQ pushing to new highs).
As discussed up until Thursday of this week, the Equal-weighted SPX had made roughly no net progress since mid-December.
- Small-cap and Mid-cap strength is certainly important and likely will begin to happen once this Treasury yield bounce has played its course and turns back lower. I suspect that March/April of this year should coincide with yields turning back down sharply to undercut 4% on their way to 3.25%. This period which could be April to August 2024, should coincide with the broad-based rally which many are anxiously awaiting.
Overall, I suspect that consolidation in March/April timeframe will prove to alleviate some of the overbought readings in Technology along with offering dip-buying opportunities to investors who have missed the gains in stocks like NVDA.
However, in recent weeks, the comeback in Financials, Healthcare, and Industrials is certainly healthy from a technical standpoint and really hasn’t been discussed by the mainstream media given the constant focus on Technology and Magnificent 7 dominance.
The chart below highlights the IMV’s push back to new highs but also shows the percentage of SPX names above their 20-day moving average (in gold) ,percentage above their 50-day m.a. (yellow) and percentage above 200-day m.a. (blue). While these have all dipped in the last month, the 50 and 200-day gauges are still relatively healthy in my view.