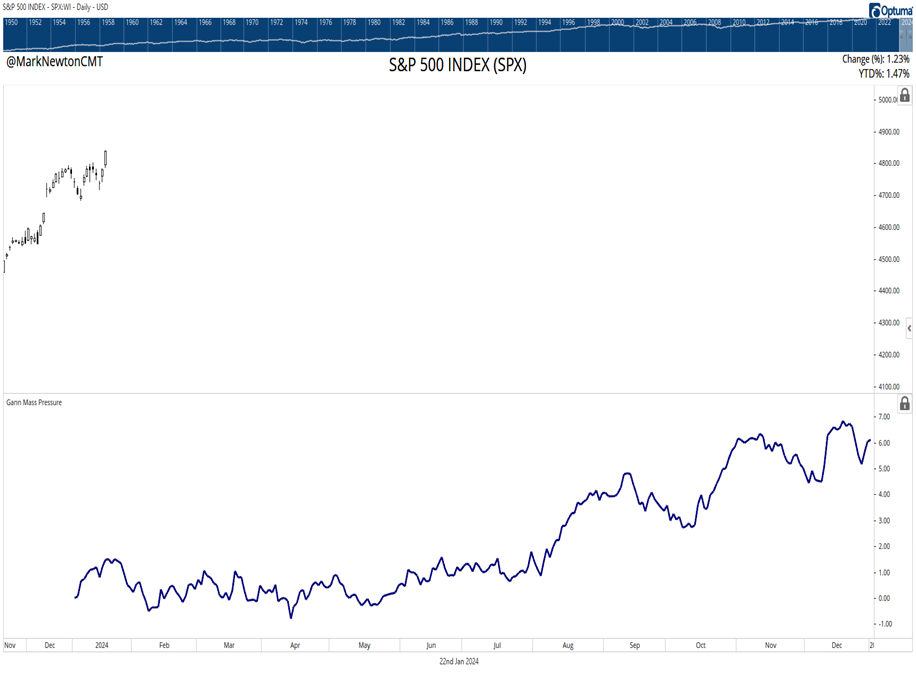


SPX and QQQ at new all-time high territory has caused some concern to those who study how much Technology has dominated in recent weeks to the detriment of many other sectors. As discussed, breadth had begun to wane sharply in January and both the US Dollar and Treasury yields had begun to bounce back higher. Monday showed some necessary mean reversion to the recent “Market Thinness” as Transports and Small-caps snapped back sharply. However, until breadth can snap back in an even more robust fashion, it does give some concern to how much Stock indices can rally without consolidation. Gann’s Mass Pressure chart for 2024 shows weakness starting later this week into mid-February.
To say this year has proven strange thus far is not that big of a stretch. The market is back at new highs but yet the first 5 days of January along with the Santa Claus rally period were both negative. SPX and QQQ have pushed back to new highs while AAPL and IWM have lagged substantially. Russell 2k index certainly did not follow SPX back to new highs. IWM was lower by more than 20% off all-time highs until Monday’s gains.
Moreover, in the last rolling 1 month period, Consumer Discretionary, REITS, Utilities, Materials and Energy have all lost more than 2%. This certainly doesn’t sound like a market which has pushed back to new high territory.
Yet as discussed, this doesn’t have to be bearish per se, if the broader market starts to respond and turn up sharply to join Technology’s recent strength.
This will take time, but Monday was certainly constructive with regards to the Dow Jones Transportation along with Russell 2000 both exhibiting far greater strength than SPX. Some of this might be attributed to US Treasury yields which have dropped a bit from late last week. As we’ve become acutely aware in recent months, the correlation between Treasury performance and Small-cap performance remains quite strong. (In plain English, as yields pulled back last year, Small-caps outperformed sharply.)
Yet, more will need to happen to expect an uninterrupted push to SPX-5200, or in this case, seeing IWM 0.86% eclipse last month’s peak at $205.49. Eventually I do expect this will happen, but I am anticipating that April/May into August might prove to be a better time for Small-caps than late January into March. We’ll see.
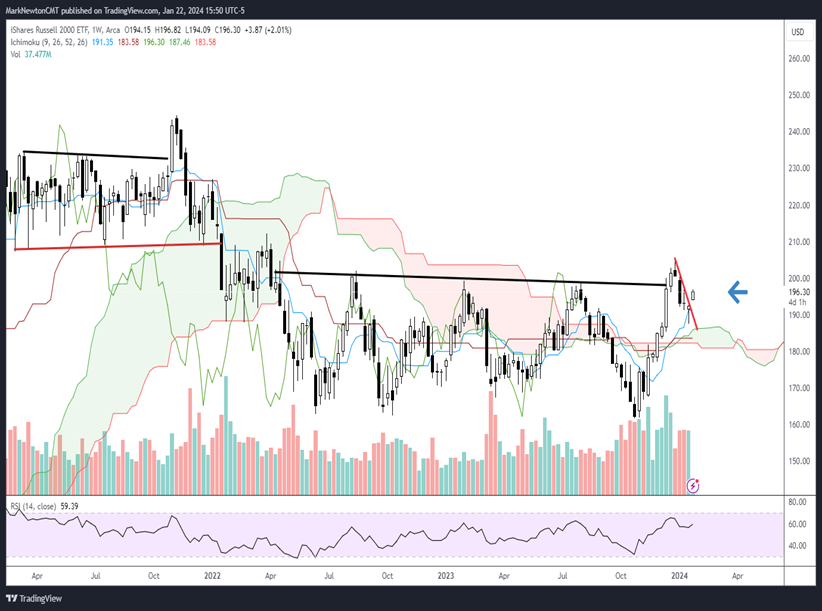
Russell 2000 did officially exceed its one-month downtrend in Monday’s (1/22) trading. (See IWM 0.86% below) DJ Transportation Avg achieved a similar constructive minor breakout. Yet, it will be the ability to reclaim last month’s highs which should truly set the broad-based expansion in motion. This looks premature, but should be watched in the weeks ahead.
IWM ETF
Technology should certainly be overweighted for 2024, in my view; Pullbacks into February should make this sector even more attractive
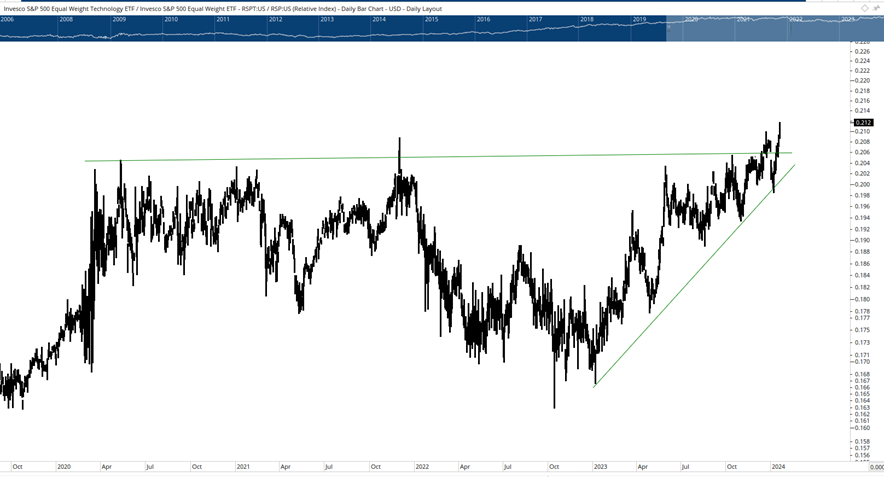
The weekly Optuma chart below highlighting Equal-weighted Technology ETF (RSPT 0.91% ) vs. E 1.59% qual-weighted SPX (RSP 0.68% ) has broken out to new all-time highs as of last week.
This is very constructive, bullish technical behavior and helps to confirm my technical beliefs that “Tech” should be an outperformer this year.
Notice the bullish base which began back in 2020 towards the left-hand side of this chart which showed Tech peaking vs. SP and consolidating into 2022.
Over the last 15 months, Technology has performed much better than many would have expected, and the outperformance last year vs. SPX has begun to accelerate even more heading into 2024.
I don’t suspect that this means Technology’s rise will prove uninterrupted in the months to come. However, given Tech’s percentage within SPX and SOX’s recent push to new all-time highs, this movement is a definite tailwind for SPX in 2024 as a whole.
RSPT ETF / RSP ETF
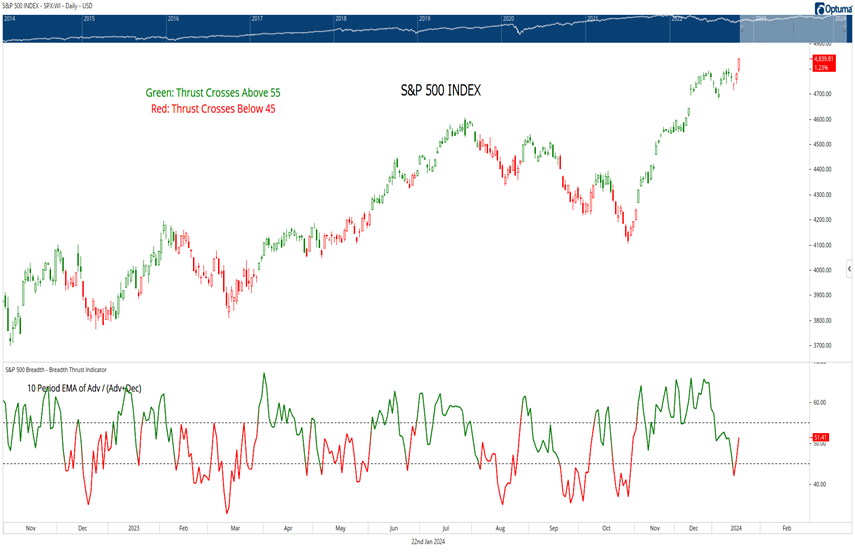
Gains to new highs amidst breadth decline is odd, but not unprecedented
The SPX chart below illustrates the ratio of 10-day Exponential Moving average of “Advancing issues/(Advancing + Declining issues)” which is plotted under the SPX chart.
When breadth is trending lower and the breadth thrust crosses below 45, SPX has declined and/or has proven choppy based on this chart going back over the last 15 months.
This latest plunge in breadth (where SPX percentage stocks > 20-day moving average plummeted quickly from 90% to under 30%) failed to correspond with any weakness.
Moreover, the periods shown in “red” below for SPX highlight when this breadth gauge has broken 45 to the downside and stays red until 55 is exceeded.
At least based on this past year, it’s been unusual to see SPX break out to new high territory when this has occurred.
However, as has been noted many times by the Financial Media, the “Magnificent Seven” stocks within SPX (AMZN -0.22% GOOGL -1.03% , AAPL 0.17% , META -0.40% , MSFT 1.82% , NVDA 1.23% , and TSLA 1.87% ) represent about 30% of the index’s market value. The combined weight is greater than any combined weight of the top seven companies in the history of the S&P 500.
Bottom line, this over-concentration can certainly allow for periods of SPX outperformance when it’s dominated by these seven stocks and they’re turning in good performance. This doesn’t imply an imminent decline in the stock market. However, it will certainly add to technical enthusiasm about the market when the broader-based rally begins, which might take a few more months.
S&P 500 Index
Gann Mass Pressure cycle composite is positive for 2024, but shows better 2H performance
Over the past couple years, I’ve discussed Gann’s Mass Pressure cycle composite, which based on my own inputs, combines the important 60-year cycle with several other cycles of importance (10, 20, 30, 40). The end result is a cycle composite which combines all these years overlapped.
(In plain English, studying history from 10 years ago, 20, 30, 40, 60, and plotting all these as a single composite can often be helpful towards showing how past highs and lows in the past sometimes can come together to be effective in the year in question.)
These don’t always work perfectly but are generally helpful to analyze and occasionally can provide interesting confluence for highs and lows.
As shown below, the early rise looks to reverse near 1/24 and pull back into mid-February before a choppy recovery which then weakens into mid-April and turns up sharply from May.
This is interesting for 2024 as the downturn in TNX cycle (which I’ve shown in recent weeks) is pinpointed to make a high by the end of the 1st quarter and turn down into Summer.
If this Mass Pressure cycle for 2024 comes to fruition, a sharp 2nd Half rally should commence which would turn higher into 2025.
While there hasn’t been any proof just yet this year of a possible 1st Quarter setback, my expectations is that this likely does happen between now and April/May and could provide opportunity for dip buyers. The 2024 Mass Pressure index cycle composite chart is shown below.
S&P 500 Index