


Today, 1/17, at 2pm ET we update our Granny Shots.
If you have not yet registered, sign up with the webinar block below.

________________________________________________
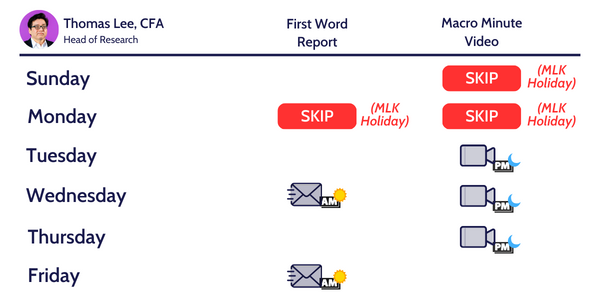
VIDEO: Tune into our Super Granny webinar at 2pm. Key thoughts. Easy money made for now. Introducing Premiere SMID Granny Shots list of 46 stocks. 10 stock changes on Granny Shots. Tune IN!!!! (Duration: 3:28).

___________________________________
- Granny Shots January Quarterly rebalance today
- Updating 5 Super and 5 Sleeper Grannies
- See below for adds and deletes
To download the slide deck for our Granny Shots Webinar, please click here.
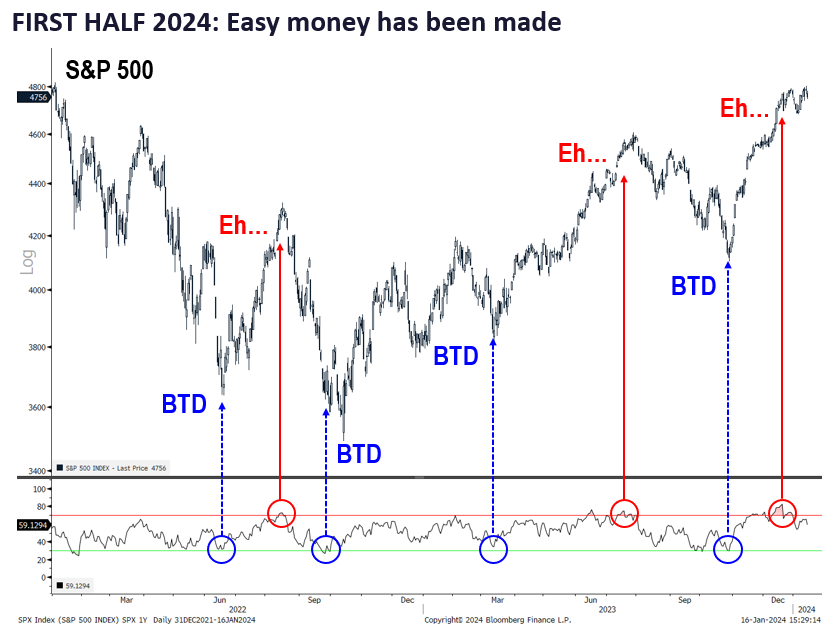
MACRO: Easy Money has been made
We are hosting a webinar today (1/17) at 2pm and the details are above (banner) and in your inbox. This is about our Super Granny update and also a bit of macro. We are launching a brand new list, called SMID Granny Shots and this is 46 stocks.
- The sloppy trading Tuesday is a reminder the easy money has been made for now. The full year tends to play out in January and this rocky start is a reminder to expect a challenging year. But the reason we see the “easy money” made is we are now overbought. So, even with new highs likely at the end of January, this is not a full “risk-on” market. Something we have discussed.
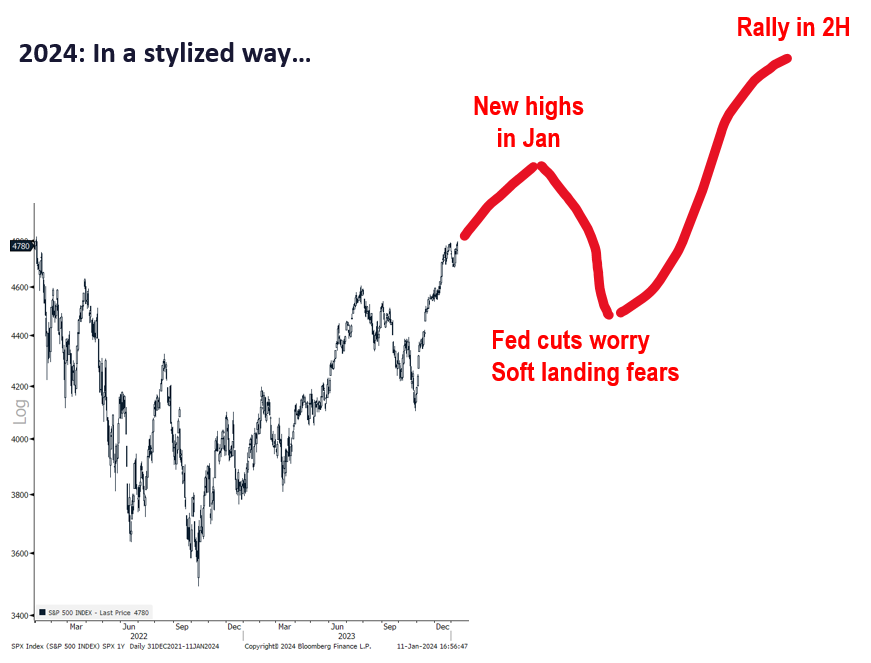
- Moreover, this is consistent with our 2024 year ahead outlook, where we expect the bulk of gains to be made in second half of 2024. That is because the first half has many unknowns that the market likely struggles with. But the two biggies:
– Soft or hard landing –> today’s weak Empire regional survey = fuels fear
– When does Fed cut? –> equity markets will get anxious about timing - Thus, we see 1H as tougher vs 2H of 2024. That is all we can sort of say for now.
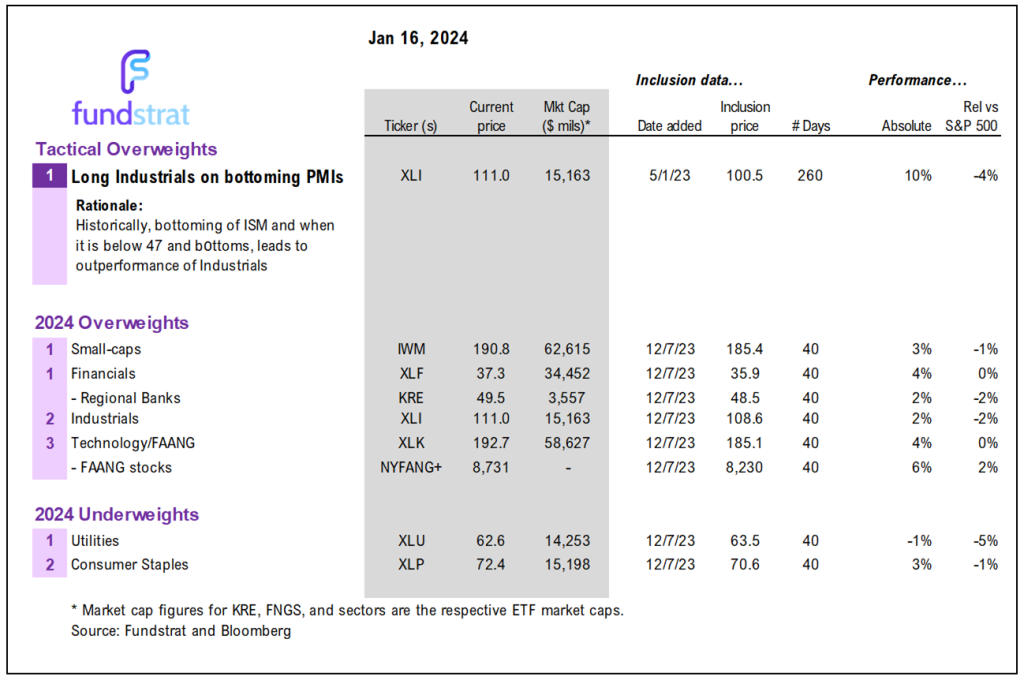
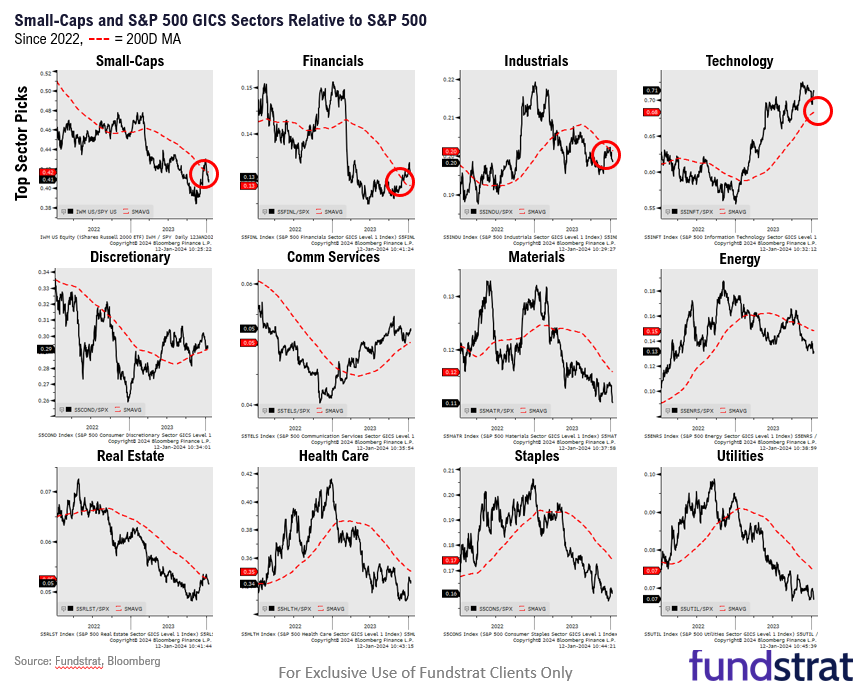
- We still favor the following 4 sectors and as the chart below shows, they are all near/above the 200-day moving average. That is a sign of strength:
– Small-caps IWM -2.65%
– Financials XLF -1.14%
– Industrials XLI -1.55%
– Technology/FAANG QQQ -1.90% XLK -2.34% - As the discussion below highlights, our Granny Shots and SMID Granny Shots offer plenty of exposure to the 4 above. And even our additions to the prior rebalance includes many of these sectors.
GRANNY SHOTS: January 2024 Rebalance
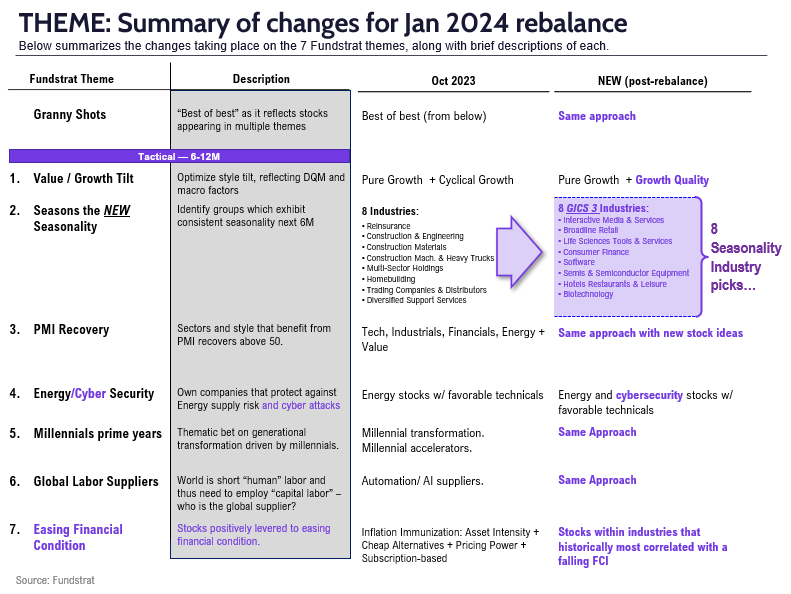
The rest of this note is focused on the quarterly rebalance of Granny Shots, and also the updated list of Super and Sleeper Grannies. We view Granny Shots as a core portfolio of stocks and the portfolio is adjusted to reflect seasonal and structural changes:
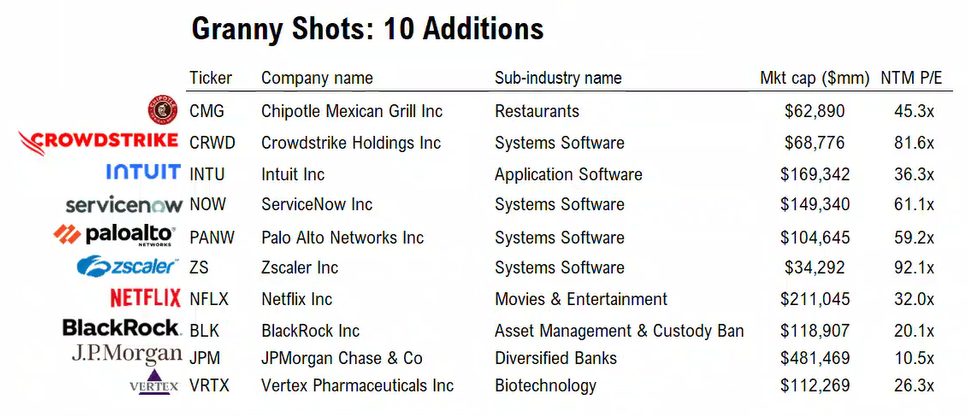
- The additions: CMG 0.18% , CRWD -2.95% , INTU -0.96% , NOW -1.66% , PANW -2.51% , ZS -2.67% , NFLX -0.19% , BLK -2.22% , JPM -3.41% , VRTX 0.08%
The deletions: BF/B, PG -0.03% , PM -0.26% , HES, VLO -0.99% , XOM 0.57% , PYPL -2.78% , FTV -0.13% , ON -2.31% , CF -0.50% - There are a lot of moving parts in a rebalance and these are both on style changes and seasonally attractive industry groups. We don’t necessarily want to focus on these as stand alone factors, but the industry groups are shown below.
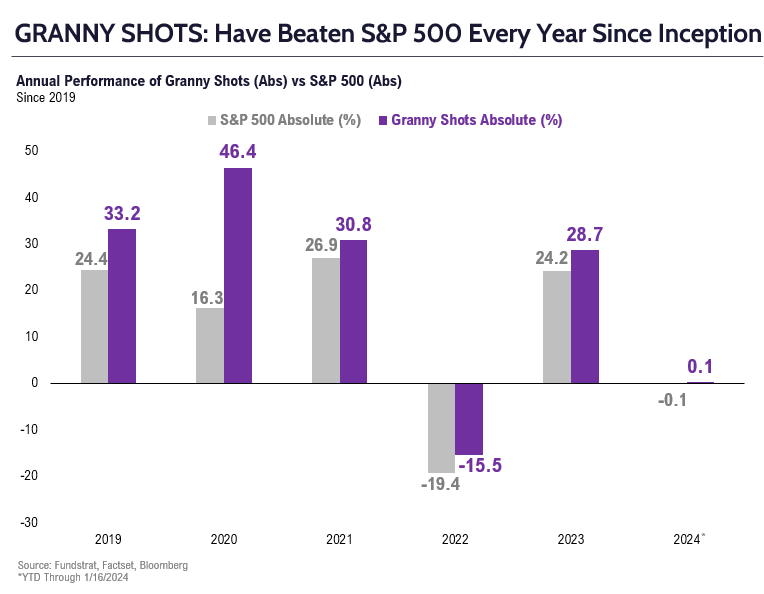
- YTD Granny Shots is up 0.11% (outperforming by +19bp vs S&P 500). This is tracking to be one of the strongest years for Granny Shots. Grannies have outperformed every single year since inception in January 2019.
- We know many do not want to buy a 36 stock list. So we have launched Super and Sleeper Grannies:
– Top 5 “most attractive” are Super Grannies
– Bottom 5 “least attractive” are Sleeper Grannies
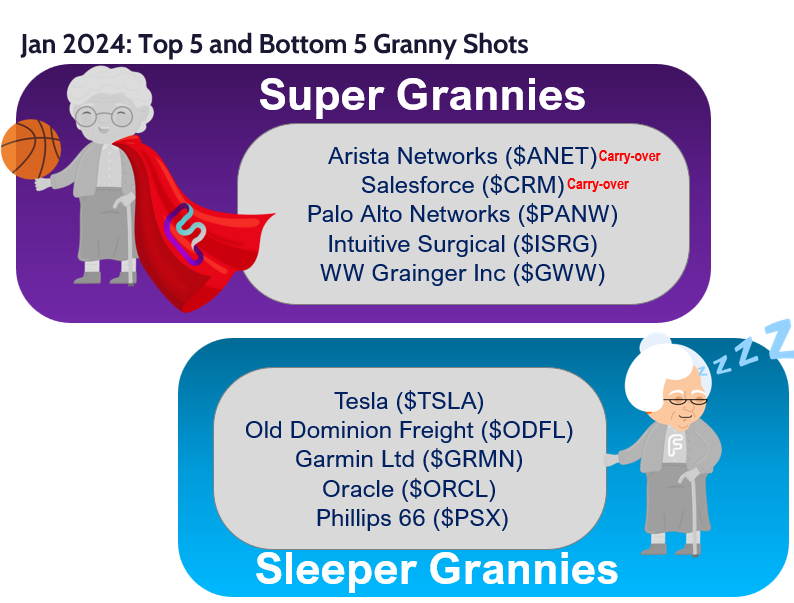
– we refresh these lists the third Wed of every month - Top 5 tactical buys aka “Super Grannies”
– Arista Networks (ANET -3.47% ) <– carry over from November
– Salesforce (CRM -2.27% ) <– carry over from November
– Palo Alto Networks (PANW -2.51% )
– Intuitive Surgical (ISRG -0.80% )
– WW Grainger Inc (GWW -1.06% ) - Bottom 5 “Sleeper Grannies” are:
– Tesla (TSLA -6.79% )
– Old Dominion Freight Line (ODFL -2.45% )
– Garmin Ltd (GRMN -1.79% )
– Oracle (ORCL -4.20% )
– Phillips 66 (PSX 1.07% )
___________________________________
REBALANCE GRANNY SHOTS: +10 adds, (-10 deletes). YTD outperformance +19bps
Today is the January quarterly rebalance of our Granny Shots portfolio.
10 rebalance additions are:
CMG 0.18% , CRWD -2.95% , INTU -0.96% , NOW -1.66% , PANW -2.51% , ZS -2.67% , NFLX -0.19% , BLK -2.22% , JPM -3.41% , VRTX 0.08%
- Chipotle Mexican Grill, Inc (CMG 0.18% )
- Crowdstrike Holdings Inc (CRWD -2.95% )
- Intuit Inc (INTU -0.96% )
- ServiceNow Inc (NOW -1.66% )
- Palo Alto Networks Inc (PANW -2.51% )
- Zscaler Inc (ZS -2.67% )
- Netflix Inc (NFLX -0.19% )
- BlackRock Inc (BLK -2.22% )
- JPMorgan Chase & Co (JPM -3.41% )
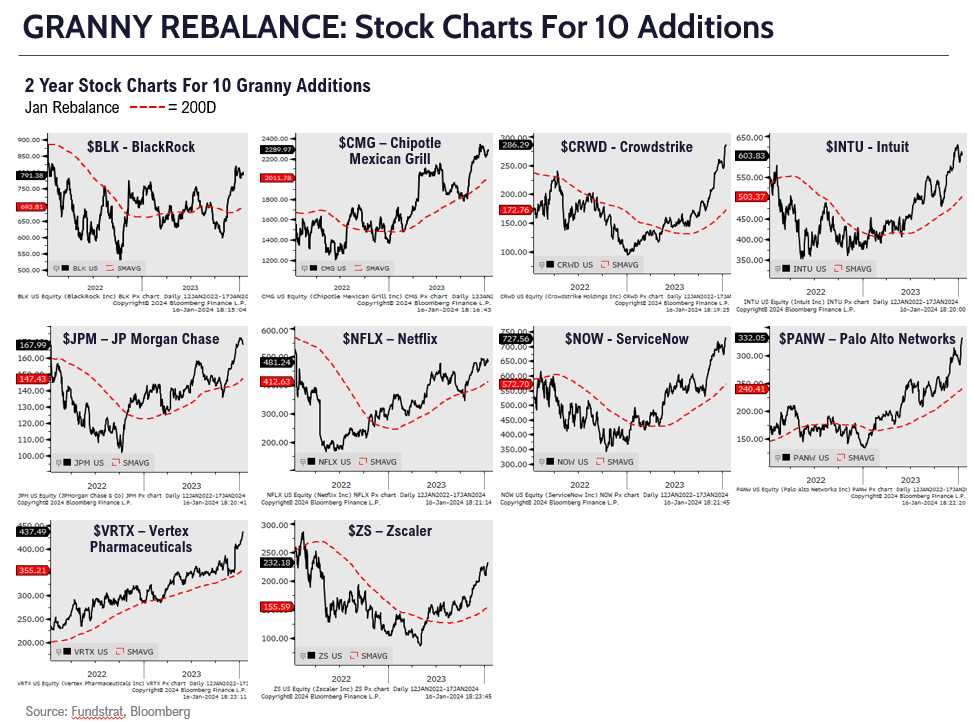
- Vertex Pharmaceuticals Inc (VRTX 0.08% )
Below are the 2-year stock charts for the 10 additions
10 rebalance deletions are:
- BF/B, PG -0.03% , PM -0.26% , HES, VLO -0.99% , XOM 0.57% , PYPL -2.78% , FTV -0.13% , ON -2.31% , CF -0.50%
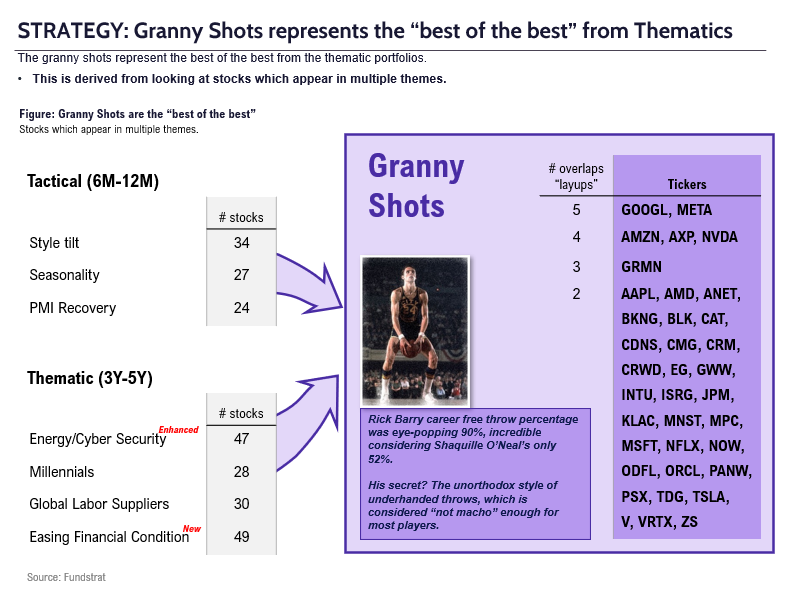
Think about Granny Shots as a “core portfolio” that we rebalance every quarter. The Granny Shots is a list of our core stock holdings, using 7 thematic/quantitative portfolios and is designed to identify long-term EPS growers. Since inception in 2019, Granny Shots has outperformed every year:
- 2019 +879bp –> great year
- 2020 +3,015bp –> great year
- 2021 +392bp –> good year
- 2022 +395bp–> good year
- 2023 +440bp–> good year
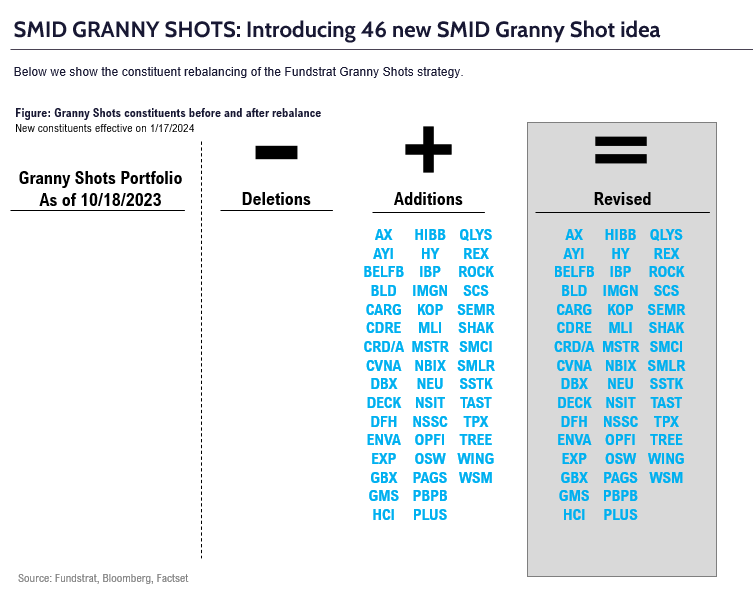
SMID GRANNY SHOTS: Introducing new SMID version of granny shots.
We introduced our Granny Shots 5 years ago (exact date Jan 10, 2019). Over the past 5 years, Granny Shots, our core portfolio recommendation, have beaten S&P 500 every year. Last December, we upgraded Small-caps to be the #1 recommendation in our 2024 year-ahead outlook. Many of our clients asked us for a SMID version of our Granny Shots. And here you go:
- The new SMID granny shots follow the same methodology as our “traditional” Granny Shots
- Recall, the Granny Shot stock ideas are the stocks that appear in at least 2 of our 7 investment strategies.
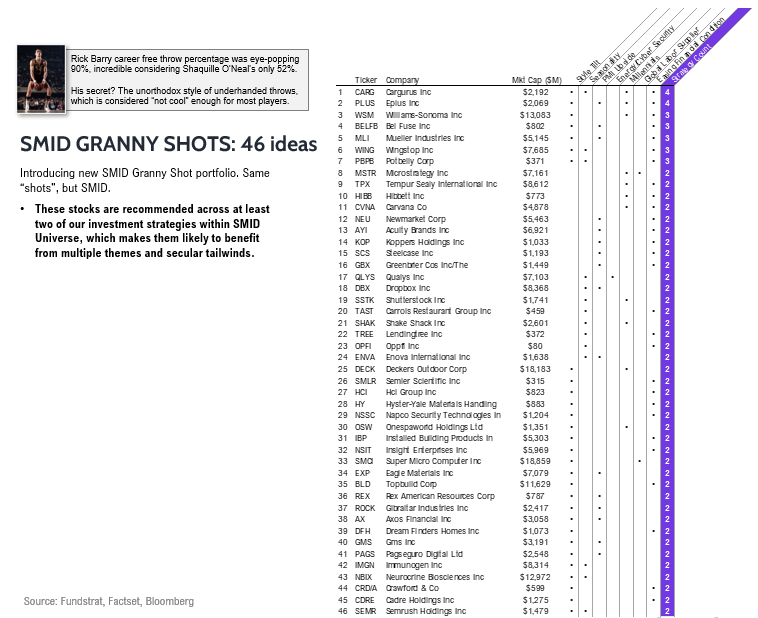
- We believe the SMID granny shots could benefit from the multiple themes and secular tailwinds as well, similarly to our “traditional” Granny Shots.
- The SMID granny shots were selected from a universe consisting of 2,293 small and mid-cap stocks.
- One key difference between our regular Granny Shots and SMID Granny Shots is that we used Asset Turnover as a key criterion in stock selection for the SMID list. The SMID Granny Shots are those with higher asset turnover rates vs their peers, or the ones that demonstrate a clear trend of improvement regarding the conversion of assets to sales.
Consumer Discretionary: BLD -3.54% , CVNA -3.10% , DECK -1.53% , DFH -1.90% , HIBB, IBP -3.02% , OSW -1.68% , PBPB, SHAK -3.65% , TAST, TPX, WING -2.59% , WSM -2.82%
Industrials: AYI -2.20% , CDRE -0.09% , GBX -0.75% , GMS, HY -1.61% , MLI -1.81% , ROCK -3.23% , SCS -0.83%
Information Technology: BELFB -4.72% , DBX -1.43% , MSTR -6.95% , NSIT -1.27% , NSSC -3.72% , PLUS -1.11% , QLYS -4.49% , SEMR -3.18% , SMCI -7.20%
Communication Services: CARG 1.60% , SSTK -4.68%
Materials: EXP -2.12% , KOP 2.94% , NEU -0.16%
Energy: REX -1.83%
Financials: AX -3.70% , CRD/A, ENVA -1.14% , HCI -2.99% , OPFI -1.73% , PAGS -1.48% , TREE -2.20%
Health Care: IMGN, NBIX -1.83% , SMLR -10.61%

SUPER GRANNIES: 5 Super and 5 Sleeper
“Super Grannies” (long) and “Sleeper Grannies” are derived from our core stock list of 36 ideas called “Granny Shots”
- The rationale is many clients ask us to narrow this list of 36 names down to a list of “fresh money” ideas.
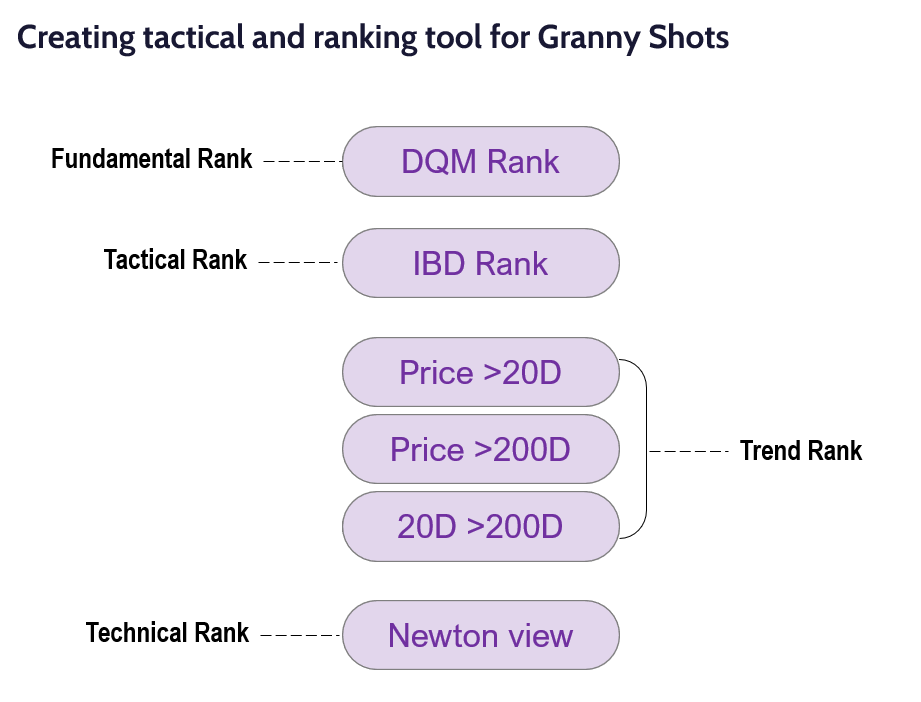
- We established a criteria of 4 factors to narrow the list to tactical buys:
– fundamentals using DQM model managed by “tireless Ken”
– IBD momentum rating
– technical strength measured by Price >20 DMA, 20 DMA vs 200 DMA and combos
– Mark Newton’s judgement on technical outlook
- We have 5 tactical buys aka “Super Grannies”
– Arista Networks (ANET -3.47% ) <– carry over from November
– Salesforce (CRM -2.27% ) <– carry over from November
– Palo Alto Networks (PANW -2.51% )
– Intuitive Surgical (ISRG -0.80% )
– WW Grainger Inc (GWW -1.06% ) - The bottom 5 “Sleeper Grannies” are:
– Tesla (TSLA -6.79% )
– Old Dominion Freight Line (ODFL -2.45% )
– Garmin Ltd (GRMN -1.79% )
– Oracle (ORCL -4.20% )
– Phillips 66 (PSX 1.07% )
TECHNICALS ON 5 SUPER GRANNY SHOTS: By Mark Newton
Arista Networks (ANET -3.47% ) – Arista continues to demonstrate superior technical strength vs. many of its peers, and currently holds the #1 ranking in performance over the last three months within Technology, beating all other 63 names on a three-month timeframe in the S&P Information Technology Index (S -2.41% 5INFT- Bloomberg) with returns of 52.95%. Weekly and monthly momentum have reached overbought levels; yet, until ANET can demonstrate some evidence of trying to peak out, its parabolic uptrend continues to grow steeper and steeper. While it’s four-month rally since September might represent reason for concern to holding a name which has gotten overbought during a time of possible market consolidation in 1Q, Technology has not demonstrated sufficient weakness to expect this sector should be on the verge of turning down. Moreover, any consolidation which happens in the month ahead likely should prove limited in scope and duration before turning back higher. Key near-term support on any pullback should be contained at $240-$245 before turning back higher. Upside technical targets lie at $262, then $280, 300 which could allow for a possible stall out on strength in the months ahead.
Salesforce (CRM -2.27% ) – Bullish, and gains look likely to upside targets near all-time highs at $311.75 which looks to be an appealing area of resistance for rallies in 2024. The act of having surpassed last July’s peak at $238.22 helped to strengthen Salesforce.com’s technical picture, and helped momentum to begin to rally sharply which largely played out in the month of November. Despite weekly momentum having gotten overbought, it’s monthly MACD remains Neutral, and still nowhere near former peaks that have been reached in recent years. Overall, CRM looks appealing technically as a software name which is slowly but surely beginning to push back to attempt to test all-time highs after a larger than average decline into late 2022 lows. Near-term pullbacks should represent attractive buying opportunities which should materialize at $235-$245 and provide a very good risk/reward opportunity for CRM on weakness.
Palo Alto Networks (PANW -2.51% ) – Palo Alto looks to be “best in breed” among the current Cyber security names, in our view, and despite its recent surge to monthly overbought levels, there remains precious little evidence of any weakness that would suggest a larger peak could be imminent. PANW began to accelerate following its May 2023 breakout above 2022 peaks, which helped this escalate sharply in both absolute and also relative terms. This has since continued with PANW’s success in breaking out of its four-month Cup and Handle pattern last November, followed by last week’s ability to have exceeded December 2023 peaks. Despite PANW having traded higher by more than 150% since it bottomed at nearly an exact one-year anniversary last January 2023, it shows no weekly, nor monthly counter-trend signs of exhaustion that would indicate it might be topping out. Furthermore, the stock has risen parabolically and has gained in momentum over the last few months which should allow for even more gains before this can stall out. Upside technical targets lie at $370, with $411 being a key alternative Fibonacci retracement projection of the prior rally from 2020. Pullbacks should offer an attractive opportunity to buy dips with support found at $292-$295.
Intuitive Surgical (ISRG -0.80% ) – This looks to be quite timely following its absolute breakout to the highest levels since November 2021. ISRG has been largely range-bound since late 2021, but this consolidation has not resulted in any meaningful; technical deterioration. Rather, this churning has taken the form of a large ascending triangle pattern that looks to have been exceeded last week on the gains above $350. Weekly momentum is upward sloping and not overbought on weekly charts given this ongoing consolidation. however, it’s thought that the recent breakout in Healthcare relative to the market can serve to help names like ISRG which looks like an excellent risk/reward. While a weekly close above $370 would help this begin to move quickly to $400+, this would be an even better risk/reward on the ability to consolidate gains in the weeks ahead. Intermediate-term technical targets lie at $433, and then $500. Meanwhile any pullback down to $340-$350 should constitute an excellent risk/reward opportunity in our view.
WW Grainger Inc (GWW -1.06% ) – Grainger has delivered a near four-year period of symmetrical upside gains in a continual pattern of rising highs and rising lows. Momentum remains positively sloped but its consolidation last year from July into October has prevented monthly RSI from reaching severe overbought levels. Pullbacks into October 2023 failed to do much technical damage and managed to successfully hold the intermediate-term uptrend before pushing higher. Until some evidence of technical deterioration, and/or upside exhaustion begins to appear, GWW remains quite constructive technically and has not given much of a reason to sell outside of being overbought. GWW -1.06% has shown gains of over 300% since March 2020 lows, which represent the last major swing low that gave way to its current symmetrical uptrend. Given that prices have just exceeded July 2023 peaks, additional upside looks probable with near-term resistance at $875-$900 and then intermediate-term resistance near $1000. Any pullbacks in the coming months likely should prove short-lived and find support near $759-$779 before pushing higher.
TECHNICALS ON 5 SLEEPER GRANNY SHOTS: By Mark Newton
Tesla (TSLA -6.79% ) – TSLA remains within a short-term and intermediate-term downtrend which began in late 2021 and has not shown proper evidence of turning higher to expect this can start to demonstrate better relative strength. Looking back in recent years, TSLA has made nearly zero progress since late 2020, over three years ago, and looks to still be in consolidation mode. Momentum gauges like MACD remain negatively sloped on weekly and monthly charts, and a bit more weakness looks likely into February/March before this can start to turn higher. Cycle projections for TSLA last year showed a good possibility of a February bottom in prices, and key support lies near $194, then $175-7 which would represent an appealing area to consider TSLA from a counter-trend perspective. Its larger symmetry suggests that a move higher is likely at some point in 2024 following this consolidation. However, we believe this will take a weekly close above $265 to jump-start TSLA’s momentum in a way that can help the trend begin to turn back higher. At present, TSLA remains a Sleeper Granny and one cannot rule out additional weakness into Spring 2024.
Oracle (ORCL -4.20% ) – ORCL has largely been trading within consolidation since the stock peaked out last June 2023 and shows insufficient signs that this recent churning has run its courses; The stock’s December 2023 gap-down decline happened on above volume, and ORCL will need to recoup $112 to have confidence this recent weakness might be complete. Despite ORCL maintaining an intermediate-term bullish uptrend, it still lies more than 15% below its all-time highs and its short-term pattern still shows a patter of lower highs and lower lows since last Summer. The ability to exceed $112 would help to jumpstart its momentum and further gains above $118 would help to lift this back to new all-time high territory. At present, this doesn’t look to have much technical upside in the next couple months, but weakness back down to $99 likely should present an attractive risk/reward for buying dips.
Garmin (GRMN -1.79% ) – GRMN’s stalling out at an exact 50% retracement level of its prior high to low swing from late 2021 looks important, and the early January decline to multi-week lows likely has kicked off a period of brief consolidation that could retrace 38-50% of what GRMN has achieved since last Fall. While its intermediate-term uptrend from October 2022 lows is still very much intact, the early January decline appears to have kicked of a period of consolidation for GRMN which has turned down a bit more sharply than other Granny Shot names. GRMN does not rank nearly as highly as many within its peer group and still lies over 30% off its all-time highs from over two years ago. Thus, while pullbacks to $110-$115 could represent an attractive opportunity for GRMN, I view its near-term prospects to be worse than average, and expect that additional consolidation might be likely into March before this can bottom out and turn higher. Any rally back above $130 would change the technical picture “for the better” for GRMN and allow for gains back up to near $140.
Old Dominion Freight Line (ODFL -2.45% ) – Old Dominion Freight Line’s consolidation since last July remains very much intact, and additional range-bound consolidation looks to be a possibility in the weeks/months ahead before this can bottom out and turn back to new highs. ODFL achieved a very constructive technical breakout last June when it surpassed prior peaks from December 2021 and February 2023. However, this breakout proved short-lived technically speaking. The act of reversing gains back under $396 proved to be a false breakout which then has resulted in short-term consolidation for this trucking name. Additional consolidation looks likely in ODFL given its pattern from last Summer’s peaks before this can begin to turn higher, based on its wave structure. Key near-term technical support lies near $367, and any break of this should lead down to $330-$350 which would be an excellent area of intermediate-term support for ODFL. Conversely, if ODFL exceeds $419 before this consolidation has played out, then a likely rally back up to new all-time highs should commence, with targets at $480, then $500.
Phillips 66 (PSX 1.07% ) – Phillips 66 has begun to turn lower in recent weeks following a successful breakout above July 2018 peaks. While larger upside breakouts of this sort could normally be considered quite bullish, PSX has just fallen to multi-week lows on its recent consolidation attempt in recent weeks. This suggests that additional weakness might be forthcoming, particularly as WTI Crude oil has struggled to turn back higher in recent weeks. Weakness down to $120, then $114 would be an appealing entry point for this name in our view. However, other names like MPC (which are also on the Granny Shot list) appear like better technical longs in the short run. Overall, Energy as a sector remains under pressure in the short run given the mean reversion which began last Fall. It’s thought that weakness into February could provide a more attractive entry for PSX and a better risk/reward opportunity than seeking to chase a move to new highs when WTI Crude has not begun moving higher. Overall, PSX looks attractive on an intermediate-term basis. However, its short-term pattern appears to require consolidation and this fits in with the theme of near-term “Sleeper” which won’t be attractive until it can consolidate some of these recent gains to new highs. Any weekly close back above $136 would postpone any weakness, suggesting immediate gains back to $160.
Key incoming data January:
1/02 9:45am ET S&P Global Manufacturing PMI December FinalMixed1/03 10am ET December ISM ManufacturingTame1/03 10am ET JOLTS Job Openings NovemberTame1/03 2pm ET December FOMC Meeting MinutesTame1/04 9:45am ET S&P Global Services & Composite PMI December FinalTame1/05 8:30am ET December Jobs ReportMixed1/05 10am ET December ISM ServicesTame1/08 9am ET Manheim Used Vehicle Index December FinalTame- 1/
11 8:30am ET December CPIDetails Suggest Tame 1/12 8:30am ET December PPITame1/16 8:30am ET January Empire Manufacturing SurveyTame- 1/17 8:30am ET January New York Fed Business Activity Survey
- 1/17 8:30am ET December Retail Sales Data
- 1/17 9am ET Manheim Used Vehicle Index January Mid-Month
- 1/17 10am EST January NAHB Housing Market Index
- 1/19 8:30am ET January Philly Fed Business Outlook Survey
- 1/19 10am ET U. Mich. Sentiment and Inflation Expectation January Prelim
- 1/24 9:45am ET S&P Global PMI January Prelim
- 1/25 8:30am ET 4QA 2023 GDP
- 1/26 8:30am ET December PCE
- 1/29 9:30am ET Dallas Fed January Manufacturing Activity Survey
- 1/30 9am ET January S&P CoreLogic CS home price
- 1/30 10am ET January Conference Board Consumer Confidence
- 1/30 10am ET JOLTS Job Openings December
- 1/31 2pm ET FOMC Rate Decision
Key incoming data December
12/01 9:45am ET S&P Global Manufacturing PMI November FinalTame12/01 10am ET November ISM ManufacturingStrong12/05 9:45am ET S&P Global Services & Composite PMI November FinalStrong12/05 10am ET JOLTS Job Openings OctoberTame12/05 10am ET November ISM ServicesStrong12/06 8:30am ET 3QF 2023 Nonfarm ProductivityStrong12/07 9am ET Manheim Used Vehicle Index November FinalTame12/08 8:30am ET November Jobs ReportTame12/08 10am ET U. Mich. Sentiment and Inflation Expectation December PrelimTame12/12 8:30am ET November CPITame12/13 8:30am ET November PPITame12/13 2pm ET FOMC Rate DecisionDovish12/14 8:30am ET November Retail Sales DataTame12/15 8:30am ET December Empire Manufacturing SurveyTame12/15 9:45am ET S&P Global PMI December PrelimTame12/18 8:30am ET December New York Fed Business Activity SurveyTame12/18 10am ET December NAHB Housing Market IndexTame12/19 9am ET Manheim Used Vehicle Index December Mid-MonthTame12/20 10am ET December Conference Board Consumer ConfidenceTame12/21 8:30am ET 3QT 2023 GDPMixed12/21 8:30am ET December Philly Fed Business Outlook SurveyMixed12/22 8:30am ET November PCETame12/22 10am ET: U. Mich. Sentiment and Inflation Expectation December FinalTame12/26 9am ET December S&P CoreLogic CS home priceTame12/26 10:30am ET Dallas Fed December Manufacturing Activity SurveyTame12/29 9:45am ET December Chicago PMI
Key incoming data November
11/01 9:45am ET S&P Global PMI October FinalTame11/01 10am ET JOLTS Job Openings SeptemberMixed11/01 10am ET October ISM ManufacturingTame11/01 10am ET Treasury 4Q23 Quarterly Refunding Press ConferenceTame11/01 2pm ET FOMC Rate DecisionDovish11/02 8:30am ET: 3Q23 Nonfarm ProductivityTame11/03 8:30am ET October Jobs ReportTame11/03 10am ET October ISM ServicesMixed11/07 9am ET Manheim Used Vehicle Index October FinalTame11/10 10am ET U. Mich. November prelim Sentiment and Inflation ExpectationHot11/14 8:30am ET October CPITame11/15 8:30am ET October PPITame11/15 8:30am ET November Empire Manufacturing SurveyResilient11/15 8:30am ET October Retail Sales DataResilient11/16 8:30am ET November New York Fed Business Activity SurveyTame11/16 8:30am ET November Philly Fed Business Outlook SurveyTame11/16 10am ET November NAHB Housing Market IndexTame11/17 9am ET Manheim Used Vehicle Index November Mid-MonthTame11/21 2pm ET Nov FOMC Meeting MinutesTame11/22 10am ET: U. Mich. November final Sentiment and Inflation ExpectationTame11/24 9:45am ET S&P Global PMI November PrelimMixed11/27 10:30am ET Dallas Fed November Manufacturing Activity SurveyTame11/28 9am ET November S&P CoreLogic CS home priceTame11/28 10am ET November Conference Board Consumer ConfidenceTame11/29 8:30am ET 3QS 2023 GDPStrong11/29 2pm ET Fed Releases Beige BookTame11/30 8:30am ET October PCETame
Key incoming data October
-
10/2 10am ET September ISM ManufacturingTame -
10/3 10am ET JOLTS Job Openings AugustHot -
10/4 10am ET September ISM ServicesTame 10/6 8:30am ET September Jobs ReportMixed-
10/6 9am ET Manheim Used Vehicle Index September FinalTame 10/10 11am NY Fed Inflation ExpectationsMixed-
10/11 8:30am ET September PPIMixed 10/11 2pm ET Sep FOMC Meeting MinutesTame-
10/12 8:30am ET September CPIMixed -
10/13 10am ET U. Mich. September prelim 1-yr inflationMixed 10/16 8:30am ET October Empire Manufacturing SurveyTame10/17 8:30am ET October New York Fed Business Activity SurveyTame10/17 8:30am ET September Retail Sales DataHot10/17 9am ET Manheim October Mid-Month Used Vehicle Value IndexTame10/17 10am ET October NAHB Housing Market IndexTame10/18 8:30am ET September Housing StartsTame10/18 2pm ET Fed releases Beige BookTame10/19 8:30am ET October Philly Fed Business Outlook SurveyTame10/19 10am ET Existing Home SalesTame10/19 12pm ET Fed (including Powell) at Economic Club of New York10/24 9:45am ET S&P Global PMI October PrelimTame-
10/26 8:30am ET 3Q 2023 GDP AdvanceStrong 10/27 8:30am ET September PCETame10/27 10am ET Oct F UMich Sentiment and Inflation expectationTame10/30 10:30am ET Dallas Fed September Manufacturing Activity SurveyTame10/31 8:30am ET 3Q23 Employment Cost IndexMixed10/31 9am ET August S&P CoreLogic CS home priceMixed10/31 10am ET October Conference Board Consumer ConfidenceTame
Key incoming data September
9/1 8:30am ET August Jobs ReportTame9/1 10am ET August ISM ManufacturingTame9/6 10am ET August ISM ServicesMixed9/6 2pm ET Fed releases Beige BookTame9/8 9am ET Manheim Used Vehicle Index August FinalTame9/8 2Q23 Fed Flow of Funds ReportTame-
9/13 8:30am ET August CPIMixed -
9/14 8:30am ET August PPITame -
9/15 8:30am ET September Empire Manufacturing SurveyTame 9/15 10am ET U. Mich. September prelim 1-yr inflationTame-
9/18 8:30am ET September New York Fed Business Activity SurveyTame -
9/18 10am ET September NAHB Housing Market IndexTame 9/19 9am ET Manheim September Mid-Month Used Vehicle Value IndexMixed9/20 2pm ET September FOMC rates decisionMarket saw Hawkish-
9/21 8:30am ET September Philly Fed Business Outlook SurveyMixed 9/22 9:45am ET S&P Global PMI September Prelim9/25 10:30am ET Dallas Fed September Manufacturing Activity Survey9/26 9am ET July S&P CoreLogic CS home price9/26 10am ET September Conference Board Consumer Confidence
Key incoming data August
8/1 10am ET July ISM ManufacturingTame8/1 10am ET JOLTS Job Openings JunTame8/2 8:15am ADP National Employment ReportHot8/3 10am ET July ISM ServicesTame8/4 8:30am ET July Jobs reportTame8/7 11am ET Manheim Used Vehicle Index July FinalTame8/10 8:30am ET July CPITame8/11 8:30am ET July PPITame8/11 10am ET U. Mich. July prelim 1-yr inflationTame8/11 Atlanta Fed Wage Tracker JulyTame8/15 8:30am ET Aug Empire Manufacturing SurveyMixed8/15 10am ET Aug NAHB Housing Market IndexTame8/16 8:30am ET Aug New York Fed Business Activity SurveyNeutral8/16 2pm ET FOMC MinutesMixed8/17 8:30am ET Aug Philly Fed Business Outlook SurveyPositive8/17 Manheim Aug Mid-Month Used Vehicle Value IndexTame8/23 9:45am ET S&P Global PMI Aug PrelimWeak8/25 10am ET Aug Final U Mich 1-yr inflationMixed8/28 10:30am ET Dallas Fed Aug Manufacturing Activity SurveyTame8/29 9am ET June S&P CoreLogic CS home priceTame8/29 10am ET Aug Conference Board Consumer ConfidenceTame8/29 10 am ET Jul JOLTSTame8/31 8:30am ET July PCETame
Key incoming data July
7/3 10am ET June ISM ManufacturingTame7/6 8:15am ADP National Employment ReportHot7/6 10am ET June ISM ServicesTame7/6 10 am ET May JOLTSTame7/7 8:30am ET June Jobs reportMixed7/10 11am ET Manheim Used Vehicle Index June FinalTame7/12 8:30am ET June CPITame7/13 8:30am ET June PPITame7/13 Atlanta Fed Wage Tracker JuneTame7/14 10am ET U. Mich. June prelim 1-yr inflationMixed7/17 8:30am July Empire Manufacturing Survey7/18 8:30am July New York Fed Business Activity Survey7/18 10am July NAHB Housing Market Indexin-line7/18 Manheim July Mid-Month Used Vehicle Value IndexTame7/25 9am ET May S&P CoreLogic CS home priceTame7/25 10am ET July Conference Board Consumer ConfidenceTame7/26 2pm ET July FOMC rates decisionTame7/28 8:30am ET June PCETame7/28 8:30am ET 2Q ECI Employment Cost IndexTame7/28 10am ET July Final U Mich 1-yr inflationTame
Key data from June
6/1 10am ET May ISM ManufacturingTame6/2 8:30am ET May Jobs reportTame6/5 10am ET May ISM ServicesTame6/7 Manheim Used Vehicle Value Index MayTame6/9 Atlanta Fed Wage Tracker AprilTame6/13 8:30am ET May CPITame6/14 8:30am ET May PPITame6/14 2pm ET April FOMC rates decisionTame6/16 10am ET U. Mich. May prelim 1-yr inflationTame6/27 9am ET April S&P CoreLogic CS home priceTame6/27 10am ET June Conference Board Consumer ConfidenceTame6/30 8:30am ET May PCETame6/30 10am ET June Final U Mich 1-yr inflationTame
Key data from May
5/1 10am ET April ISM Manufacturing (PMIs turn up)Positive inflection5/2 10am ET Mar JOLTSSofter than consensus5/3 10am ET April ISM ServicesTame5/3 2pm Fed May FOMC rates decisionDovish5/5 8:30am ET April Jobs reportTame5/5 Manheim Used Vehicle Value Index AprilTame5/8 2pm ET April 2023 Senior Loan Officer Opinion SurveyBetter than feared5/10 8:30am ET April CPITame5/11 8:30am ET April PPITame5/12 10am ET U. Mich. April prelim 1-yr inflationTame5/12 Atlanta Fed Wage Tracker AprilTame5/24 2pm ET May FOMC minutesDovish5/26 8:30am ET PCE AprilTame5/26 10am ET U. Mich. April final 1-yr inflationTame5/31 10am ET JOLTS April job openings
_____________________________
The Granny Shots page will be updated shortly. See above for more details on this rebalance.
______________________________
PS: if you are enjoying our service and its evidence-based approach, please leave us a positive 5-star review on Google reviews —> Click here.


