US Equities still don’t appear to be at support, though this is growing closer and could materialize initially next week given the combination of oversold breadth, worsening sentiment, and a drying up in selling in some of the formerly hardest hit sectors. Trends, momentum and breadth remain bearish and pointed lower; Overall, given widespread technical damage in many sectors it’s going to be important to see more evidence of a rolling over in both US Dollar and Treasury yields to have confidence of a sustainable rebound. Bottom line, I suspect an initial low should materialize next week
US Equities failed to follow-through on early bounce attempts, and pulled back to lows of the day and for the week with SPX and QQQ trading right above important 50% and 38.2% retracement areas, respectively.
Of the various metrics I laid out earlier this week as to why Stock indices should bottom, a few stand out as being particularly important heading into next week:
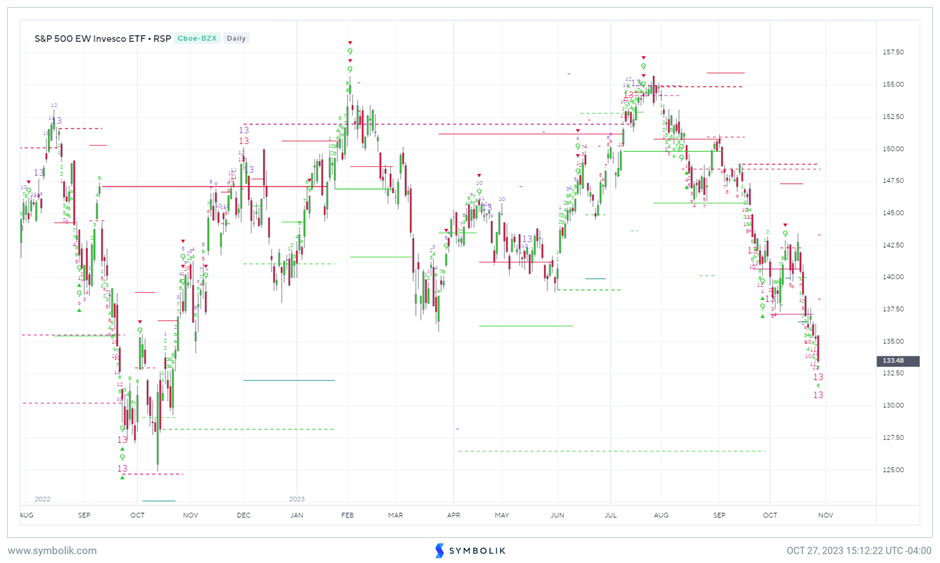
- Counter-trend exhaustion per DeMark indicators is highly likely to materialize on Equal-weighted S&P 500 next week with a good likelihood of SPX and QQQ as having the potential to signal exhaustion ahead of FOMC.
- Breadth has gotten compressed and has started to diverge when eyeing the percentage of stocks above their respective 50-day moving averages along with McClellan Oscillator
- Sentiment has gotten more bearish as this week has drawn to a close. AAII Bears widened out to show more than 13 percentage points above Bulls, Equity Put/call ratio is now near early October peaks, while NAAIM is back to the lowest levels since March.. The Fear and Greed poll is also back to “Extreme Fear” category and has worsened this week.
- SPX and QQQQ are now nearing important areas near their respective 50% and 38.2% Retracement areas of the former advance from last October. These are far more important than a 200-day moving average in my view.
- Small-caps have begun to reflect counter-trend exhaustion buy signals vs. QQQ along with the Mid-cap 400 index on weekly charts this week.
- Elliott-wave structure shows the near completion of a 5-wave decline from July. Both of the two prior swings lasted between 26 and 30 days, making this latest decline nearing a key period where this also should bottom.
- 90-day cycles from late July highs pinpoint this time for a change in trend, and 180-day projection from the low in late April also pinpoints late October.
- October might have the dubious distinction of closing negative to complete a negative August/September/October three month period of negative returns which has only happened on one other occasion (2016) since 1990.
- Two of the most important “pieces” of the puzzle of SPX constituent sectors- Financials and Healthcare, are both within striking distance of October 2022 lows which should cause support to materialize next week.
Overall, these reasons seem proper to pay attention to as bullish reasons that suggest our decline should come to completion potentially next week. Daily Symbolik charts of Equal-weighted S&P 500 ETF (RSP 0.49% ), shown below, shows two separate counter-trend DeMark related exhaustion signals with another due on Monday 10/30/23. Markets look close to bottoming.

Gold Miners Bullish for a push back to at least 50-61.8% of the prior drawdown
Gold and Silver look quite attractive given the uptick in geopolitical violence at a time when interest rates have begun to stall out. While a brief move to 5.05-5.20% can’t be ruled out for TNX, the upside should prove minimal for Yields and should translate into a buying opportunity for Treasuries.
Gold as a commodity has shown very little consolidation since its minor peak early last week, and suffered no real damage on its consolidation. Now, prices are pushing higher again and Friday’s close saw Gold hit the highest levels since Spring 2023.
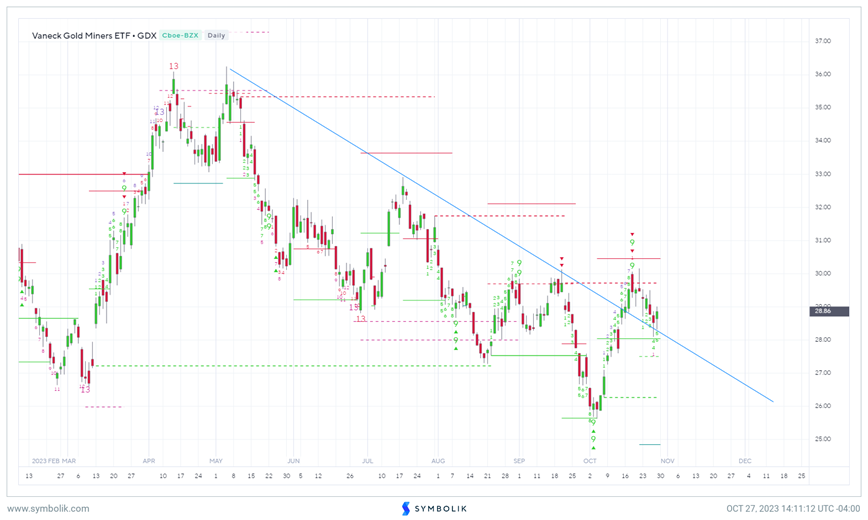
This is bullish for Gold and Silver Mining stocks which broke out along with Gold and Silver into mid-October but have shown more consolidation since that time.
GDX 3.31% , the VanEck Gold Miners ETF managed to break out of its entire downtrend from early this year and have pulled back to consolidate gains this week.
This area looks quite bullish for Gold Miners, and I expect some upcoming rally in GDX back to July highs at $32.11 at a minimum from its current $29.21 close and over this would invite a push back to challenge and possibly break out above Spring highs just above $36.
Overall, in a market where very few things have worked this week, Gold miners look attractive as an area which can offer outperformance at a time when rates should be close to peaking out.

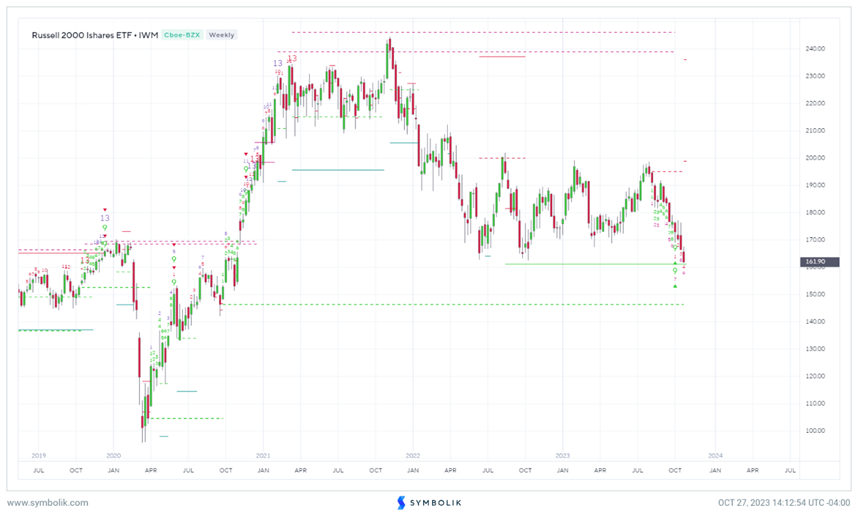
Weekly IWM close hits lowest levels since 2020
The Russell 2000 ETF, IWM -0.18% should begin to perform better vs. both QQQ along with Mid-caps in the weeks to come.
While this week’s close at the lowest levels in nearly three years makes it difficult to yet expect a bottom on an absolute basis, I expect this will be in place by late November.
Furthermore, my comments yesterday are important to reiterate as I am not calling for an imminent bottom in the Russell 2000. However, I do feel that IWM outperforms QQQ in the weeks and possibly months to come. Furthermore, Small-caps vs. Mid-caps should begin to reverse back higher also in the near future.
Bottom line, the appeal of Small-caps lies on a relative basis only at present, but should be attractive on both an absolute and relative basis starting next month after reaching very compressed levels.

Ford joins GM 0.87% in breaking a 15-month area of support
I feel that both Ford and GM likely drift lower in the weeks and months to come, and the entire Auto-related Retail space might also be vulnerable following the huge period of outperformance in recent years.
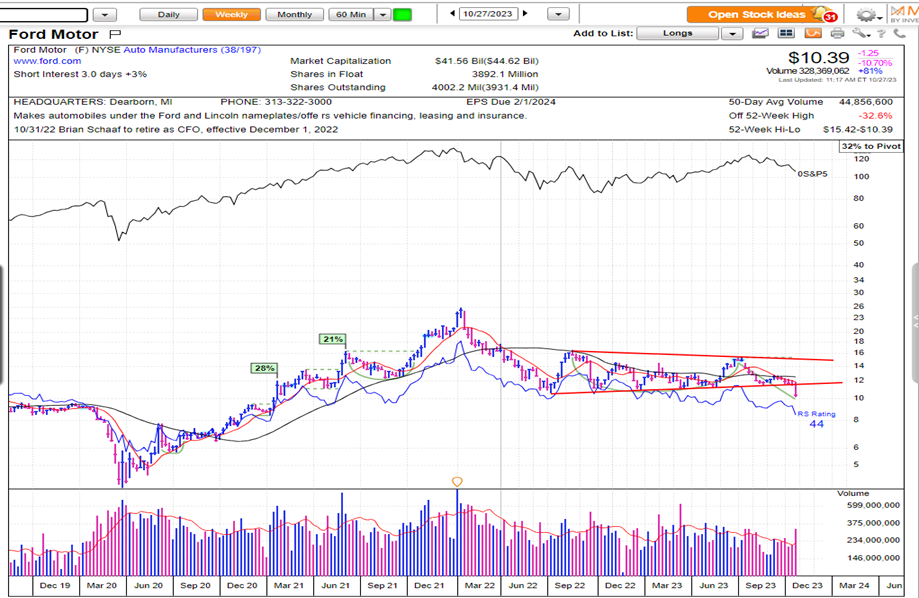
Ford (F 1.13% ) decline on Friday was a textbook technical breakdown which mirrored that which GM showed a few weeks ago. Ford broke lows of a very tight consolidation pattern which had held for more than 15 months.
This decline occurred on heavy volume, suggesting that this stock’s one-day large-range breakdown might not be the immediate buying opportunity which many valuation driven investors expect following large declines. I expect a move down to at least $7.50, and the Automobiles sub-sector is unattractive to me for the 4th quarter 2023.
Overall, following a high-volume breakout higher or lower of a lengthy tight consolidation which has been tested numerous times, it’s normally wise to expect follow-through that fundamentals typically cannot explain. In this case, the bearish technical breakdown argues for investors to avoid Ford stock in the short run.


