US Equity indices and Treasury yields remain quite choppy, but the weakness coinciding with Yields pushing up still looks to extend this week which is one of the more seasonally bearish weeks of the Fall. Trends and momentum arguably are short-term negative. Only on a TNX break under 4.05% would it be right to trust an Equity bounce in September, in my view
This week has historically proven to be one of the worst of the year seasonally speaking and Treasury yields remain trading at/near highs for 2023. While this week’s FOMC meeting, or BOJ could serve to be important catalysts for risk assets, there hasn’t been sufficient strength in Equities nor Treasuries to weigh in technically that a push back to SPX 4600 is imminent.
While Technology held up fairly well relative to the broader market on Monday, other sectors like Materials, Healthcare, REITS, Consumer Staples, and Consumer Discretionary all fell to multi-day lows.
Technology, to its credit, proved to be the single positive sector in Monday’s session when viewing the major Equity ETF’s in Equal-weighted terms, and Technology’s Equal-weighted and Cap-weighted ETF’s (RSPT -0.04% and XLK -0.57% , respectively) both rose to close the session positively.
Equal-weighted SPX relative to S&P 500 in ratio form fell to the lowest levels since 2020, demonstrating that, outside of Technology, many sectors just aren’t doing that well.
Overall, I view this as a difficult, choppy market in the short run, and it will be dependent on US Treasury yields and the US Dollar to turn down before having more confidence in US stocks starting to turn back higher.
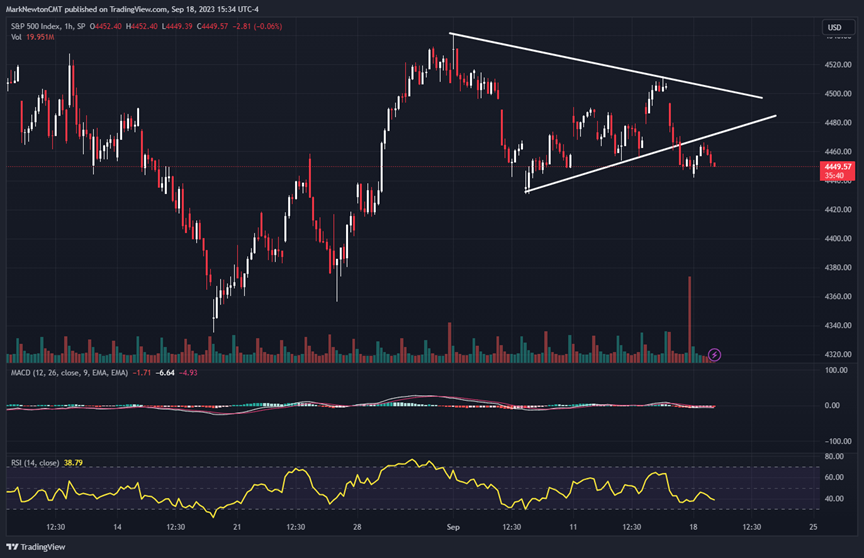
Important areas on the upside, which if exceeded, would serve to turn the trend back positive technically lie at SPX- 4541 and QQQ-381. On the downside, it looks increasingly likely that a test of SPX-4400 could happen. Meanwhile, QQQ looks to have important support initially near 367, then 360-2.
As shown below, this downside break of the hourly SPX triangle is not constructive technically. This looks to likely bring about more weakness during this historically bearish post-expiration week.
Equal-weighted SPX has fallen to the lowest in over two years vs. SPX
Many sectors falling to new weekly lows have resulted in the Equal-weighted SPX falling to its lowest levels since 2020.
The 2nd and 3rd biggest sectors within SPX, Healthcare and Financials, have both underperformed sharply in recent weeks, and haven’t shown convincing signs of turning back higher.
Meanwhile, some of this ratio’s decline can be explained by Technology’s strength, given Tech’s dominance within SPX. Thus, a downturn in Equal-weighted SPX relative to SPX can also mean that Technology is outperforming.
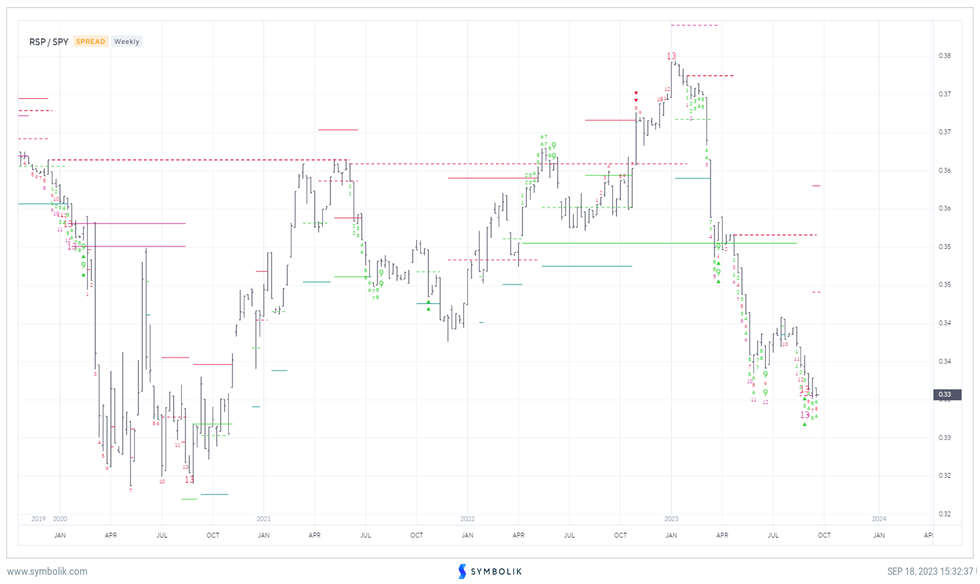
The weekly RSP 0.86% vs SPY -0.13% chart below showed a pronounced breakout in early 2022 which marked the start of Technology’s underperformance. Meanwhile the peak in early 2023 also represented a turning point for Technology (this time, Tech bottomed and broke out in relative terms).
Yet, the underperformance in Small-cap and Mid-cap stocks and ongoing short-term downtrends in many sectors (i.e. Discretionary, Industrials, Materials, Transportation stocks along with many defensive sectors like REITS and Staples) remain very much intact.
It’s thought that broader sector participation would be helpful towards having more faith in a larger October SPX rally, and for now, much of the ability for SPX to have held up, is largely due to Technology resilience.
This ratio chart of RSP to SPY looks to be potentially within three-to-four weeks of bottoming. This could mean that either Technology is close to a larger relative peak, or that lagging sectors like Transports, Regional banks, Healthcare could be close to turning back higher.
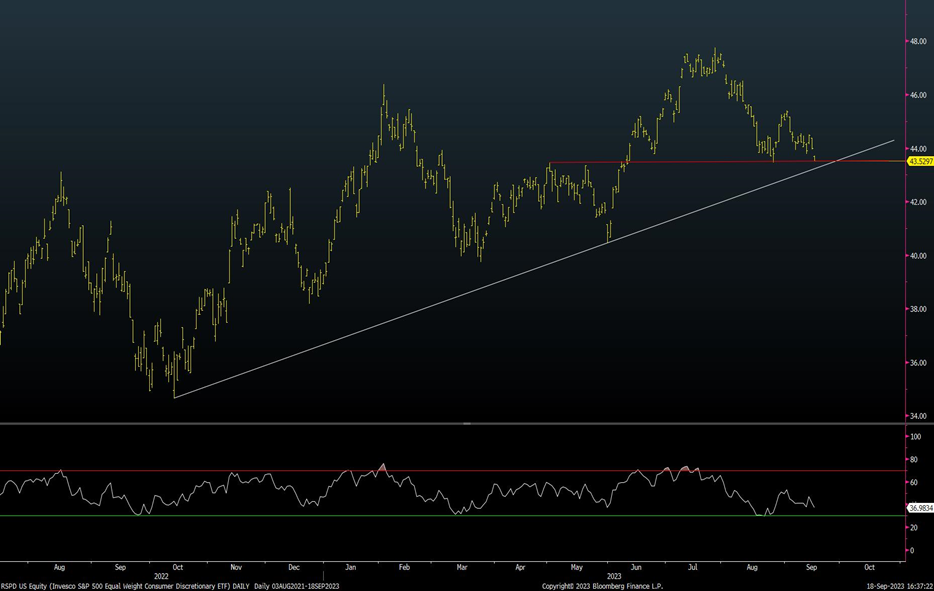
Discretionary getting near initial support; However, it’s doubtful technically that this holds
Discretionary’s underperformance in the last month is largely related to the decline in many top Retailers like BBY 0.44% , and TGT 2.34% , not to mention NKE which have all underperformed lately along with a backing off in casino stocks like LVS 3.85% .
Monday’s breakdown in absolute terms for Equal-weighted Consumer Discretionary reached the lowest levels since June, but appears to be nearing a make-or-break area of support.
Current prices lie near prior highs from April 2023 along with adjoining a larger uptrend from last Fall, 2022.
However, I do not suspect Discretionary is ready to bottom right away, and this might take time. Retail overall, when measured by its SPDR S&P Retail ETF, XRT 1.38% has broken down to new four-month lows, and Consumer Discretionary relative to SPX has been trending down for years on an intermediate-term basis.
Despite Discretionary’s bounce from 2022, this does not look appealing technically, and I feel that this sector should underperform the broader SPX between now and end of year.
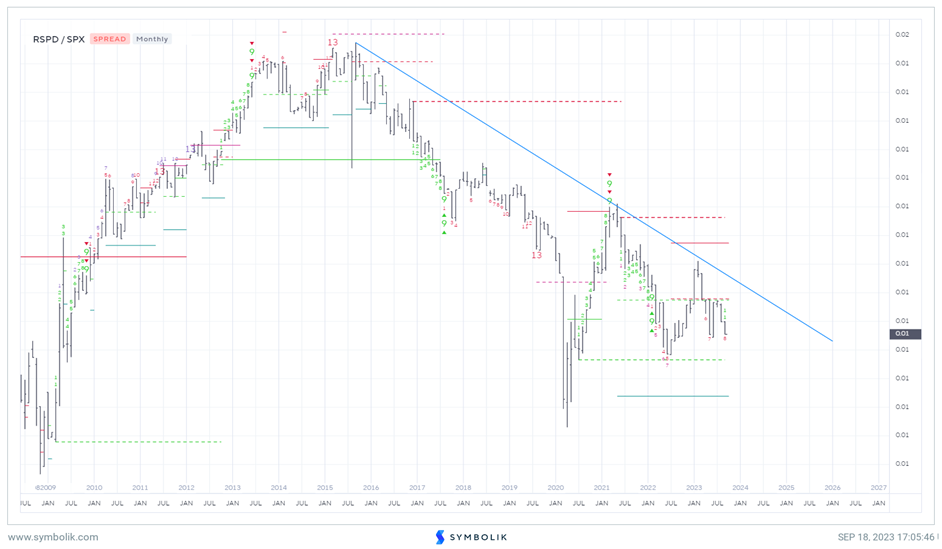
Consumer Discretionary could likely underperform into year-end
This relative chart of Consumer Discretionary in relative terms to SPX might be eye-opening for those who remember the outperformance for most of 2H 2022 for Discretionary.
As it turns out this was merely part of a longer-term downtrend, and has backed off sharply this year.
While my technical ranking of Consumer Discretionary is “Neutral” for 2023, this would move to Underweight if Discretionary breaks down vs. SPX under June lows.
The chart below represents the Equal-weighted Consumer Discretionary sector ETF (RCD 1.92% ) vs. S&P 500.
It’s important to highlight technically speaking that 2022’s late year rally in Discretionary stocks peaked out in February 2023 without having achieved a lengthier relative breakout vs the SPX.
Thus, this remains trending lower from 2015 in an eight-year downtrend of lower highs, but has made some minor stabilization efforts since 2020.
This looks quite vulnerable in the months ahead given the degree of weakness in May 2023 along with August and early September’s underperformance (As mentioned above, XRT 1.38% has just made a technical breakdown in declining to the lowest levels since June)
Technically, I’m expecting a retest of June 2022 lows in relative terms over the final three months of 2023. Thus, most Consumer Stocks remain under pressure and Discretionary does not look like a sector to Overweight in the short run.