
US Equity indices and Treasury yields remain quite choppy, but the path of least resistance remains lower over the final couple weeks of September. Treasury yields look likely to break out to new 2023 highs, and I suspect this will be short-term negative for Equities. Only on a TNX break under 4.05% would it arguably be right to trust an Equity bounce in Sept.
S&P’s range-bound pattern remains intact, but it’s important to relay that momentum and breadth have gotten worse in recent weeks.
Furthermore, despite Technology’s strength over the rolling 1-month period (Tech is the 2nd best performing sector behind Energy over the last month) other sectors like Healthcare and Industrials have not been acting well. Furthermore, Financials have seen pronounced weakness within the Regional bank space, and look to be at key resistance in relative terms to SPX.
Simply stated, if Technology can hold up, and maintain relative uptrends vs. S&P, it’s likely that any market selloff proves short-lived, even if sectors like Industrials don’t act as well.
However, one needs Healthcare and Financials to start working better to have real confidence that the market might start to broaden out. Those two sectors account for more than 25% of the S&P 500.
Looking back at Wednesday’s trading, one might have suspected that a backing off in Treasury yields might be quite bullish for Equities. Yet, despite the positive finish for SPX and QQQ, more stocks declined than advanced in trading on Wednesday. Only Utilities and Healthcare showed gains on the session, (on an Equal-weighted basis) while the other nine sectors lost ground.
Technically speaking, I am taking a near-term defensive stance given the downward sloping nature of S&P Cycles this month along with the resilience in Treasury yields which are very close to breaking out to new monthly highs.
Overall, I certainly will respect if/when US Equity indices start to trade better, and begin to break out to new weekly highs. However, the internal price action in many sectors seems to be suggesting the opposite.
This week’s critical SPX areas technically lie at the following levels:
Support 4430, 4335, 4260
Resistance- 4541, 4600
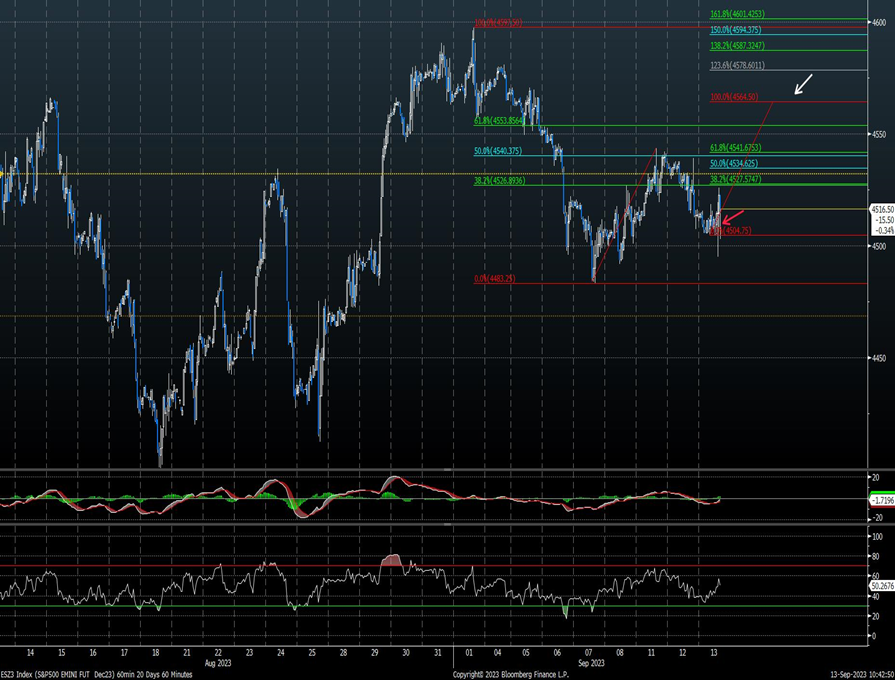
Given that September Futures contracts are expiring this week, it’s right to look at December futures which are shown below. While one can’t rule out a move to 4450-4465 in December S&P Futures, this should be an area to consider strong resistance. For SPX cash, this level lies at 4541. Until/unless 9/1 peaks are exceeded, it’s more likely that gains should prove short-lived.
Furthermore, any daily close back under SPX 4430 would prove to be quite challenging for the near-term bullish case. The next 3-5 days should go a long ways towards helping resolve some of this recent churning behavior.
Regional Banks remain a source of weakness
Despite interest rates having turned back higher over the last couple months, Regional banks have underperformed the broader KBW Banks index sharply since late July.
KRE 1.66% has lost over 10% since early August, and looks to potentially weaken down to the high $30’s on an absolute basis before finding much support.
Wednesday’s (9/13) decline fell to the lowest daily closing levels since late July, and exhaustion signals which might lead to stabilization remain premature.
Daily charts of Equal-weighted Financials vs. Equal-weighted S&P 500 (RSP 0.77% ) now show TD Sequential 13 Countdown exhaustion signals after a minor bounce in this group lately. So outside of Regional bank weakness, the entire Financial sector might be vulnerable into October if this signal is confirmed.
Bottom line, Financials remain an Underweight for me, and any evidence of Regional Bank weakness that begins to extend to other parts of Financials in a way where the group begins to turn back lower vs. the S&P 500 in relative terms might serve as a near-term headwind for US Stock indices. At present, it’s charts of Regional banks relative to the KBE that I felt worth highlighting. However, outside the Regional banks, it’s notable that stocks like JPM 0.85% , AXP 1.01% , SCHW -0.19% , BAC -1.60% are all lower by more than 4% in the last month.
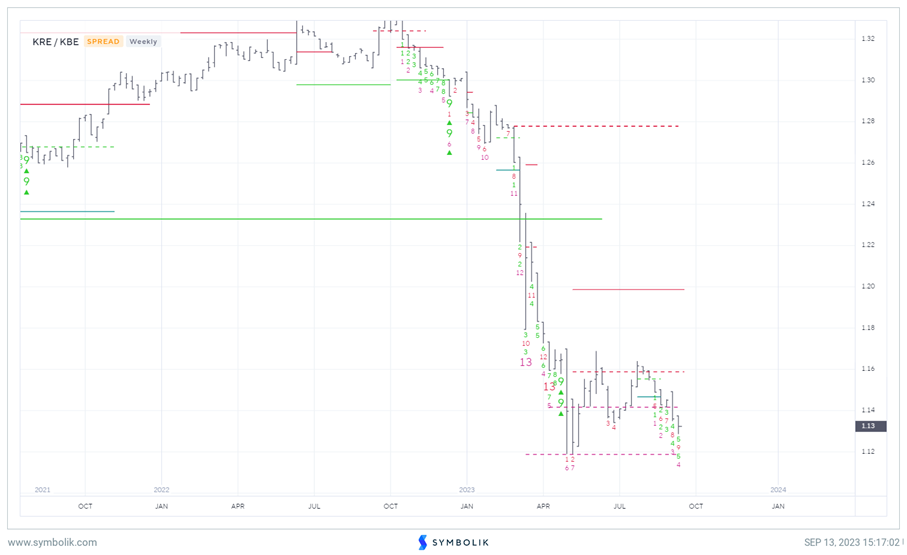
Weekly Symbolik charts of KRE 1.66% vs KBE -0.56% (KBW Banks index) in ratio form is shown below. Technically, this would require another four weeks at a minimum before finding any sort of weekly Exhaustion. Thus, further relative weakness looks likely to test Spring 2023 relative lows for KRE 1.66% vs. KBE -0.56% , and Regional Banks do not look like a group to favor over the next 1-2 months.
Industrials breaking down to monthly lows
While Technology has proven strong over the last month, and has successfully managed to hold up reasonably well despite Treasury yields pushing to within striking distance of 2023 highs, other sectors like Retail (XRT and Industrials have just broken August lows as of Wednesday’s close.
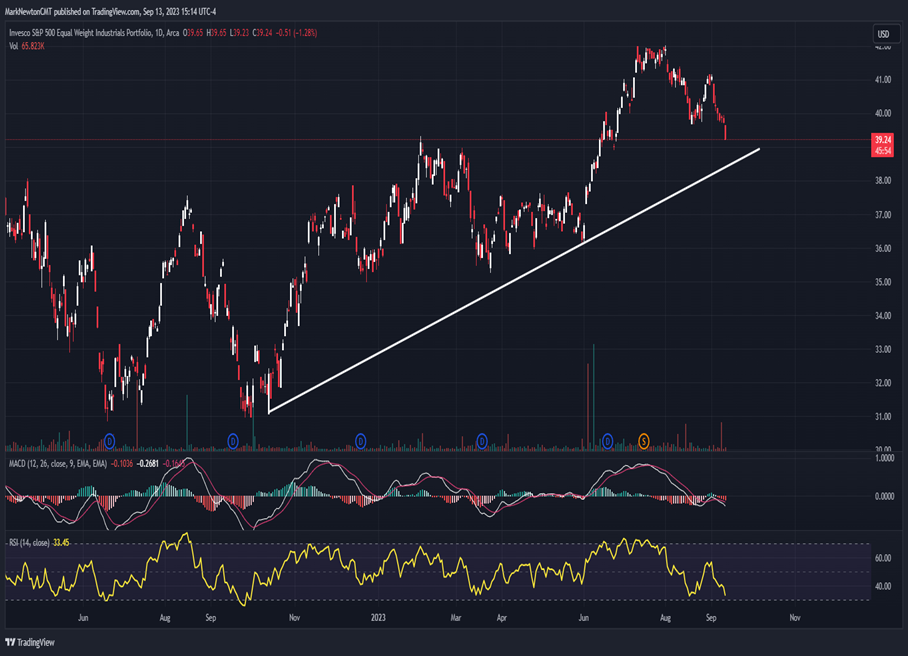
Daily charts of Invesco’s Equal-weighted Industrials ETF (RGI 0.85% ) have just undercut August lows, and closed near the lows of the session. Note, this is short-term weakness only, while larger uptrends for this sector remain intact.
Airlines looked to be the culprit for Wednesday’s underperformance, and while this group is nearing support, this group is not quite there. 3 of the top 10 largest losses from XLI 0.72% in the past month were in Airlines: LUV 6.49% , ALK 4.26% and AAL 6.64% .
However, other notable underperformers include: RTX -0.39% , ROL -0.16% , UPS 0.23% , BA -0.89% , and JBHT -0.62% which have all lost more than 10% over the past month.
Of those mentioned above, I believe BA -0.89% and JBHT -0.62% look most attractive to consider on weakness into late September. Furthermore, the Airlines very well might stabilize upon nearing prior lows in names like ALK 4.26% , LUV 6.49% . At present, this looks a bit premature.
Overall, I suspect this weakness proves temporary and makes Industrials attractive from a risk/reward standpoint. However, in the short run (meaning the next 1-2 weeks) additional weakness looks likely to test this area of intermediate-term trendline support.
Some of my favorite Industrials stocks to consider on weakness include ODFL 0.33% , TDG -1.54% , PWR 4.57% , IR 3.06% , EMR -3.28% , TT 1.35% , ETN 3.99% , CTAS 0.72% , FAST 1.05% , and BA -0.89% .
Healthcare looks to be at trendline support, but will need to prove itself in the weeks ahead.
One of this year’s big disappointments involves Healthcare, and of the four potential Outperforming sectors I listed in January for 2023 during my Outlook presentation, (Technology, Industrials, Energy, and Healthcare) this one has proven to be a clear laggard.
Healthcare, as seen by the Sector SPDR ETF XLV 0.39% , has largely performed in-line with Equal-weighted Healthcare (RSPH -0.53% ) on a Year-To-Date basis (-2.25% YTD, vs -1.93% YTD for RSPH)
However, Equal-weighted Healthcare has lagged sharply when eyeing the 1, and 3-month returns. (1-month- RSPH -4.72% while XLV -2.12%)
3-month returns show -2.15% for RSPH while XLV is positive by +1.46%.
Thus, it’s been the last few months where Large-caps have shown more domination in this space, while some of the Medical Device names have deteriorated as interest rates have pressed higher.
Pharmaceutical stocks look like a relative bright spot for Healthcare during this challenging seasonal time for US Equities. Yet, Biotechnology, and Healthcare Services stocks look to require a lot more selectivity.
Hospital names in particular have begun to show above-average weakness on an absolute basis, and likely require a bit more consolidation before bottoming.
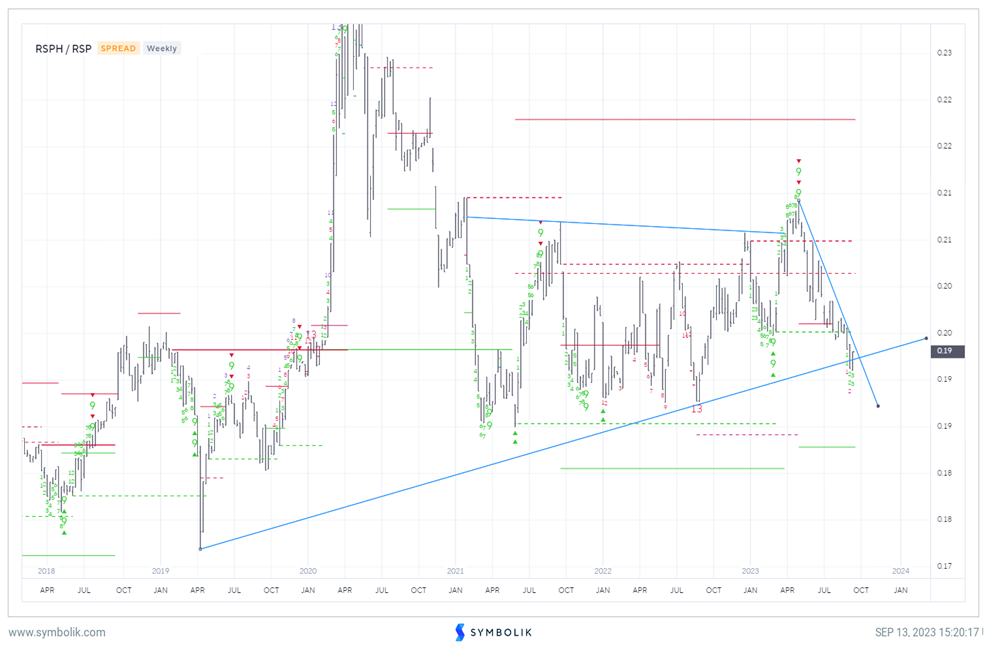
Overall, it’s important to point out technically that relative charts of equal-weighted Healthcare (RSPH -0.53% ) vs. Equal-weighted S&P 500 (RSP 0.77% ) have weakened to an important area of trendline support which extends back since 2019.
I feel that Healthcare likely should bounce, technically speaking, in the weeks to come. However, it will be necessary to break the ongoing four-month relative downtrend to have confidence, even on a near-term basis, that Healthcare can begin to show better performance.
Some of my favorite Healthcare names to consider technically speaking include: BSX -0.56% , UNH -1.02% , REGN 2.83% , VRTX 0.07% , and MRK 0.82% .