
Uptrend looks to be nearing an area of possible resistance this week. Expect rally up to SPX 4545-75 could mark resistance and allow for minor pullback to get underway. (Wide range given difference in SPX cash to SPX Futures.)
Yet again, Equities charged back from early weakness to turn in positive performance. Technology and Financials led performance, which is thought to be helpful given that both sectors have underperformed on an Equal-weighted basis over the last month.
Small-caps showed impressive 1% gains, but Russell 2k ETF (IWM 1.60% ) likely encounters temporary resistance this week near 200, which looks technically important.
US Dollar and Treasury yield decline both look to be nearing short-term support. Given that Equities strengthened sharply on their decline, it’s important to watch what happens if a bounce gets underway this week.
Utilities continue to lag performance, and the underperformance in the Defensive sectors remains a key reason why Equity market declines likely prove short-lived and minor in scope.
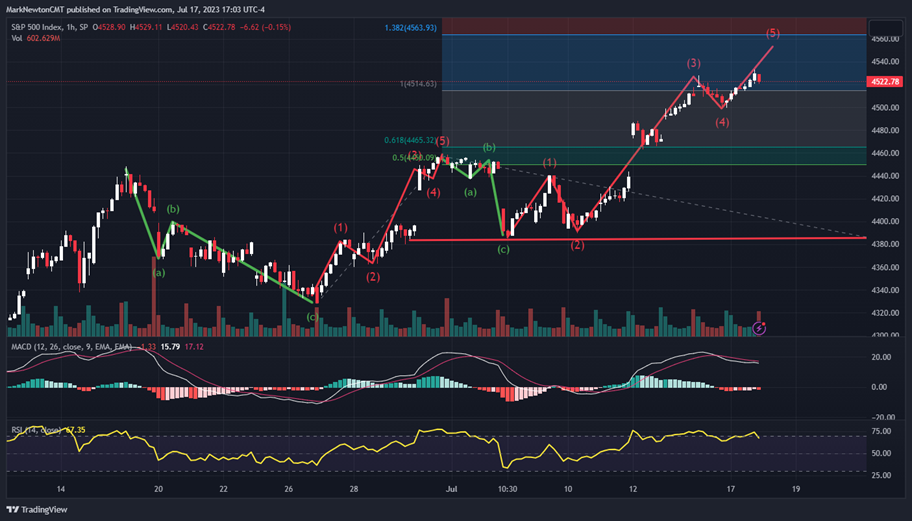
Hourly SPX charts below, along with my Elliott-wave interpretation, show why it’s possible that Equities might be headed towards a tough level directly above after a stellar rally over the last seven of nine weeks.
The gap last Wednesday on 7/12/23 was important in terms of how this current wave is labeled, not unlike what happened back on 6/30/23. In this case, this resembles a wave 3 of 5 of the pattern from early July.
Thus, this latest push higher from last Friday’s lows (7/14/23) likely represents the final push up of the rally from early July. As of Monday’s close, it doesn’t quite seem complete, but might require a move up into the 4545-75 range before hitting resistance and turning back lower.
Importantly, I don’t expect this represents anything more than a temporary consolidation after the recent rally in US Equities. Only if early July lows at 4385 are broken would it be correct to consider the possibility of a larger correction.
Any setback very well could prove temporary in filling the gap from 7/12/23 intra-day peaks near 4344 before pushing back to new monthly highs.
While the risk/reward doesn’t appear as favorable to short-term traders this week, the larger pattern and technical condition remain constructive. However, I’ll list below some of the key warning signs I typically look at which could result in corrective behavior in the list below.
Warning Signs to keep an eye on which might lead to short-term pullback in US Equities:
- DeMark exhaustion: this is now close to materializing on multiple timeframes for US Equity ETF’s and indices ( I’ll show some charts in Tuesday’s report to explain these developments).
- Negative momentum divergence: this is present currently on daily charts given the consolidation in recent weeks, which followed the turn back higher last Friday. However, there is no negative divergence on weekly charts such as what occurred last August 2022 or November-December 2021 ahead of the bear market selloff (Loosely translated as price pushing back to highs which is not followed by momentum).
- Weakness in Key sectors like Technology or Financials: if Technology starts to weaken materially and break relative uptrend lines vs SPX, that would be a problem. While Tech thus far has underperformed over the last month, it’s been insufficient to think Technology is peaking. Furthermore, Semiconductors have been acting fine and are a relative source of strength within this sector.
- Bullish sentiment reaching exuberant/complacent levels: Bullish sentiment has certainly lifted a bit over the last month, per AAII, Investors Intelligence, Fear and Greed polls. CFTC data also shows the start of short-covering by non-commercial Speculators/hedge funds. Yet, the level of bears doesn’t appear low enough in AAII readings, and most investors I’ve personally spoken with remain unconvinced that the worst is over.
- Defensive strength: while the REITS have stabilized and shown some strength over the last couple weeks, this hasn’t been followed by either the Utilities or Consumer Staples.
- Cycles show possible peak: two different cycles look to peak on SPX by end of July, and one is possible by 7/21/23, or this Friday. This is short-term in nature only and the intermediate-term cycle bottomed in mid-May as planned and trends higher in the back half of 2023.
- Seasonal concerns: August has historically been a difficult month along with September in pre-election years after a number of bullish months this year which largely have materialized according to plan. Thus, the period of bullish seasonality might run out within the next few weeks.
- Breadth weakness: negative breadth along with fewer stocks pushing to new highs typically always precedes a pullback, and will be something to watch for. At present there hasn’t been meaningful breadth divergence.
- Intermarket divergences: markets have shown some welcome signs of Value line, Russell 2000 and DJIA all making progress in strengthening in recent weeks. However, these indices are weaker than QQQ 1.14% and SPX and it’s important to see DJIA and IWM 1.60% breakout to new monthly highs to have even more conviction about the path for the months ahead.
- Trendline breaks: most importantly, if SPX, NASDAQ, Russell 2k, and DJIA all begin to rollover and break ongoing uptrends, this would be a fairly convincing sign of an impending market decline.
Overall, the weight of the evidence suggests that a few of these warnings are starting to resurface. DeMark indicators are nearly complete on daily charts and have shown evidence of exhaustion now on weekly charts. Negative divergence in momentum is now present on daily charts. Yet the sector rotation remains quite bullish and it’s no longer one sector carrying the load, which was the case back in April-early May. Trends are intact, and sentiment does not yet show low levels of “Market bears” despite a few signs of optimism.
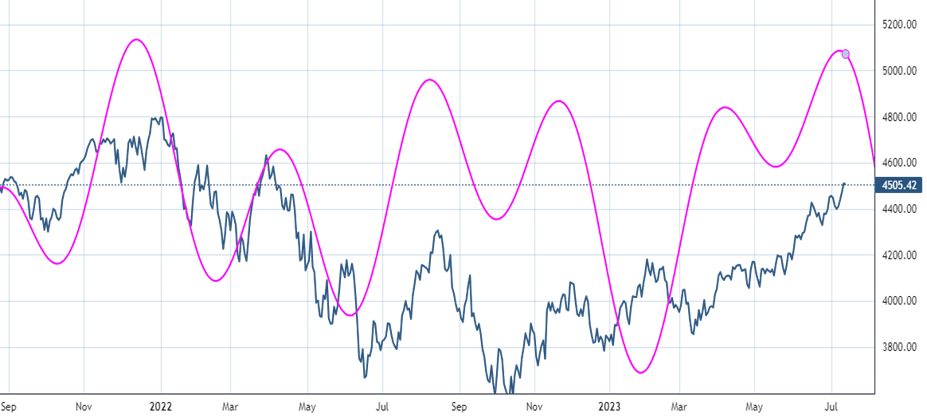
SPX short-term cycle could peak on/near 7/21
My short-term cycle composite which has proven fairly accurate in recent years shows a heightened chance of a possible peak in late July.
Note, this could start later this week, ideally on 7/21, or on the following Friday 7/28. However, it should be noted, that once this is confirmed, it likely would prove minor and present buying opportunities likely into August expiration at the latest.
I’m skeptical that a larger decline is upon us technically, and until proven, it’s right just to keep a close eye on ongoing uptrends, and revisit the list of 10 warnings from above.
This composite specifically involves the 80 day trading day cycle for SPX, along with a couple others that show good harmonicity to this 80 day cycle. It looks to peak within 1-2 weeks, and likely bottoms into mid-August.
It’s important to mention that this is a shorter-term cycle composite only that focuses on short-term swings. My weekly cycle composite is bullish throughout the back half of 2023 after having bottomed in mid-May.
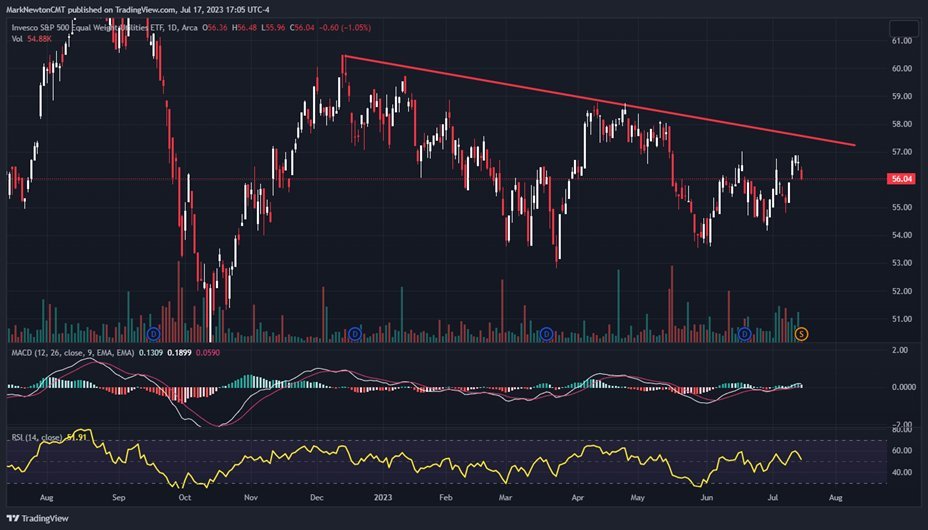
Utilities continue to be under pressure
It remains difficult to get too nervous about a correction when defensive sectors like Utilities and Consumer Staples remain under pressure.
These two defensive groups were the worst performing sectors over the last month along with the last three months. (Of the major 11 sectors when viewing in Equal-weighted terms.)
Monday’s trading showed a more than 1% decline in Utilities, while Technology and Financials both outperformed. This is typical risk-on behavior and until there’s some meaningful reversal in this sector performance accompanied by some negative breadth readings and momentum divergences, it’s still difficult to consider that any market selloff will prove too serious.
Key levels for the Equal-weighted Utilities ETF by Invesco (RYU 0.27% ) are $57.50 as resistance and $54 as support. Any break of either side of this range would likely lead to meaningful followthrough.
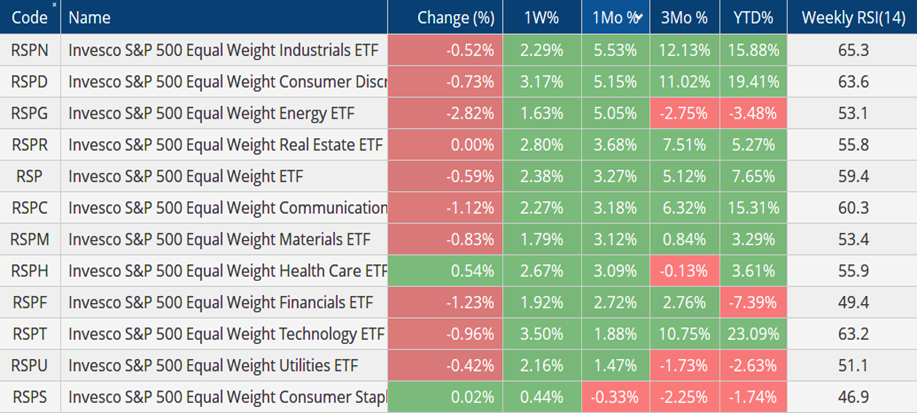
Performance stats show an encouraging broadening out over the last month, while Defensives continue to lag
Sector rotation continues to show a broad-based recovery underway with Industrials, Consumer Discretionary and Energy leading over the past month.
Sectors like Technology and Financials both underperformed over the last month and are important sectors which will need to hold up to expect this recent strength can continue.
As seen below, the defensive strength remains lacking, which is bullish, with meaningful underperformance out of Utilities and Staples over the last 1 and 3-month periods.