Markets are growing closer to tradable lows in this orderly and concentrated decline. I continue to view this selloff as a cyclical correction within an ongoing secular bull market that should resume its upward ascent after bottoming in March. At present, trends are down, and it will take time to be able to form attractive setups and achieve some base-building following this recent damage. Tuesday’s breach of January lows by Equal-weighted S&P 500 and DJIA will likely postpone an immediate bottom until early next week. However, it’s expected that lows to this selloff could be achieved within the next two weeks from a timing perspective, and prices are nearing possible support. If this breakdown in the Equal-weighted SPX helps the “fear factor” rise further with a capitulatory reading in TRIN (Arms index) or a 1.0 or higher reading in Equity Put/call ratio, this should be helpful towards being able to buy dips with more conviction in this downtrend. At present, it will be helpful to watch for evidence of downtrend lines being broken, which might give some optimism from a structural perspective of a bottom that is currently lacking. Overall, we’re growing closer.
SPX has neared the key 5500 area as it took out Tuesday’s lows in trading on Thursday. (As discussed in prior reports, SPX-5500 has importance due to the confluence of the Fibonacci-based 61.8% level of the rally from last August into February 2025, the 23.6% Fibonacci level of the entire intermediate-term uptrend from 2022 lows into this past February, and an alternate projection wave based on it being double the length of the first move down from December peaks into early January.)
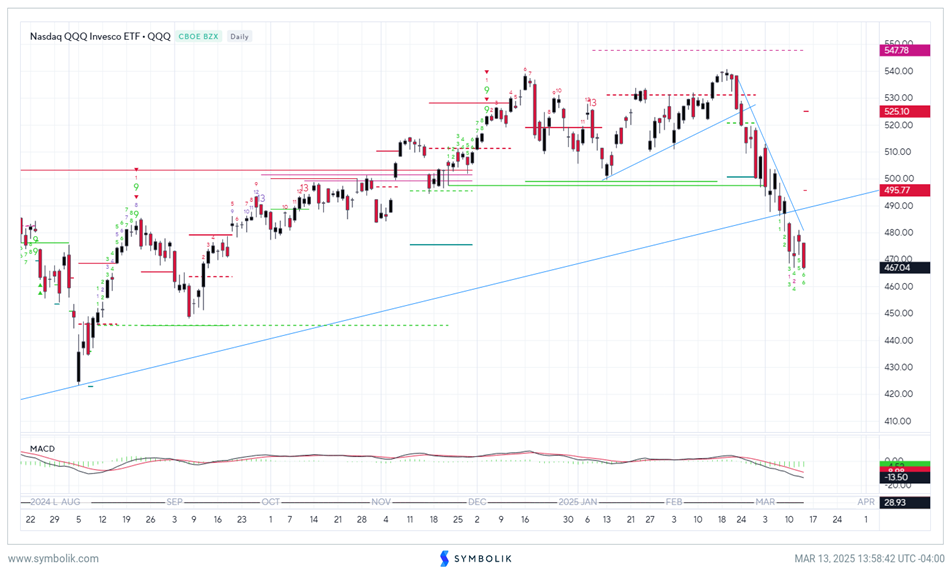
As shown below, QQQ looks to be three trading days away from when it could register the first TD Buy Setup (DeMark exhaustion signal) based on its daily chart. QQQ has also gotten closer to the 38.2% Fibonacci level of support from October 2023 lows which hits near 465.
It’s important to note that cycles for US Equities should bottom in mid-March, and that Elliott structure is now entering a window for a possible low given that this past Tuesday’s lows have been breached.
Furthermore, implied volatility is not pushing up as aggressively as was seen early this week, and VIX is still well below the prior peak of 29.57, which was registered on an intra-day basis on Tuesday. (As many traders are aware, VIX can often peak out prior to the SPX bottoming when a market low is close, similar to VIX bottoming and pushing off the lows often before a market peak.)
Overall, while the trends remain quite bearish and momentum has officially gotten oversold, I think one can make the case for a tradable low into next week. As always, evidence of price turning back higher to break this recent downtrend and carving five waves higher off any upcoming low with good participation would help to add conviction to the idea of this being a strong low, which should not require a retest.
Nasdaq QQQ Invesco ETF – QQQ
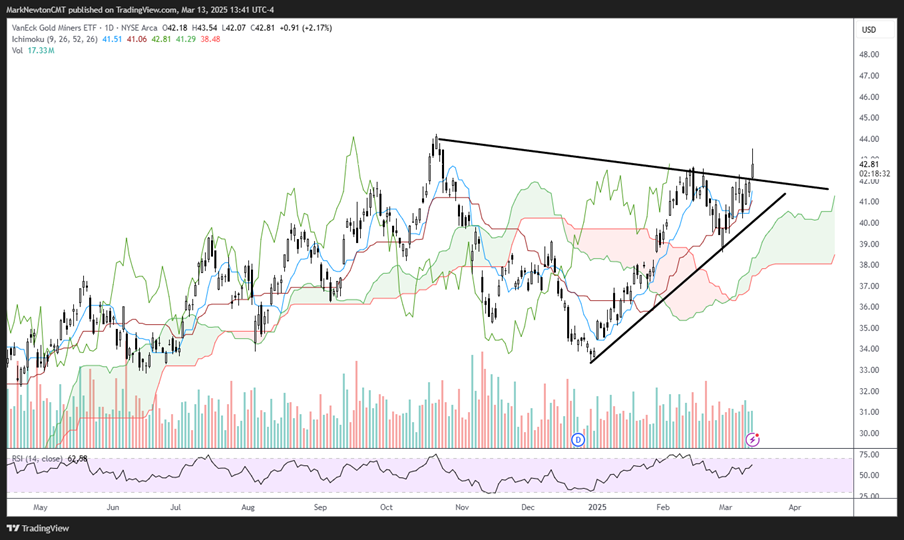
Technically, Gold and Silver Mining stocks have begun to push higher to follow the bullish action in the Metals
As shown below, GDX 0.93% , the VanEck Gold Miners ETF, has pushed up to new highs of the year, exceeding the highs of its triangle resistance in the process.
This is a bullish development coinciding with Gold having pushed back to new all-time highs today. I anticipate that GDX might push up to the high $40’s as Gold makes its way higher to eventual targets near $3280.
VanEck Gold Miners ETF
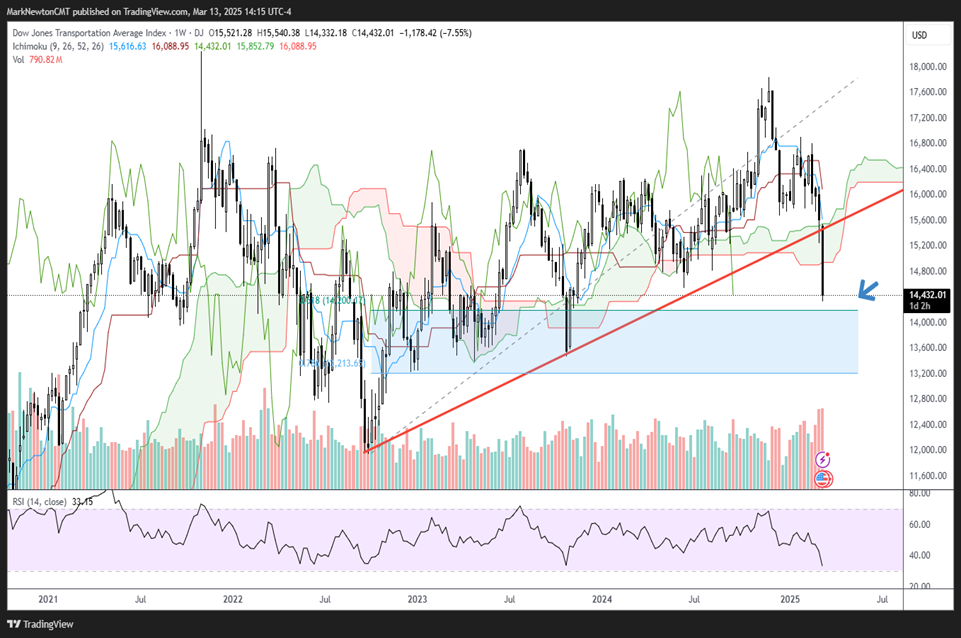
Transport stocks have been hit abnormally hard
A big part of the deceleration in price pressures seen in Wednesday’s CPI report came from Transportation, specifically from Airline fares, which might signal weaker consumer demand.
The DJ Transportation Average which has shown inordinate weakness out of the Airline stocks (AAL 0.42% , UAL -0.61% , DAL -1.32% , ALK 1.31% have all fallen more than 19% Year-to-date) recently broke the trendline extending back from 2022 lows.
At $14,397, the DJ Transportation Average (DJT) has nearly retraced 61.8% of the entire rally since 2022.
While some stabilization is necessary sooner than later, the good news is that the decline has unfolded as three-waves only at this point.
Thus, a rally that manages to recoup $15,677 would suggest a move back to new highs is underway. Overall, this resistance at $15677 is the most important area on rallies for the DJT in the months ahead.
Overall, while the near-term and intermediate-term picture have been trending down on above-average momentum, I suspect that the daily oversold conditions (RSI now down as low as October 2023) should present some opportunities in the near future as stabilization and a rally get underway.
Dow Jones Transportation Average Index
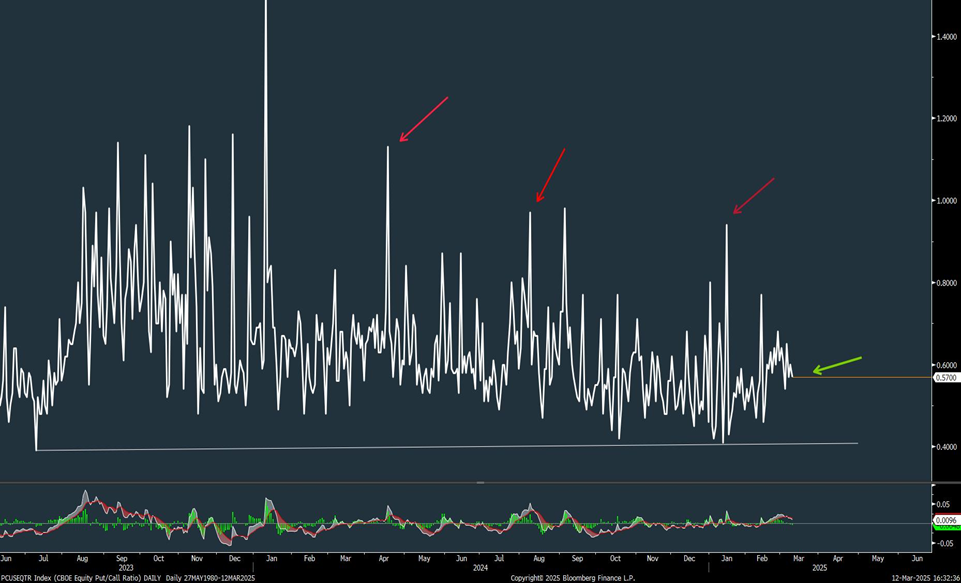
Equity Put/call ratio has not yet reached extremes
One of the indicators I often use in my arsenal to determine market bottoms is to watch when the Equity Put/call ratio gets up to near 1.0 or higher. (The past year’s major market lows all coincided with 0.95 or higher.)
Readings of 1.0 would imply that an equal number of put options on Equities are being bought compared to call options. This is a rare occurrence and normally coincides with a time of fear in Equity markets.
As has been discussed, there really hasn’t been a sufficient signs of true capitulation to this recent decline, despite VIX term structure having grown inverted this past week.
As one can see below, the prior market bottoms of the past year have all shown Equity Put/Call readings above 0.90 as the stock market lows transpired.
The red arrows below highlight three of the last four occasions where Put/call ratio has traded over 0.95. These are:
1/16/25 – 1.16.
8/8/24 – 0.97.
4/17/24 – 1.13.
Wednesday’s close 3/12/25 registered 0.62, showing not nearly the kind of put buying that has occurred at lows which have happened over the past year.
I suspect that a spike above 0.95 in the next week for the CBOE Equity Put/call ratio (PCUSEQTR- Bloomberg) should be important in helping to confirm from a sentiment perspective that some signs of capitulation which could produce a market low are at hand.
CBOE Equity Put/Call Ratio