


SPX’s technical trend and momentum remain bearish but are nearing areas in price and time this week, which might produce a short-term low, allowing for the start of a sharp bounce into February. Given the orderly selling that has occurred this month vs. the abrupt, unexpected decline in mid-December, it might be unlikely that capitulation measures happen right away before Equities bottom. Given the return to Stock/bond positive correlation, some evidence of yields peaking will likely be important to trust any bounce in the Equity market. Stocks like AAPL and NVDA look to have arrived near important levels, and given the worsening in sentiment in recent weeks, a reversal to this recent downdraft looks quite likely this week at a time when many investors least expect it. However, the extent of the breadth deterioration has proven severe in recent weeks and a bounce in Equal-weighted SPX might be necessary before having too much confidence that a sustainable low is firmly in place.
Yesterday, I discussed 10 key reasons why SPX was getting ready to rally, and I believe this will likely come to fruition over the next week. However, if Tuesday’s roller-coaster ride shed any light, traders remain unwilling to make big bets ahead of what’s widely perceived to be a very important CPI report on Wednesday. Furthermore, I do not have a lot of conviction just yet that lows are in place. Ideally, CPI would not produce as moderate/soft of a report as Tuesday’s PPI did, resulting in SPX pulling back to 5690-5725 before lows are in place
Overall, a few things remain unresolved and still could allow for SPX to initially go lower post-CPI before any material bottom is in. These are as follows:
- DeMark exhaustion does not indicate any peak yet in Treasury yields, nor short-term bottom in Equities, despite this being close to occurring. Given the strong, positive correlation between Treasuries and Equities lately, this might initially lead yields back up a bit higher, which in turn, might lead Equities lower. (However, I do not expect TNX to get over 5.02% on this rally.)
- Trends and momentum remain bearish for SPX and QQQ, and insufficient strength has yet occurred to be able to say with confidence that lows are at hand. In a similar but opposite position, Treasury yields have not rolled over, and this is thought to be an initial first step. In absence of trends changing, it’s hard to turn too bullish with momentum still being negative on many timeframes.
- Elliott-wave patterns for SPX, while nearly complete, do not yet appear to be finished and would benefit from a “final” pullback under 5773, which might allow for 5700 to be tested.
- No evidence of any capitulation yet in Equities, with no 2+ reading in TRIN (Arms index) nor any severe spike in Equity Put/call ratio or other Bearish sentiment polls to extremes (Note, this might not have to happen for Equities to bottom, and might be postponed if/when Technology and Financials can start to bounce back.
- Market breadth remains quite weak and will need to start to strengthen to have confidence that Equities might be bottoming. Historically, a strong lift in Technology has proven helpful for Equity indices. Yet, the broad-based movement higher certainly remains lacking with Technology not participating.
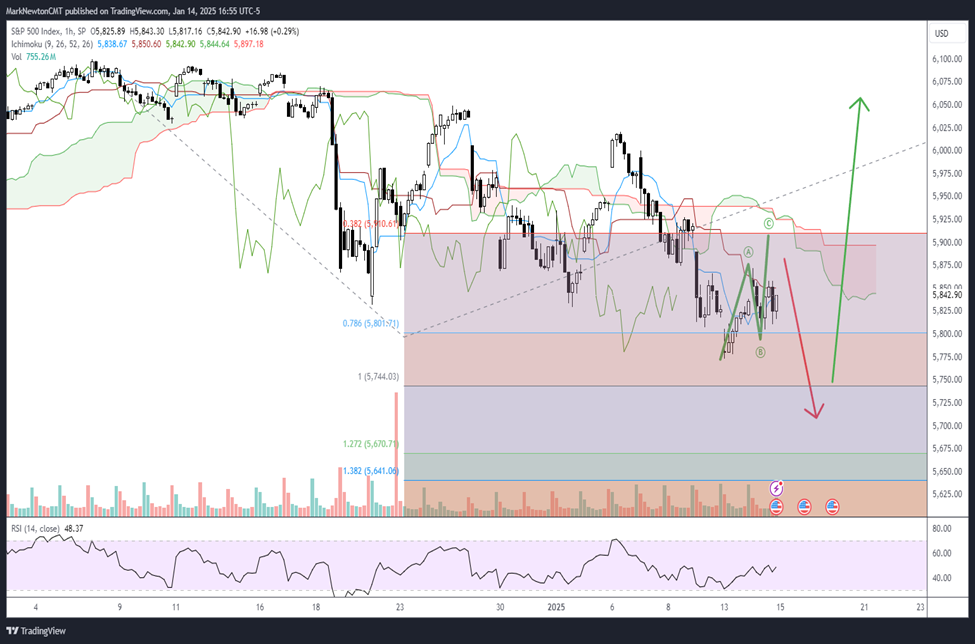
As shown below, the pattern remains choppy with some recent wild swings. Ideally, a poor CPI report could drive yields higher and Equities lower in what might represent the final move down for January.
Conversely, the other scenario might involve a better-than-expected report (in-line CPI or moderate reading that misses expectations (similar to PPI), which leads to a minor bounce only (SPX-5900 to 5920) but fails to drive Equities meaningfully higher in a high volume, high breadth fashion above 6021 before rolling over.
Bottom line, any break of 5805 is arguably an initial warning sign for short-term SPX technicals. However, it’s a break of 5773 that would be ideal to create a more appealing risk/reward situation for SPX near 5700 from Wednesday into Friday before reversing higher.
As I’ve written, I’m expecting an upcoming low and bounce into mid-February. However, there’s just not enough to say markets are there, and they would surely benefit based on a few measures if SPX were to show further near-term erosion to 5700.
S&P 500 Index
I’ll repeat the bullish list from yesterday, which are 10 technical catalysts coming together to make a strong case for a low to this recent selloff:
- SPX approaching last November’s lows and Fibonacci-based price support (SPX-5700).
- SPX approaching intermediate-term uptrend line support from October 2023 low (SPX-5700).
- Both NVDA and AAPL are now within 1-2 days of bottoming out, technically, as both near meaningful levels of support.
- Sentiment turning bearish; Fear has begun to creep back into markets.
- DeMark-based exhaustion could be in place for SPY into Wednesday’s CPI report (TD Buy Setups) (EDIT: This no longer looks to be the case on a daily chart but could show exhaustion on several intra-day timeframes.)
- Elliott-wave Structure also getting close to bottoming given the shape and pattern of this decline since mid-December, but ideally requires another leg lower.
- The Technology, Financials, Industrials, Discretionary and Communication Services sectors are all nearing intermediate-term trendline support on weekly charts.
- Market breadth gauges have reached abnormally low levels (SPX Percentage of stocks above their 50-day moving average(m.a.) = 16%, the lowest since October 2023) while Percentage of SPX issues above their 10-day m.a. which has begun to show positive divergence compared to Mid-Dec. 2024.
- Short-term Cycle composites (Based on emphasizing the 80-day cycle) show a bottoming in SPX potentially as early as this week, followed by a sharp bounce into mid-February.
- Treasury yield charts across the curve (2, 5, 10, and 30-year Yields) all look close to signaling exhaustion on this rally in yields, which could mark a peak in yields between 1/15-1/21 before pullbacks over the next 3-5 weeks. Given the positive correlation between Treasuries and Equities lately, any hint of yields starting to peak out could likely be a positive catalyst for an Equity rally.
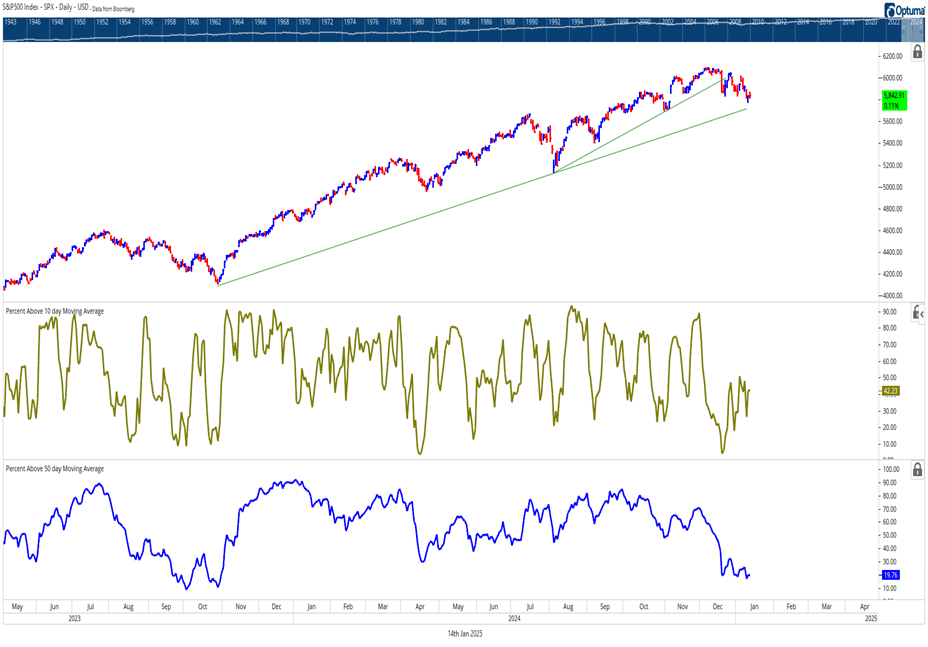
Breakdown in SPX market breadth has reached very low levels
While the extent of the Percentage of SPX names above their respective 50-day moving average (m.a.) has reached the lowest levels since 2023, the percentage of SPX stocks above their 10-day m.a. has begun to move higher and now lies near 42%.
This divergence is normally something that can happen near market lows with regard to short-term breadth, where price moves lower while breadth is marginally higher.
However, the percentage of stocks above their 50-day m.a. is certainly something that is important to stabilize and begin moving higher to have confidence in the broader market, making a more material bottom.
If this were to remain at muted levels on a market rally into February, it would represent a possible warning sign of another pullback starting in mid-February into early March.
S&P 500 Index
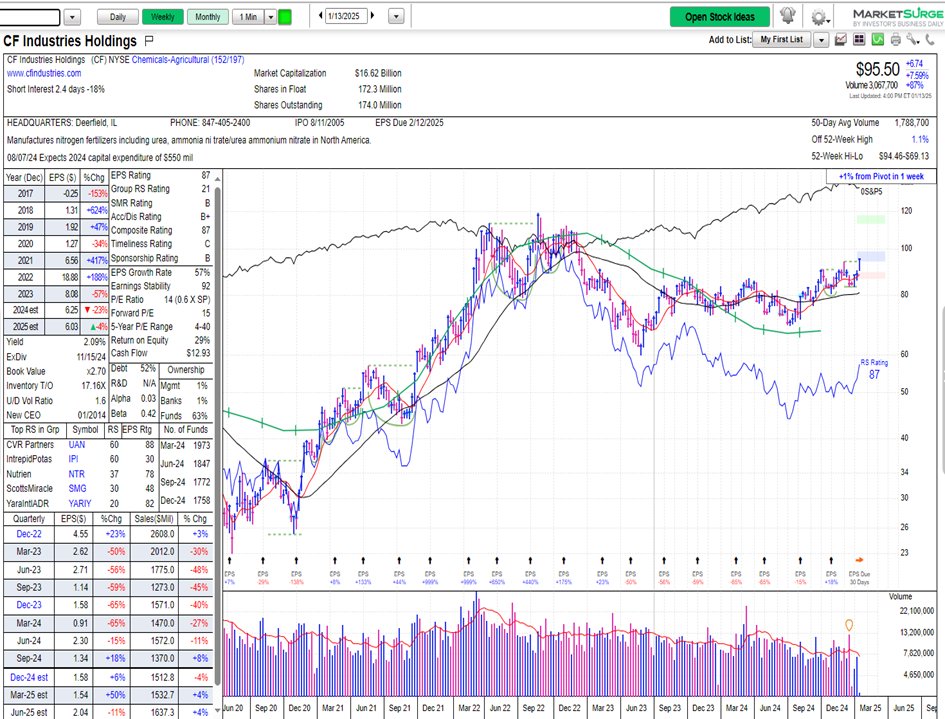
Agriculture-based stocks have been strengthening
As fears about inflation have risen in the last month, there’s been a noticeable lift in Grain prices (Corn +7%, Soybeans +5%) while the Agriculture (“Ag”) stocks have begun to show better relative strength.
While I do suspect that this might prove to be a tactical move only, stocks like CF Industries (CF -2.79% ) and Mosaic (MOS -1.84% ) have both made attractive near-term technical moves, which bode well for gains into February.
Overall, the charts of the Grains are in far worse shape than stocks like CF, and this one is preferred technically for those eyeing possible “Ag” stocks, which might be technically starting to strengthen.
CF Industries Holdings
Mean Reversion higher in Energy and, specifically, Healthcare could be helpful to SPX
Both of the US Equity markets’ best-performing sectors in the last few weeks have come out of former lagging sectors.
This means reversion often begins in November or December of any given year and lasts into February as the former lagging sectors benefit while the former leaders start to weaken. However, the longevity of any bounce is often difficult to trust when technical patterns have been under severe pressure.
Energy and Healthcare are the two examples for 2025, and both of these have the only positive performance of any of the 11 major Equal-weighted ETFs in one-month returns through 1/14/25.
While I’m skeptical that Energy can show much further strength given the President-elect’s discussions about Energy infrastructure coupled with China’s economic weakness, I do have more promising technical thoughts regarding Healthcare for potential 1st-Quarter-2nd Quarter outperformance.
As shown below, Healthcare in relative terms to the S&P 500 (Both in Equal-weighted terms) violated a 10-year uptrend back in mid-2023. (RSPH -0.61% vs. RSP -0.43% ).
RSPH/RSP
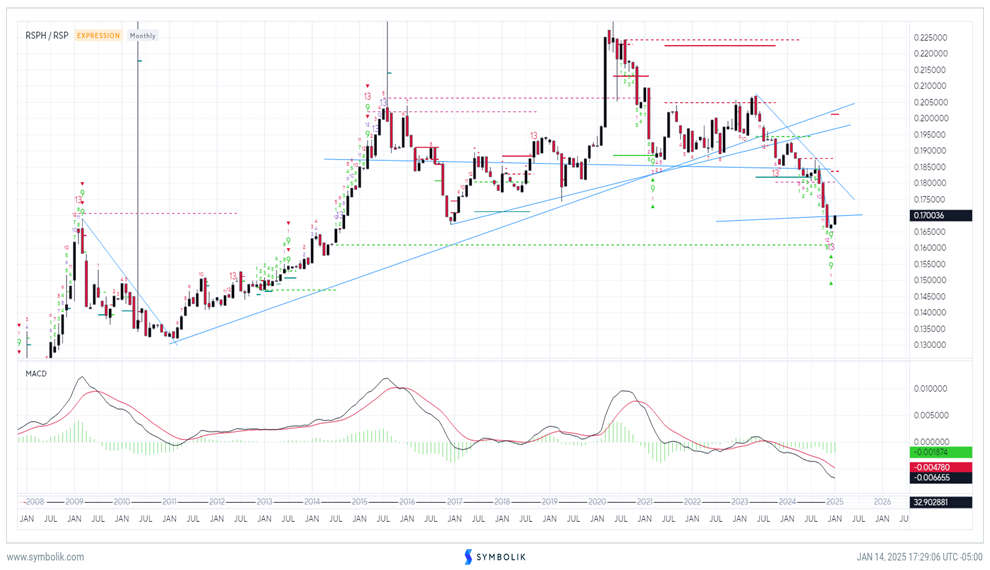
This resulted in a steep decline in Healthcare performance during the back half of 2024.
However, technically speaking, it’s likely that this recent underperformance has been “So bad, it’s good”, meaning that a possible bounce could be likely to start 2025 at a time when many least expect it.
Monthly relative charts show the formation of a TD Sequential 13 countdown signal on ratio charts of RSPH to RSP. While it should take another 1-2 months to confirm this signal potentially, any confirmation could likely lead to Healthcare snapping back and showing more robust outperformance.
Unfortunately, I sense that any rally likely proves short-lived, only given the huge breakdown in momentum and recent underperformance in this sector. (Historically, Healthcare tends to have some of its best performance in June and July most years, seasonally speaking.)
Thus, while the Biotech and Medical Devices sub-sectors might depend on rates rolling over to help some of the Smaller-cap names within these groups, I expect that Healthcare likely should be a sector which investors can temporarily favor between January and July. If/when RSPH confirms a monthly buy signal (13 Countdown using TD Sequential ) I’ll switch to a Neutral technical rating, as this likely could bring about a strong bounce into this Summer.
This also has importance as a tailwind for SPX given that Healthcare is the 2nd largest sector within the SPX behind Technology at 12.5%.
Overall, while most eyes remain steadily focused on Technology for many of the right reasons, one should also give Healthcare a close look, given that this sector is important in driving market breadth given its size. (The underperformance from last September into year-end adversely affected market breadth, and it’s thought that a strong push higher in Healthcare could be a definite tailwind for Equities.)


