

US Equity indices remain pointed higher and have begun to show a sharp mean reversion in many lagging sectors in the past week that gives credence to the idea of a broad-based rally getting underway. While SPX and QQQ are certainly a bit stretched on daily charts in the short run, Equal-weighted S&P 500 has just broken out to new highs of the year. Furthermore, the gains in Transportation stocks, Financials, Biotechnology, Regional Banks have helped the DJIA to join the SPX and QQQ at new all-time highs. Overall, it’s premature to expect much deterioration in US indices in the short run given this recent broad-based participation. While some consolidation might occur after July expiration, I don’t feel it should prove too long lasting, nor severe before pushing up into late August. SPX likely can reach 5800 without many issues, and it remains difficult to bet on any serious mean reversion in Technology without more proof.
As discussed late last week, the mean reversion higher in the broader market looks to be underway. This started initially with Consumer Discretionary and Financials strength but has begun to spread to Industrials, Materials and parts of Healthcare.
Small and mid-cap indices have participated and have been outperforming Large-caps in recent days. MDY 0.59% , the SPDR Mid-cap Series ETF, has just pushed back to new all-time highs today, while the Russell 2000 ETF by Ishares (IWM 0.59% ) remains shy of its initial target near 2021 peaks at $244.
This mean reversion looks healthy for the US Stock market as bond yield and the US Dollar have been falling, and Technology looks to be taking a much-needed breather.
Given Tech’s outperformance for multiple months while the broader market underperformed, some catch-up by the broader market is encouraging and is seen as healthy, technically speaking.
Breadth gauges like “Percentage of stocks above 200-day moving average” have risen back above 70% for Russell 2000 and we’re now seeing breadth gauges like “SPX stocks within 20% of their 12-month highs” eclipse 83%. Furthermore, Coppock curve along with McClellan’s Summation index have both begun to trend sharply higher.
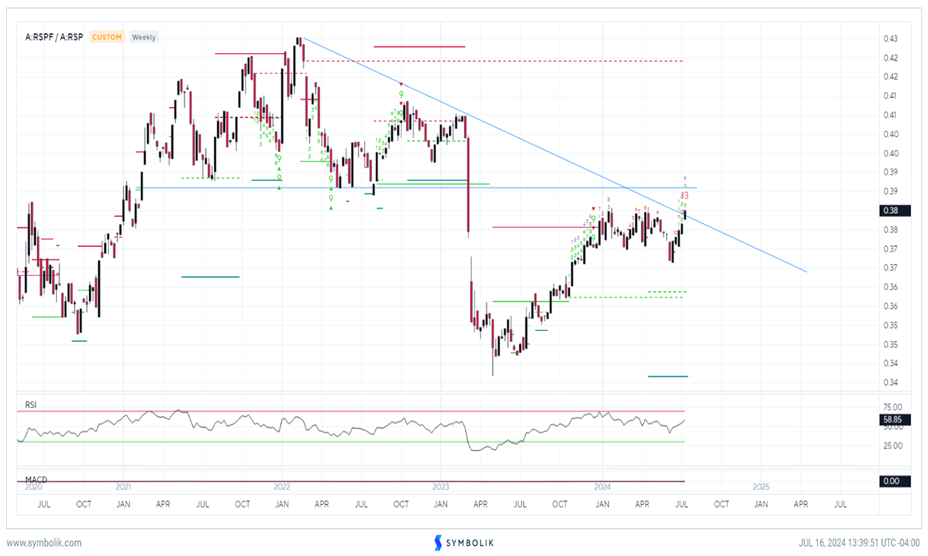
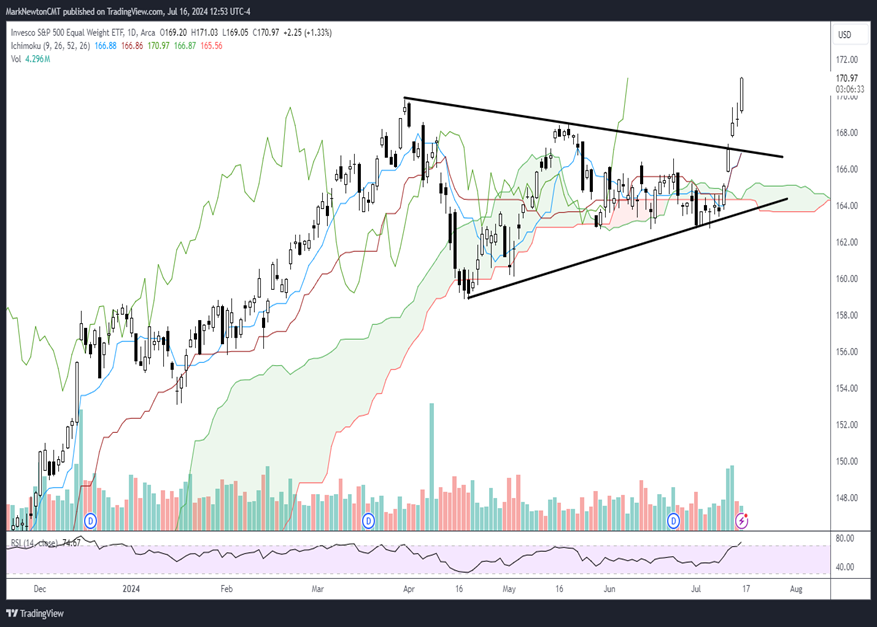
While the period following July expiration has been notoriously poor in Expiration years, this breakout back to new highs for 2024 in Equal-weighted S&P 500 index ETF (RSP 0.77% ) is certainly quite bullish technically.
Overall, it remains right to be bullish as the broader market begins its period of “catch-up”. If/when SPX begins to turn down to multi-day lows (potentially next week), then a minor period of consolidation should make SPX more attractive from a risk/reward perspective.
At present, SPX looks to be following the seasonal playbook for July in Election years and sentiment remains far too muted to expect any kind of a meaningful correction. See the RSP’s breakout back to new 2024 highs below.
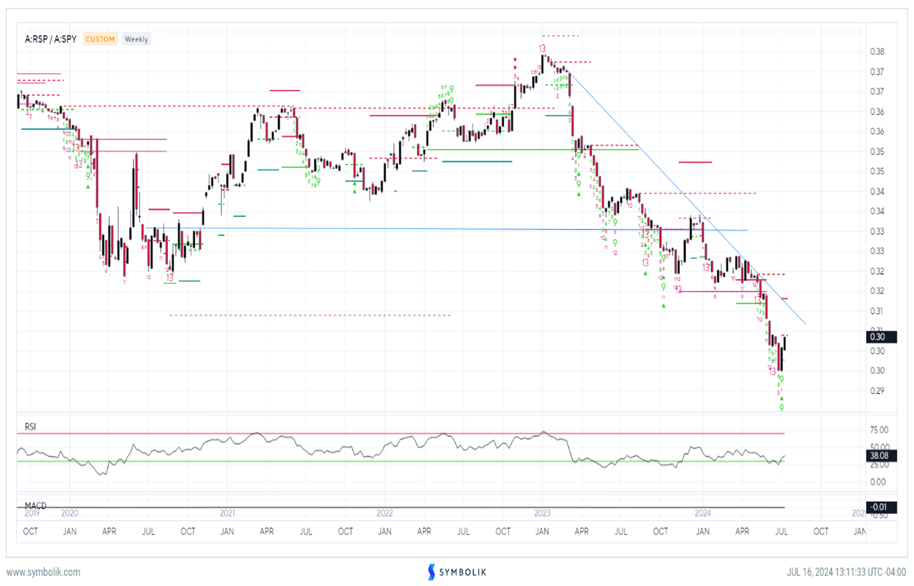
RSP vs SPY has begun to trend up, but rallies shouldn’t have too much longevity past August
This ratio chart of RSP vs SPY which I’ve shown in recent months has begun to climb in the near-term and this represents the second straight week where the Equal-weighted S&P 500 is outperforming SPX.
The question which many investors have is, does this bounce mean that the Technology rally has run its course, and RSP can outperform SPY throughout the balance of 2024?
I’m skeptical on both of these points above and feel that this bounce should prove short-lived only before a resumption in Technology strength.
Overall, until this downtrend in the ratio of RSP to SPY is exceeded, it’s still right to expect this bounce in Equal-weighted S&P 500 vs. SPY could prove short-lived only and potentially last 4-6 weeks before reverting back lower.
Monthly charts of RSP to SPY (not shown) remain quite premature to reflect any material evidence of monthly exhaustion after having declined to 15+ year lows.
Thus, while I do expect that Regional Banks, Biotech, Small caps can rally into August, I’m skeptical that this means its right to abandon the growth trade in favor of Value.
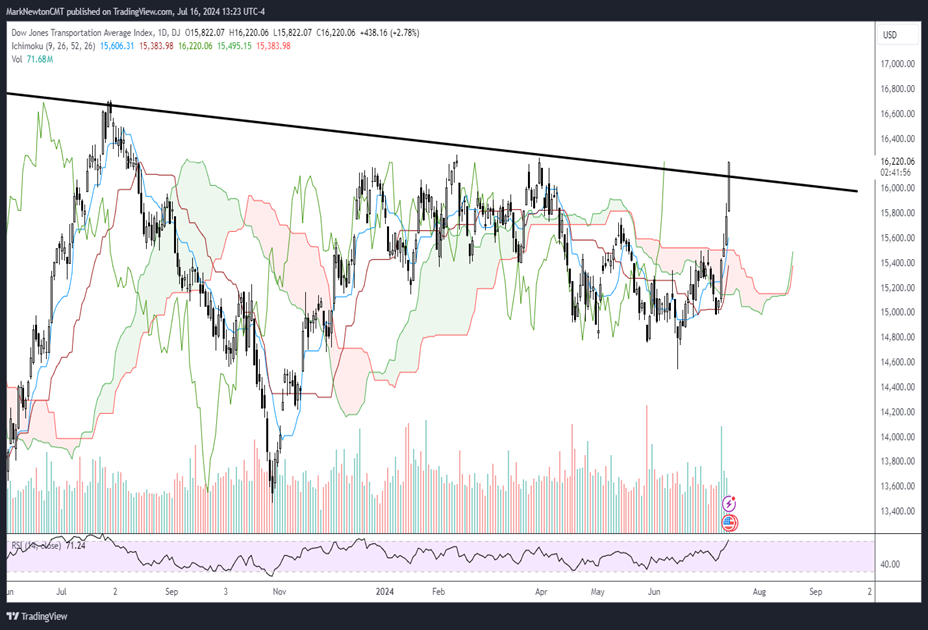
Dow Jones Transportation Avg. has begun to break out of meaningful resistance
The chart below of the DJ Transportation Average (TRAN) has now exceeded the consolidation resistance which has been intact for the last 12 months and extends back since 2021.
This former leading sector had been lagging substantially heading into this year while other leading sectors like Semiconductors had been outperforming most other sectors.
This seems to be changing in the short run. TRAN has pushed up above this area of trendline resistance and looks primed to continue to strengthen over the next month.
This snapback is healthy given the negative divergence which had been present on Transport stocks (along with DJIA) not having confirmed the move in SPX and QQQ back to new highs.
Transportation stock strength has directly helped Industrials begin to rally to multi-week relative highs to the SPX and is seen as quite constructive.
Financials have now broken out vs. S&P 500 on an Equal-weighted basis
The chart below is probably one of the more important charts to focus on outside of Small-caps and Mid-caps rallying back to join the Large-caps.
Financials had been a chronic underperformer most of the year, given the lagging behavior of Regional Banks.
As this weekly chart shows of the Equal-weighted Financials ETF (RYF) vs. the Equal-weighted S&P 500 ETF (RSP 0.77% ) this sector has just broken out of a two+ year downtrend in relative terms in the last week.
This is a much-needed jumpstart to a sector like Financials, which along with Healthcare represents around 12.5% of S&P 500.
Thus, despite some stalling out and minor weakness in Technology over the last week, sectors like Financials have shown solid outperformance and have helped provide a tailwind towards further Equity gains.
Stocks like STT 1.40% , BLK 0.78% , KEY 0.83% , FITB 1.19% , KKR 1.31% and HBAN 1.22% have all risen more than 10% in the last week and are the best performing stocks among the 72 members of XLF 0.77% since 7/9/24.
This breakout is a bullish development for Financials and hopefully can lead this group to recover more ground after a difficult period from 2022 into 2023.