
Markets have entered a window for potential short-term trend change, but Thursday’s decline failed to result in any downside follow-through following the BOJ decision. Near-term, an SPX-4500-4620 range still looks important, and upside looks limited before SPX starts to turn lower to test 4500. Ultimately, I expect an August decline down to 4350-4400 before SPX gets over 4650, making upside limited.
My short-term call might have “jumped the gun” a bit, but I do not expect that US Equities have much near-term upside, and should be on the verge of turning lower. In my experience, bearish engulfing patterns following a period of lackluster breadth following a run-up normally extend lower. However, Friday’s recovery certainly might have postponed this by a few days.
While near-term upside could happen briefly into next week, the reasons I felt that markets could weaken are still in place. However, the failure of price to have violated existing uptrends on SPX, NDX and DJIA remain a short-term hurdle for the bearish case.
Looking back over this past week, eight sectors out of 11 showed declines in absolute terms when eyeing the Equal-weighted Invesco ETF’s which cover the major S&P Sectors. Only four sectors were positive. Energy and Materials rose over 1.50%, while Technology and Consumer Discretionary were just fractionally positive on the week.
While many felt like the Technology comeback was constructive, the often-watched S&P Sector SPDR Technology ETF XLK 1.35% was actually lower over the past five trading days, owing largely to weakness in Solar Energy, and weakness in stocks like JNPR -0.26% , CDNS 1.24% , ANET 1.96% and MSFT 0.97% .
Overall, it’s right not to use Friday’s snapback rally to think that markets are growing stronger. Bottom line, I consider upside to prove limited into August and any decline back down under SPX 4528, or ES_F 4553 would signal that our pullback is underway.
Specifically, the following are problematic and normally signal a pullback is near:
- Breadth and momentum divergence on hourly and daily charts
- DeMark exhaustion on multiple timeframes and on multiple benchmark indices
- Exiting a bullish seasonal time and entering a bearish one (Both Aug and Sept )
- “Short-term” individual investor sentiment gauges have entered extreme bullish territory
- Cycles show weakness in August
- Defensive trading looks to be coming back with a vengeance just this week
- Resistance has been reached on NYSE Composite and Equal-weighted S&P 500
Bottom line, I do NOT anticipate a large correction, but feel such a decline likely approximate 5%, and might take another 1-2 weeks before this truly starts to get underway. (Thus, some choppy back and forth trading looks possible over the final week of July, but momentum and breadth could show further deterioration during this time ahead of a trend break.
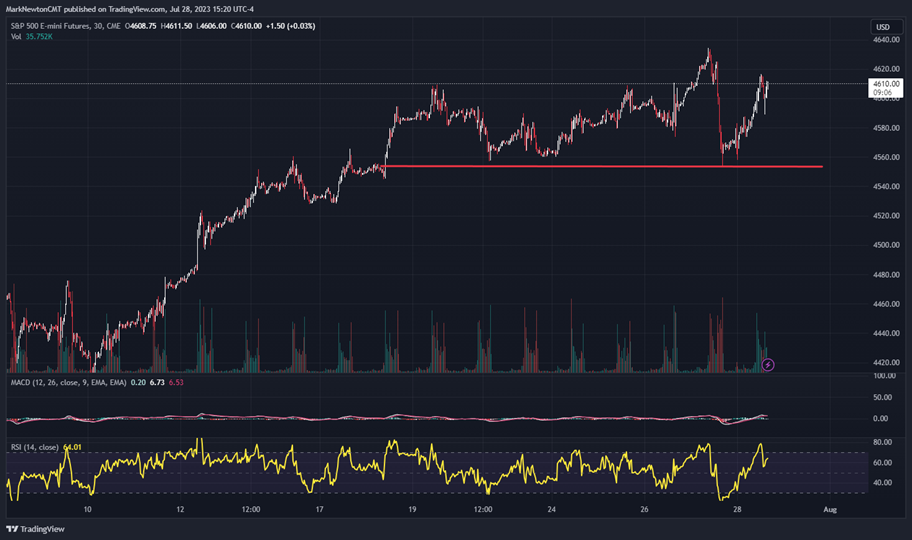
SPX largely has moved sideways over the last eight trading days, and while Thursday’s decline looks to have held an area that’s important, Friday’s snapback bounce could still find resistance near current levels. Investors should keep a close eye on 4553 in S&P Futures, and 4528 in SPX cash index.
Important levels for NDX, the NASDAQ 100 index lies at $15,374, which cannot be breached without giving way to more weakness in August. SPX’s hourly chart is shown below.
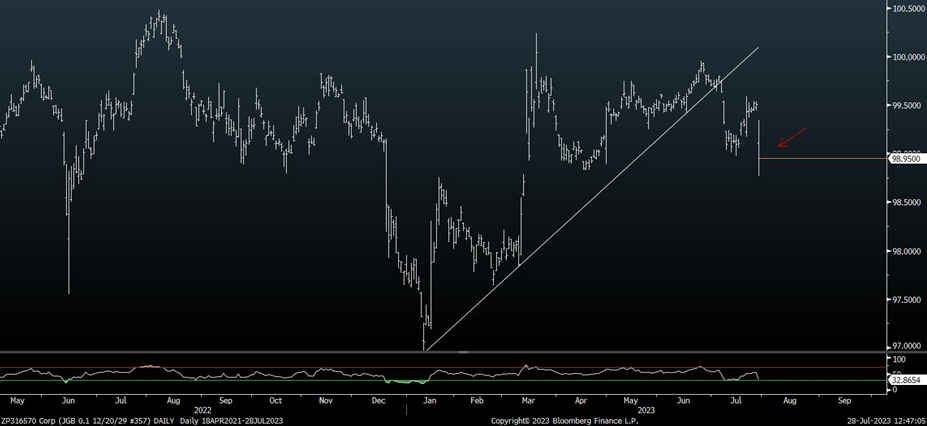
Bank of Japan (BOJ) policy change should result in Japanese Govt Bonds (JGB) and likely US Treasuries to decline in the very short run
Looking at Friday’s announcement, the BOJ decided to maintain the target for 10-year JGB yields at around 0%, as it had done previously. However, it appears that the central bank’s statement that the 0.5% ceiling on 10-year JGB yields is now a reference point rather than an inflexible limit caught the market off guard. (Bloomberg)
(The new stance allows the BOJ to manage the yield curve more flexibly, signaling the central bank’s willingness to tolerate slightly higher yields compared to its previous stance.)
Technically speaking, the decline in JGB broke technical support on its move under 99.
This likely also could eventually affect US Treasuries(UST) as rising yields might result in falling demand for UST.
The psychological 4.00% level seemed to act like a trigger for US stocks on ^TNX 1.14% on Thursday, and my expectations are that this level will be exceeded next week, even if it proves short-lived. Thus, any push back over 4% might result in S&P pulling back to breach support. While this correlation has not been all that evident in recent months, I suspect it could be important over the next two weeks.
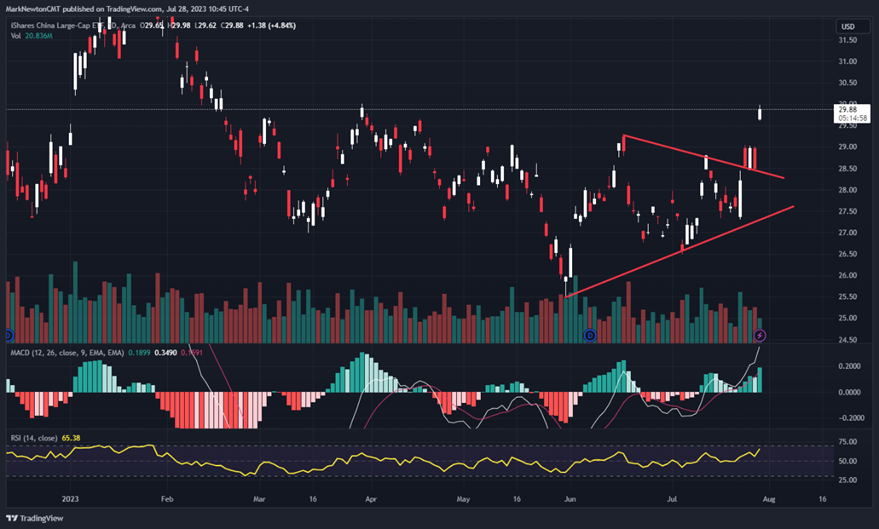
China surges on Friday, with a more definitive breakout out of KWEB and FXI.
It was thought that China could be positioned to rally, and Friday’s breakout in Kraneshares China Internet ETF (KWEB 1.34% ) looked important and bullish.
This directly followed an early week minor breakout in FXI, which seemed to stall a bit. However, technicals grew more positive with Friday’s breakout, which directly followed the policy change from BOJ.
Without dissecting what a move to more normalized policy in Japan might mean to China, I’ll simply concentrate on this technical breakout, and what the implications should be.
Near-term, I expect a move up to $33.75 in KWEB, with an eventual push up to $36. Moreover, I suspect that $36 should be exceeded in the months to come, and this will result in an even larger period of follow-through higher for Chinese Equities. ( I am a holder of KWEB and also CQQQ and NIO)
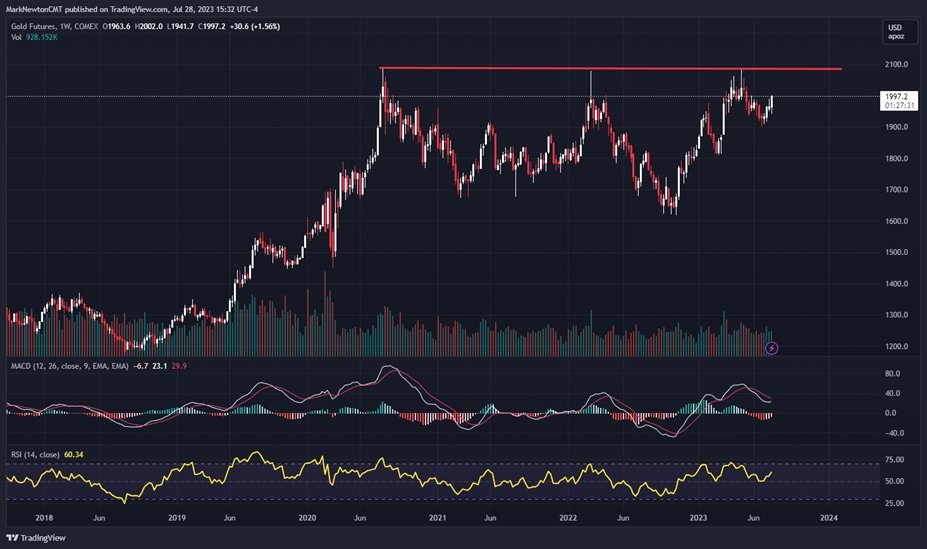
Gold’s push back to weekly highs likely signifies start of precious metals rally
Despite the above-average decline in precious metals following the rate spike on Thursday, Friday witnessed a complete recovery in Gold as the weak inflation data coincided with real rates softening.
This should serve as a bullish catalyst for the metals trade, and Gold’s rally to near 2000 is something I view quite positively.
This weekly chart below shows Gold’s consolidation base since mid-2020. It’s likely in my view that Gold and Silver should both push up to new 52-week highs, and in the case of Gold, All-time highs, and this rally might have been jumpstarted on Friday (7/28)
Overall, I discussed GDX -0.72% yesterday and my comments are similar in Gold and Silver, which appear better technically as a result of Friday’s gains.
The area at 2100 is most important for Gold, and this should represent the first meaningful area of upside resistance. I expect this to be tested and broken in August, which kicks off a bullish period of seasonality for Gold.
GLD -0.69% , IAU -0.71% , GDX -0.72% , SLV -1.72% , SILJ -0.83% are all vehicles which investors might consider to participate in rally in precious metals and the precious metals stocks.