

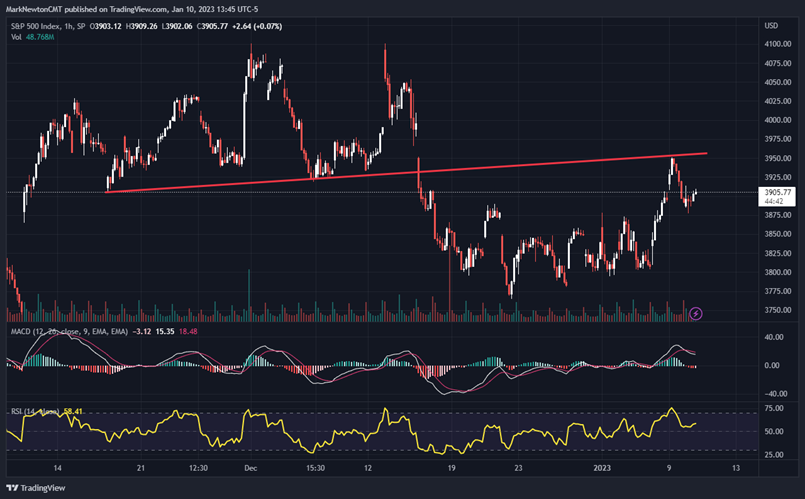
The near-term choppiness really hasn’t been resolved, and the lack of volatility makes perfect sense nearing what’s expected to be one of the more important economic reports this month (in the form of Thursday’s CPI report). However, despite the churning in broader benchmark indices, sectors like Consumer Discretionary, Industrials, and Communication Services continue to chug along, and it remains US Technology underperformance which has kept domestic indices within downtrends while many parts of the world have shown sharp rallies. Time-wise, this week does have particular significance, being 90 days from October 2022 lows and 180 days from last July’s bottom. It’s expected that both DXY and TNX should be in a bottoming process, and TNX showed some minor evidence of rallying Tuesday. The near-term risk/reward for longs seems poor this week headed into Thursday’s CPI and breaks of SPX-3877 would serve as an initial warning, while under 3800 should lead down under 3700 into late January.
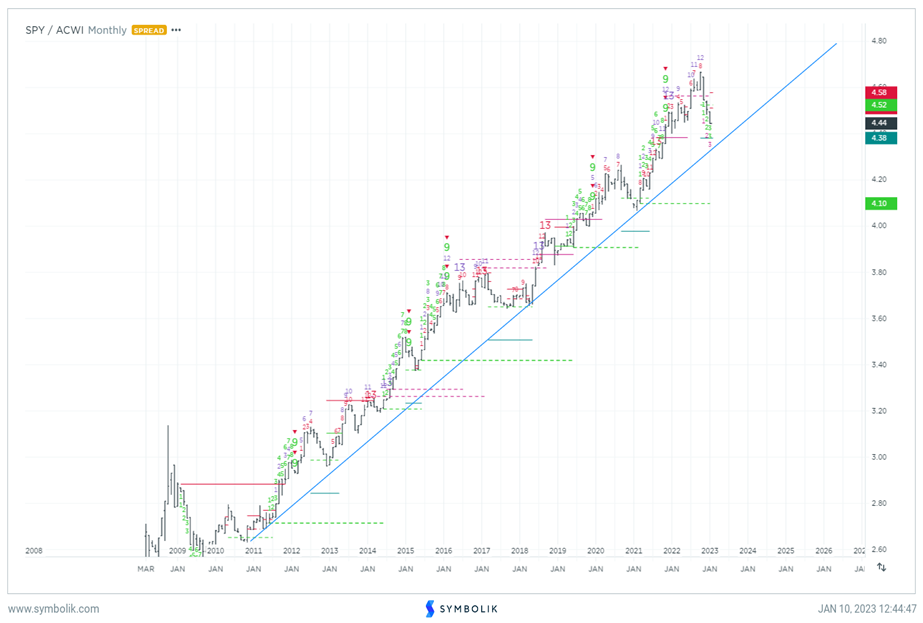
SPY pullback hasn’t made a dent in long-term uptrend vs. ACWI
Despite a three-month decline in relative performance of SPY to ACWI 0.71% (Ishares MSCI All Country World index ETF) the long-term uptrend from 2009 lows remains very much intact.
Some outsized underperformance in Technology is thought to be the culprit for why many US indices have lagged, and this ratio doesn’t’ look to have bottomed out just yet but getting closer.
Overall, counter-trend signs of exhaustion (explained later in this report) on both China’s FXI 0.53% and Eurozone’s FEZ 0.27% and EZU 0.35% ETFs (along with lack of buy signals on relative charts of these latter ETFs shown relative to SPY) should mean that Europe could be nearing a trading top.
Given that the US Dollar declined coinciding with this outperformance in many Emerging markets vs the US indices, it’s thought that this likely reverses course if/when the US Dollar starts to trend back higher.
While a move back to new highs in the US Dollar will take time (and might prove short-lived), it’s difficult to make the case as of now that the Dollar will not push back to exceed 2022 peaks.
Over the next week, both China and Eurozone equities look to face resistance and might result in US stocks starting to bottom out relatively speaking.
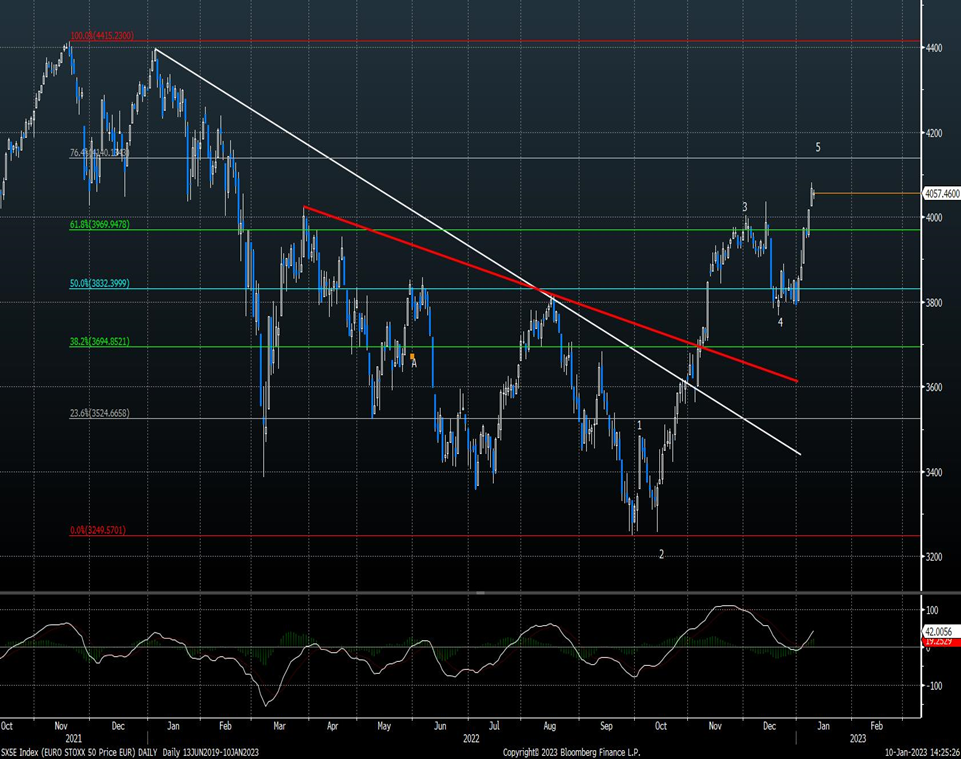
Europe slowly but surely rallying up to first meaningful target
Europe’s STOXX 50 index has retraced more than 70% of the decline from November 2021 peaks, much more than what’s been seen in US indices.
Chart of EuroSTOXX 50 index, shown below, looks to be carving out five waves higher from the late September 2022 low. This is important for two key reasons:
First, this move should be nearing conclusion over the next week before pulling back.
Second, a pullback into Spring likely would not undercut 2022 lows, given the progress off the lows, along with this being a five-wave advance off the lows.
Overall, upside targets for STOXX 50 should occur near 4140 initially and then 4230, both of which are important to watch over the next week for signs of stalling out and reversing course.
FEZ targets should materialize near $42.58, with a maximum move at $43.45-$44.65. EZU targets lie at $44.29, then $45.19.
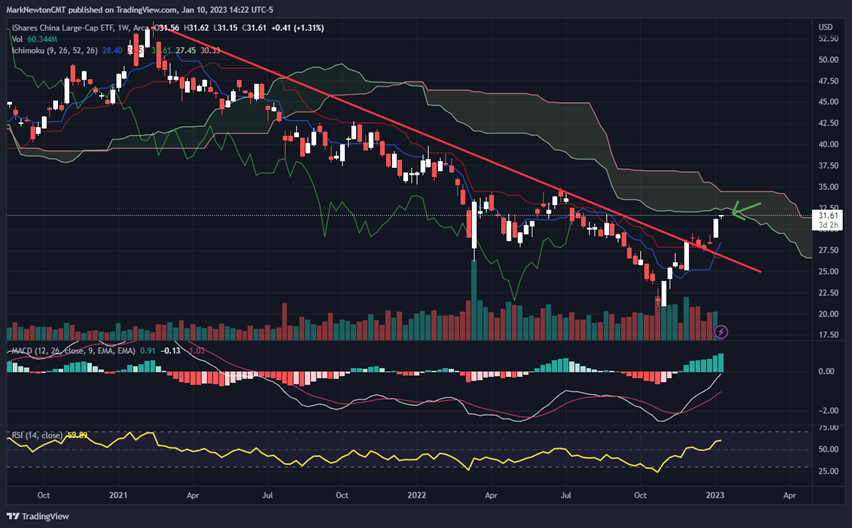
China’s FXI nearing resistance following its trend breakout
Technically, China’s Ishares Large-Cap ETF (FXI 0.53% ) has made a far stronger move off the lows than what technical trends and momentum had suggested might be possible last month.
Downtrends from 2021 were successfully broken, which is a big positive following the extent of this decline over the last couple years.
However, at $31.61, FXI is right below weekly Ichimoku Cloud resistance which lies just over $32 on weekly charts. Furthermore, this could signal two different counter-trend signs of exhaustion based on TD Sequential and TD Combo on an absolute basis by end of week. Finally, FXI is just approaching former March 2020 lows at $33.10 (former support now resistance).
Furthermore, this relative ratio never showed evidence of having produced exhaustion when viewing FXI vs SPY on monthly Symbolik charts near the Fall 2022 lows. However, on daily and weekly charts, this ratio could now show exhaustion on both daily and weekly charts by end of week. (This week is showing a TD Sell Setup on relative charts of FXI/SPY).
It’s also worth mentioning that China’s outperformance came about exactly as the US Dollar was declining. While this might be an intermediate-term trend, in the near-term, I’m expecting a fairly big bounce in DXY, likely starting sometime this week or next. Thus, Emerging markets (EM) likely will underperform on a Dollar bounce.
Thus, while many are rushing to buy into China on a perceived breakout and encouraging signs of a re-opening by China, I’m skeptical this will continue to work over the next few months. China’s FXI is nearing strong resistance, and I feel like $32-$33.50 should hold gains before a pullback. Overall, US Equities likely outperform China over the next few months.