


Click HERE to access last week’s Introduction to Factor Investing
Key Takeaways:
- Our Factor Investing Model will be based on 5 common factors (value, quality, low volatility, momentum and size). During 3Q 2021, momentum did well while the other factors were flat to down. Over the past year, the size premium (small-cap stocks over large-cap stocks) led the way.
- In this report we will be covering three factors: low volatility, momentum, and size. Low volatility includes stocks with price movement less then the market, momentum measures stocks that have appreciated the most over a period and size refers to market capitalization.
- We introduced value and quality in the first part of this three part series. The next and final piece will explain how we construct a portfolio using these factors.
- Static factor portfolios have struggled over the past 18 months, and have not contributed consistent positive return since about 2013.
- A simple factor timing overlay, however, has performed better, particularly during the recent downturns in the value and low-volatility factors.
This is the second part of a series of regular research notes commenting on the performance and general landscape for factor investors. Quant investors, who are generally aware of these issues can use this second series to get acquainted with how we measure low volatility, momentum and size. Fundamental investors can use this piece to better understand the risks inherent in their portfolios. In the first part of this series we introduced the value and quality factors. The three remaining factors will be covered in this piece. Our next piece will introduce how to construct a portfolio using these factors and then we will give periodic updates on these 5 factors and how they are changing.
Factor 3: Low Volatility Factor
The low volatility factor (measured as the spread between the S&P 500 Low Volatility index (SPLV 0.72% ) and the S&P 500 index (SPY 0.91% )) has also underperformed in recent periods. It too experienced a sharp drawdown and recovery during the tech bubble and subsequent crash (see Fig. 1), and generally has been trendless since the beginning of the 21st century.
Fig. 1 – Low-Volatility Factor Performance
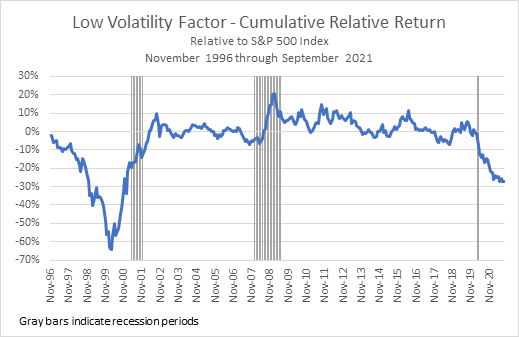
Starting with the onset of the pandemic last year, however, the low-volatility factor has lost nearly 30% relative to its benchmark, as the re-opening trade boosted the returns of more economically-sensitive, higher-volatility stocks. Like the value factor, this magnitude of loss for low-volatility had not been seen since the end of the tech bubble. Over the past year, the low volatility factor has lost 12.7% relative to the benchmark.
What it Means: We have recommended the S&P 500 High-Beta ETF (SPHB 1.11% ) before as a good proxy for the Epicenter and Reopening trade. High-beta stocks are those that move the most with the market and tend to be the most economically sensitive. The stocks that make up the low-volatility factor are at the opposite end of the volatility spectrum and tend to be more defensive in nature.
Utilities and Healthcare are generally considered less economically sensitive given the consistency of their cashflows, which usually remain pretty steady, rain or shine. Vices like tobacco can also fall into this category, although casinos joined the high-beta cadre as they became subject to unprecedented shutdowns.
We don’t want you to automatically assume that a stock in either the Utilities or Healthcare sector is low-volatility. Likewise consumer discretionary is a more economically sensitive sector, but not all of the stocks in the sector have higher volatility. A perfect example of a less volatile consumer discretionary stock is McDonald’s.
Factor 4: Momentum
One factor that has seen decent performance recently is momentum (see Fig. 2). We define momentum as the spread of the S&P 500 Momentum index (SPMO 1.63% ) over the S&P 500 index (SPY 0.91% ). Over the past 3 months, this factor has returned 1.6%. Historically, momentum has seen periods of significant volatility, particularly during the tech bubble crash and the rally off the lows following the Financial Crisis of 2008-9. However, momentum has generally trended upward since 2000.
Fig. 2 – Momentum Factor Performance
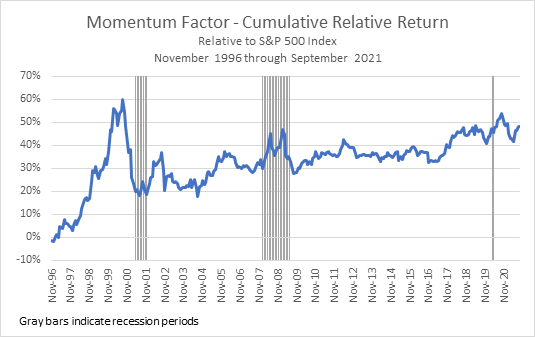
Large swings in momentum have historically coincided with periods of economic instability. Large momentum losses tend to accrue around recessions, this is seen in the chart above.
What it Means: Momentum is the most dynamic of the factors presented in this report, and it is particularly divorced from historical sector association given the intra-index rotations that have been occurring. Momentum very simply captures the stocks that have had the greatest relative price appreciation. The momentum factor we cite is sometimes called price momentum, to distinguish it from other types of momentum (earnings momentum, most notably).
In bearish market action, the momentum cadre will be very different compared to times of economic expansion. Try to disregard terms like momentum stocks and instead focus on the factors to see for yourself how the names on this list change with the economic winds. Tesla for example is often referred to as a momentum stock but it only technically should hold that title when it has recently enjoyed price appreciation (relative to the market). Fortinet (FTNT 0.58% ) and HCA Healthcare (HCA 0.71% ) have recently outperformed the market, and thus are included in the momentum factor.
Factor 5: Small Cap
The fifth and final factor we consider is the small-cap (or size) premium, defined as the return of small-cap stocks over large-cap stocks. We measure this factor as the excess return of the Russell 2000 index (IWM 0.59% ) over the S&P 500 index (SPY 0.91% ) (see Fig. 3). The size factor has seen strong performance over the past year, returning 14.4% in the 12 months ending September 2020.
Fig. 3 – Size Factor Performance
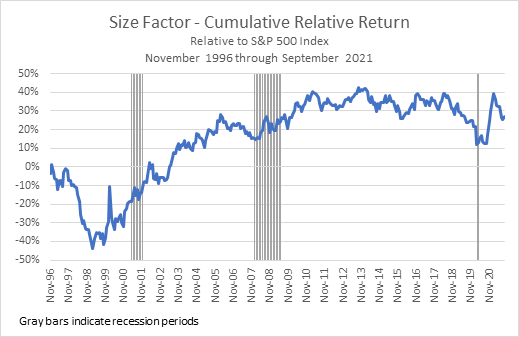
Over the longer-term, the small-cap premium saw positive returns for much of the period from 2000-2010, but then flattened off for much of the past decade. Only recently has the factor seen volatility again, underperforming for about 3 years leading into the pandemic, recovering strongly as the re-opening trades became popular, and then pulling back again over the past six months.
What it Means: Small-Cap stocks are stocks with relatively small market capitalization compared to the rest of the market. These stocks generally are subject to greater risks given their lower levels of capital. This makes them more vulnerable to failure or de-listing in the event of economic downturns or company-specific setbacks. However, when measured at the factor level, they often tend to outperform over time. Even if most small-caps go to zero over a period, the few that survive and grow to a larger size tend to reward investors handsomely.
Many of today’s mega-caps had their start as small-caps years ago. A small-cap inclined strategy can be very lucrative if you identify the right names, but can also expose you to much greater risk than the benchmark or the large and mega-cap names that primarily compose it.
What’s Next?
Next, we will be explaining how to construct a portfolio using the insights gathered through monitoring these five factors. After we have fully introduced the new product, we will be giving periodic updates on how these factors our changing and what it means for markets.


