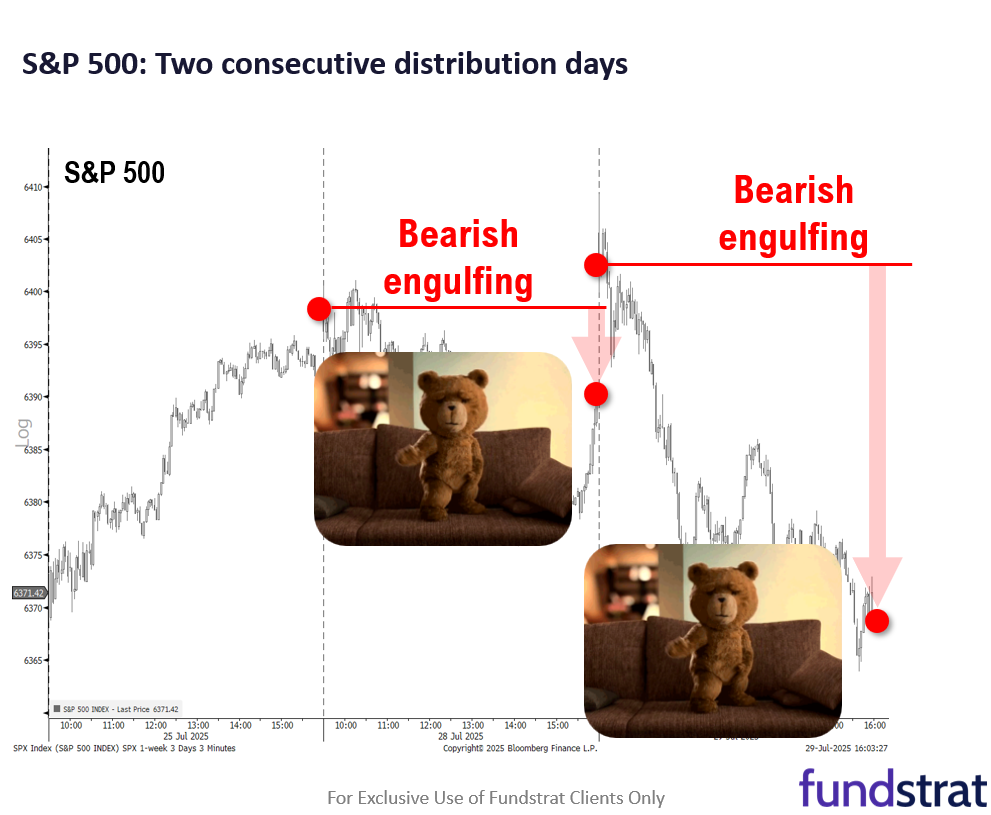
VIDEO: For the last 2 days markets open higher but close down for the day. To us, this is equities consolidating after being up 3% for the month and it is healthy. We think July FOMC rate decision is probably a positive catalyst.
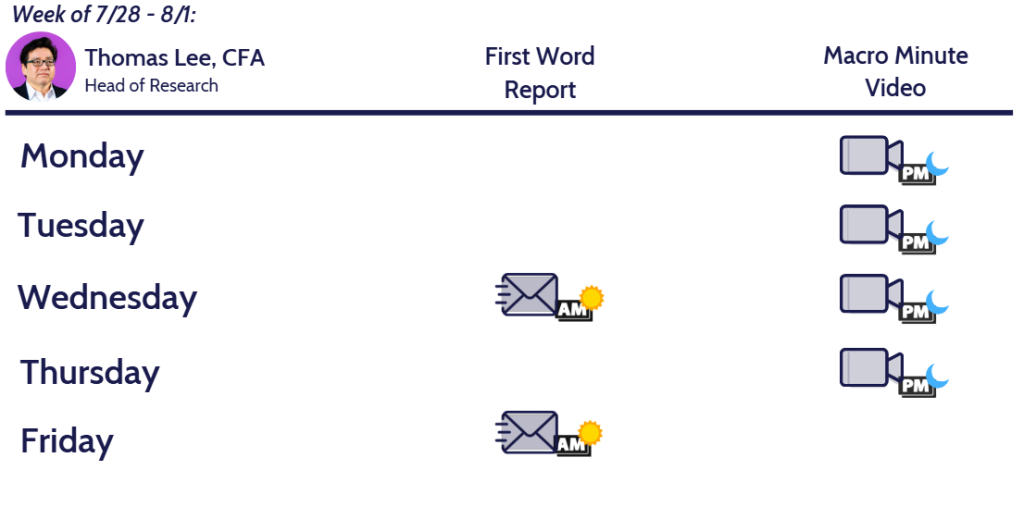
Please click below to view our Macro Minute (duration: 3:46).

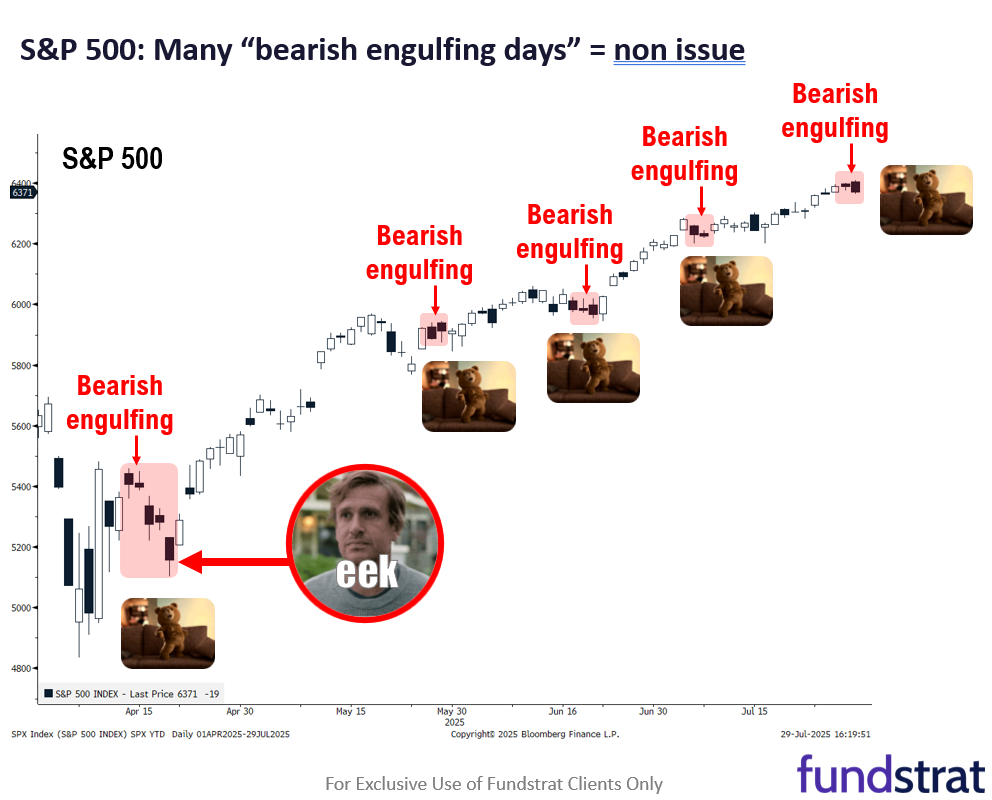
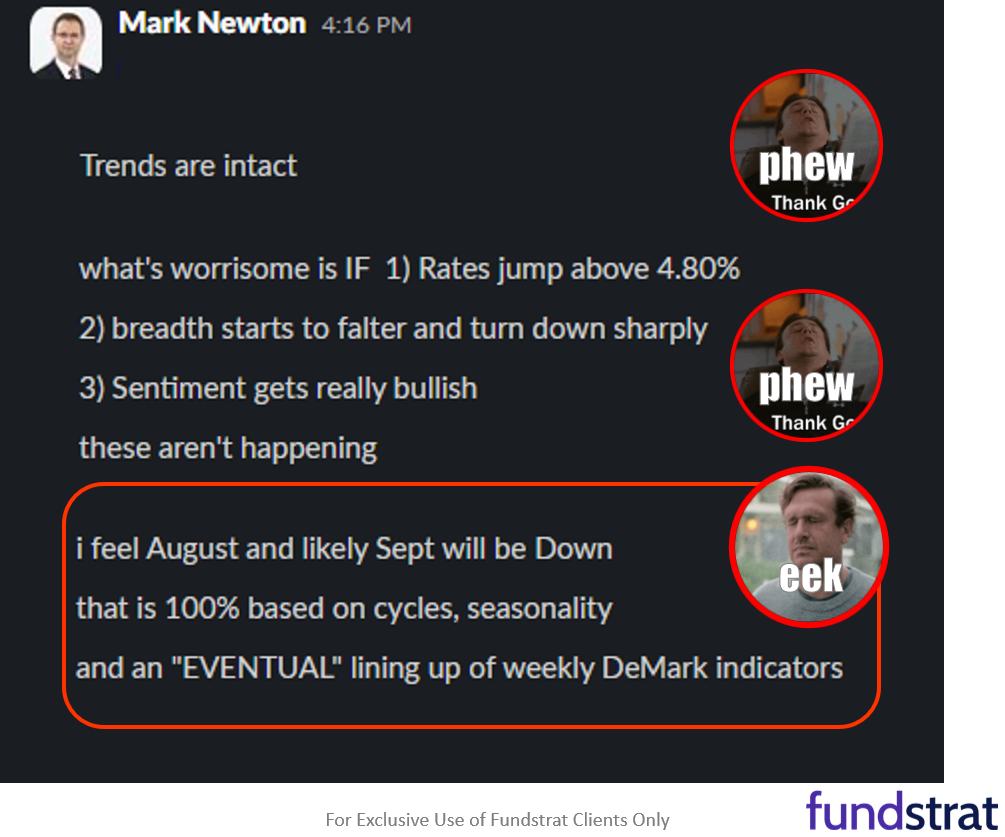
For the past 2 days, equities have risen at the open, only to see stocks fade through the day and close down. This is what Mark Newton, Head of Technical Strategy, calls a “bearish engulfing” pattern. That sounds ominous, but it really means that stocks are digesting gains. Month to date, S&P 500 is up 3% and it is natural to see some flattening into the end of the month.
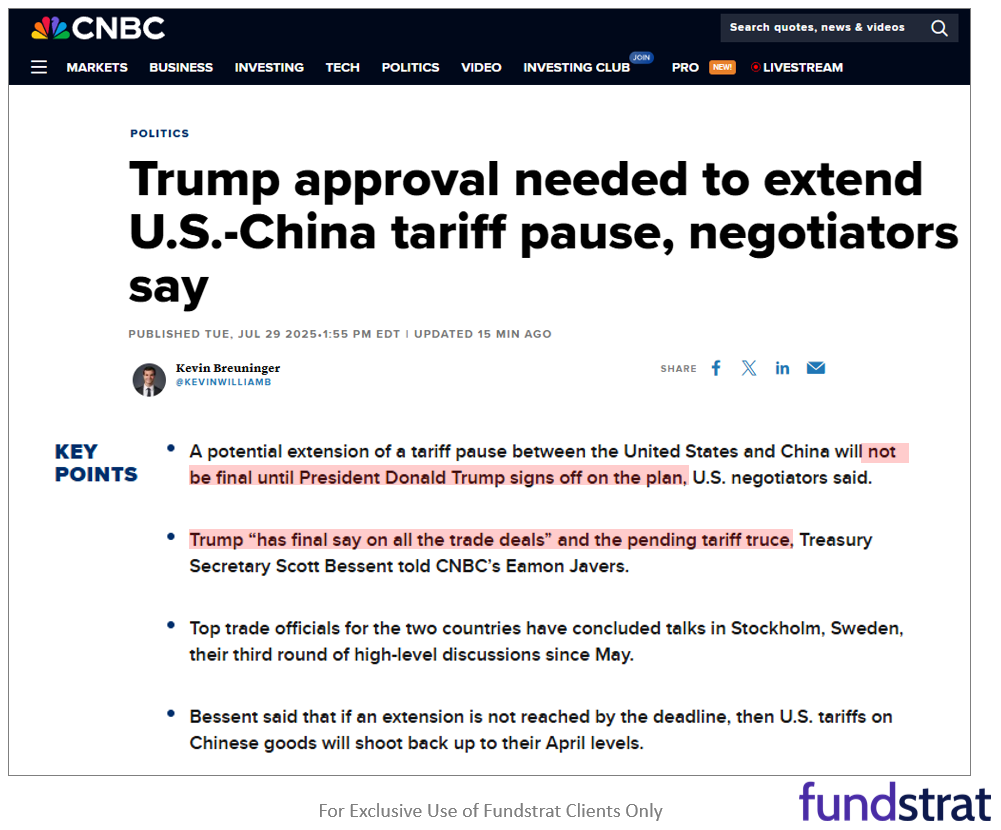
- On the trade front, it looks like the August 1 deadline will apply to most nations with the possible exception of China. I don’t view this as a macro negative. Equities and companies have absorbed a lot of these tariffs and these trade deals have been favorable to the US exporters. The White House said President Trump needs to approve any extension, as it relates to China, so we will know in a few days.
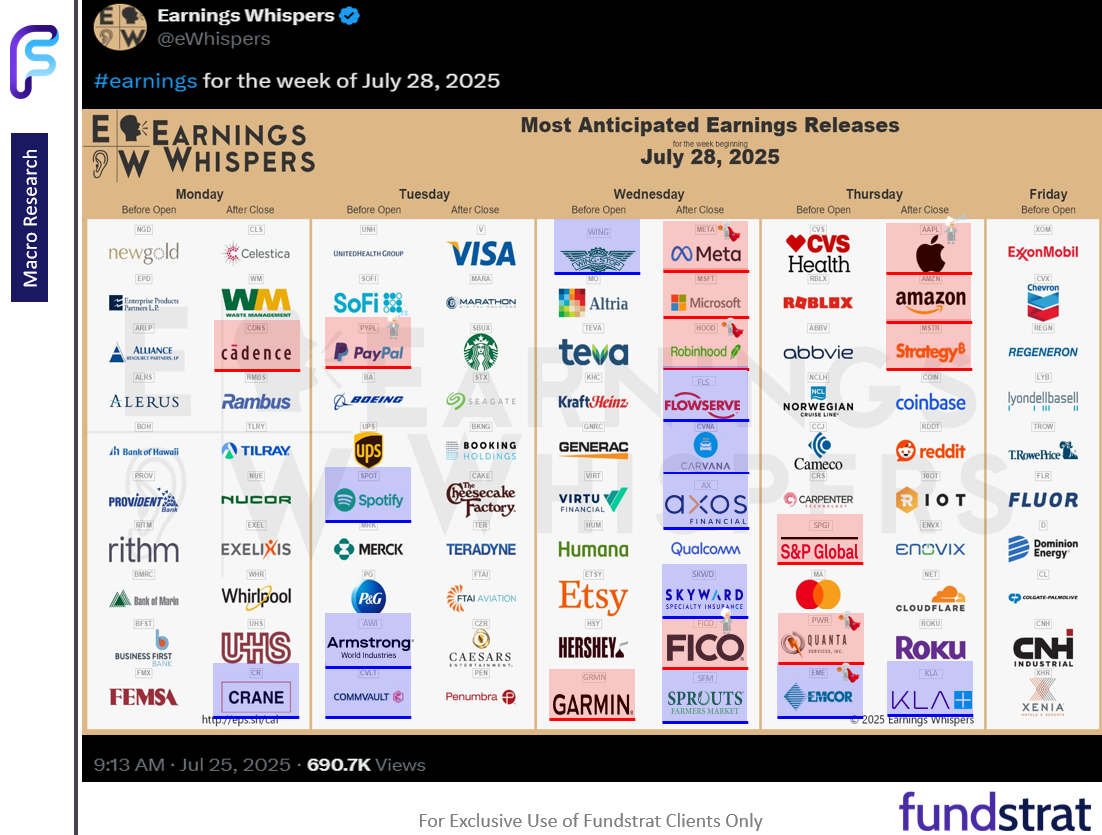
- This is a heavy macro week. The two keys will be FOMC meeting on Wednesday and the Jobs report on Friday:
– 7/28 Mon 10:30 AM ET: Jul Dallas Fed Manuf. Activity Survey 0.9 vs -9.0e
– 7/29 Tue 9:00 AM ET: May S&P CS home price 20-City MoM -0.34% vs -0.20%e
– 7/29 Tue 10:00 AM ET: Jul Conference Board Consumer Confidence 97 vs 96e
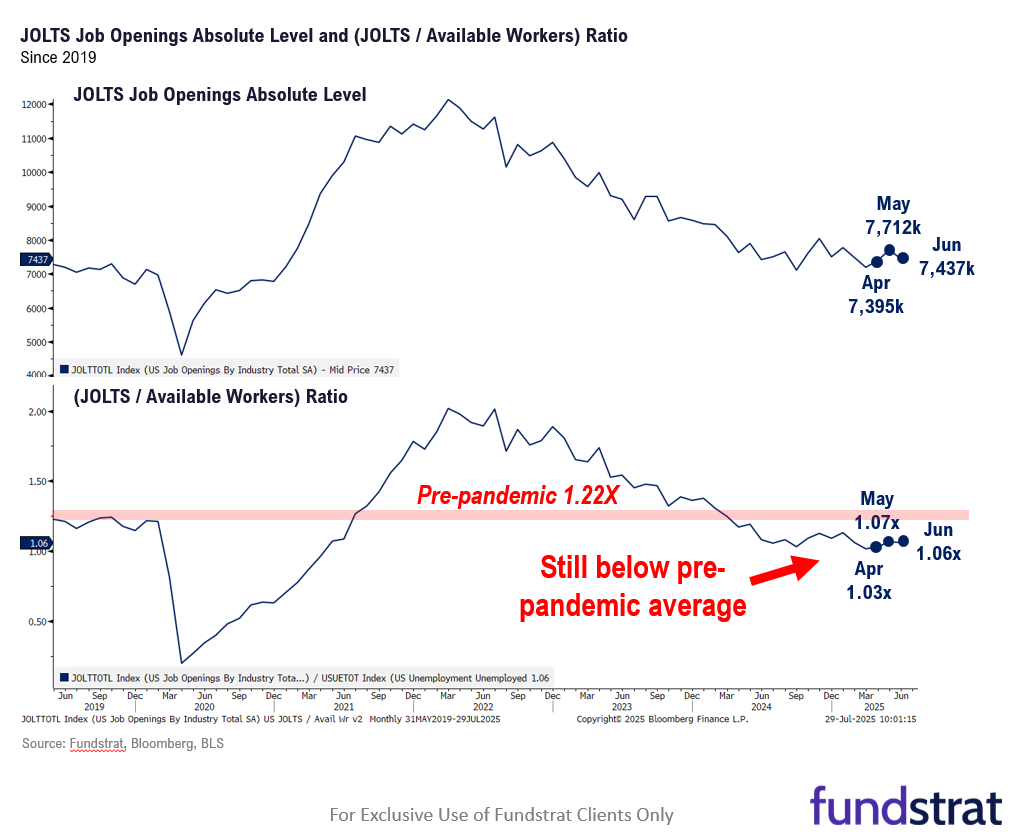
– 7/29 Tue 10:00 AM ET: Jun JOLTS Job Openings 7437k vs 7525ke
– 7/30 Wed 8:30 AM ET: 2Q A GDP QoQ 2.4%e
– 7/30 Wed 2:00 PM ET: Jul FOMC Decision Holde
– 7/31 Thu 8:30 AM ET: Jun Core PCE MoM 0.27%e
– 7/31 Thu 8:30 AM ET: 2Q ECI QoQ 0.8%e
– 8/1 Fri 12:01 AM ET: Reciprocal Tariff Pause Extension Expires
– 8/1 Fri 8:30 AM ET: Jul Non-farm Payrolls 108ke
– 8/1 Fri 9:45 AM ET: Jul F S&P Global Manufacturing PMI 49.5e
– 8/1 Fri 10:00 AM ET: Jul ISM Manufacturing PMI 49.5e
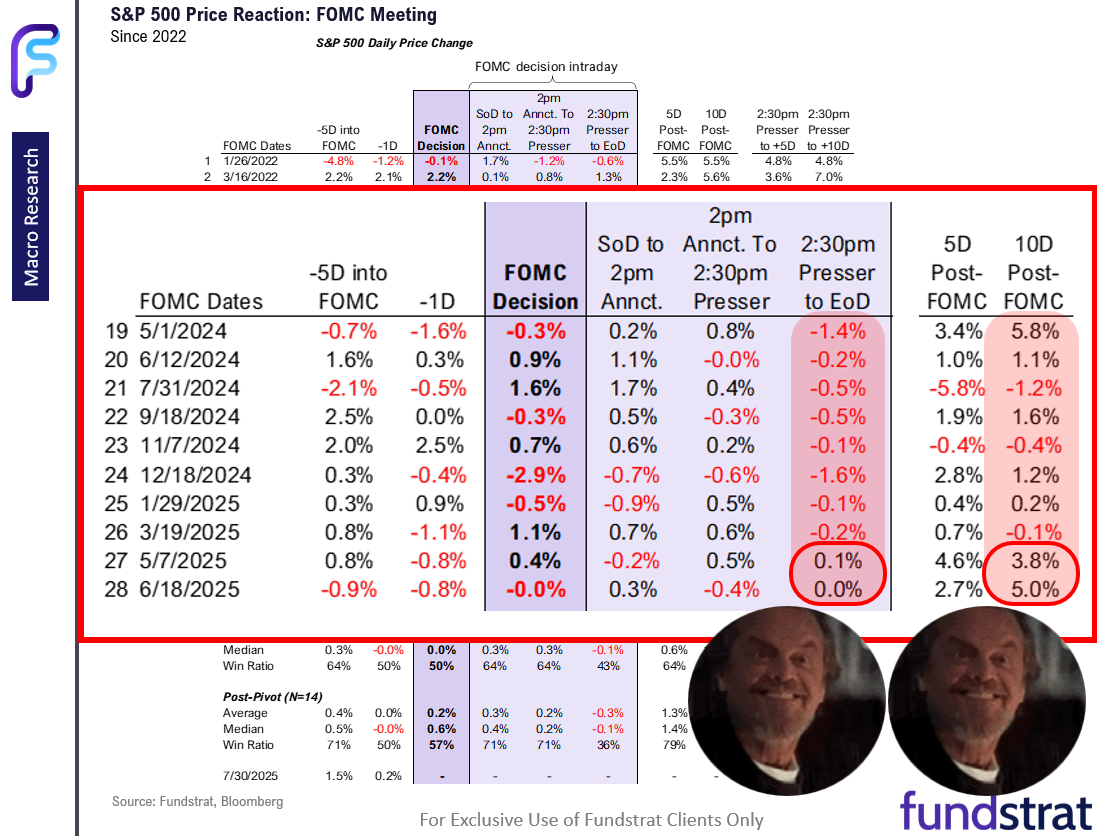
– 8/1 Fri 10:00 AM ET: Jul F U. Mich. 1yr Inf Exp 4.40%e - Regarding July FOMC (Wed), we think the probabilities favor equities rising post-July FOMC rate decision. We realize the odds of the Fed cutting are zero. This was also true of the March and May 2025 meetings:
– but notably, equities gained 4% to 5% (10 days later) after each meeting
– this is a break in pattern where stocks had mixed performance post-FOMC since 2024
– and keep in mind the Fed was on hold both meetings - To us, July is different. The Fed has some sense that inflation might pick up. But the narrative is less “inflation set to rise” and more of “a temporary rise in reported inflation” — the latter gives the Fed the runway to begin cutting in the Fall.
- If markets see odds rising of a cut in the Fall, equities should strengthen.
- Of course, the Fed could simply pour cold water on this, citing the economy is strong enough with current rates. But labor market trends are not signaling universal strength. Look at JOLTS (job openings) which are languishing.
- So we think the Fed has to walk back its inflation views modestly, while the labor market conviction on strength has diminished. Overall, a positive setup given stocks are down the last 2 days.
BOTTOM LINE: Still “most hated rally”
This still remains the “most hated” V-shaped stock rally. We view Bitcoin as a leading indicator and thus, we expect stocks to reattain all time highs, which Bitcoin achieved last week. We see S&P 500 reaching 6,600 by year-end.
And the expected drivers for this upside are:
- Still most hated rally
- Sizable perception gap: Tariff “bark worse than bite”
- Hedge funds increased short interest recently
- $7 trillion cash on sidelines
- Investment outlook better now than in Feb 2025:
– tariff visibility
– tax and de-regulation visibility
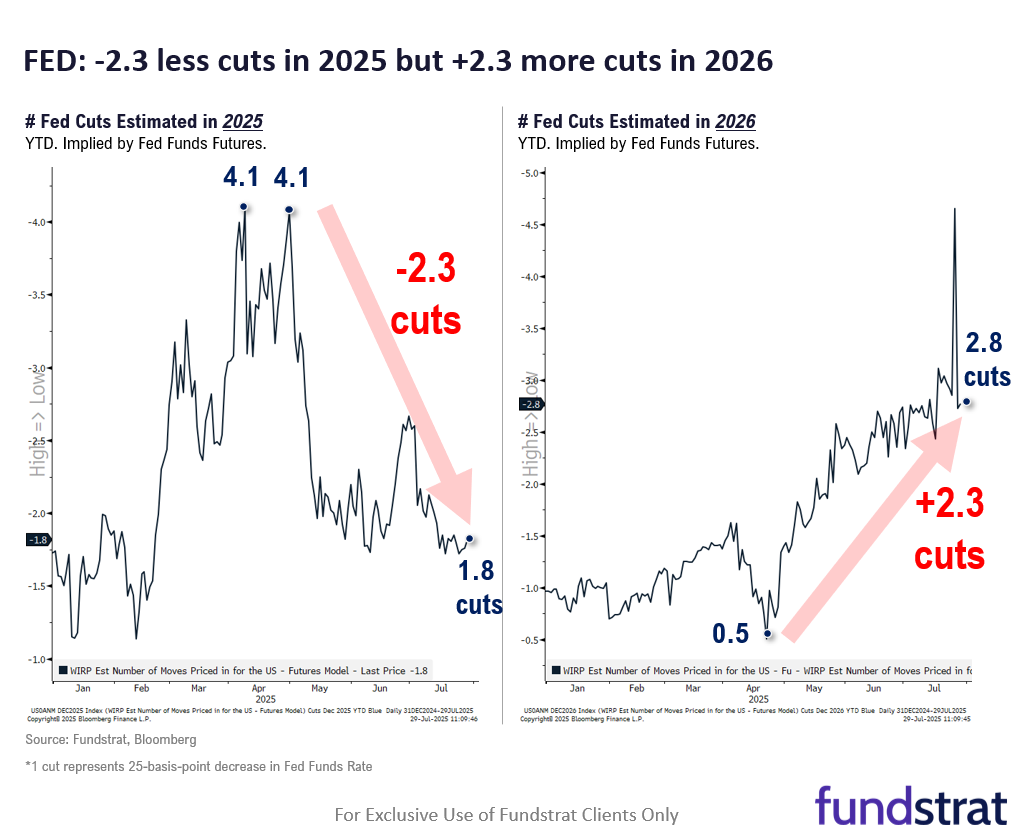
– US cos survived 5th major “stress test”
– Fed more dovish in 2026
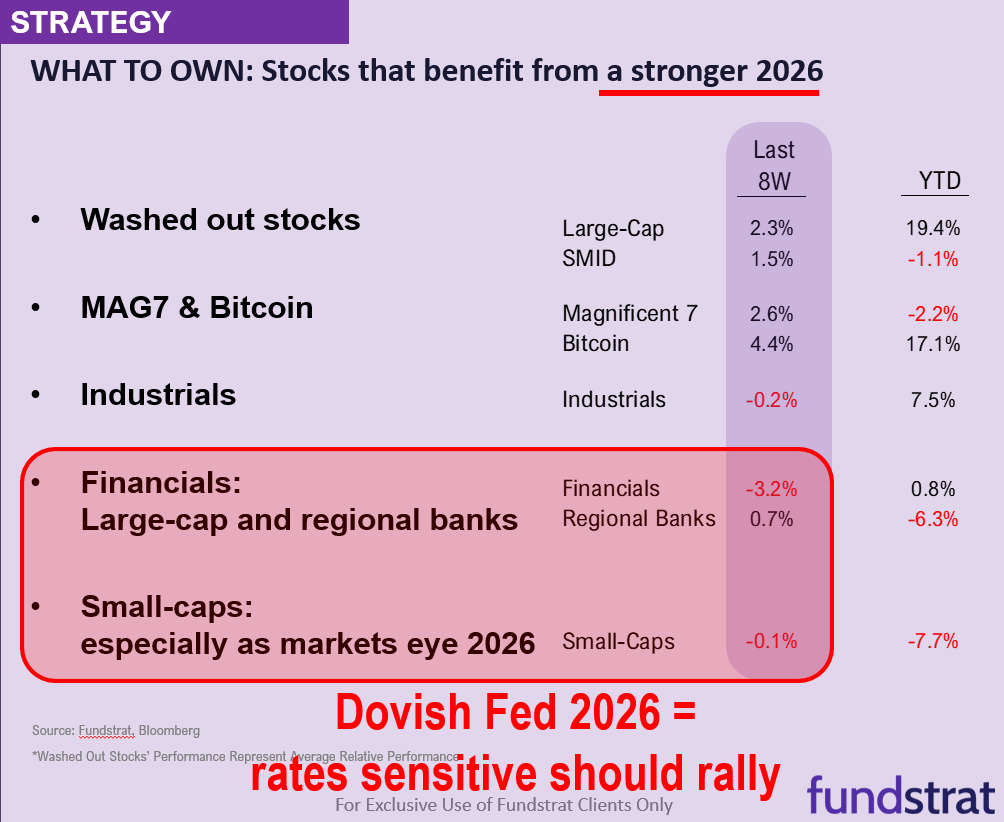
As for what we would buy
- Washed out stocks
- MAG7 & Bitcoin
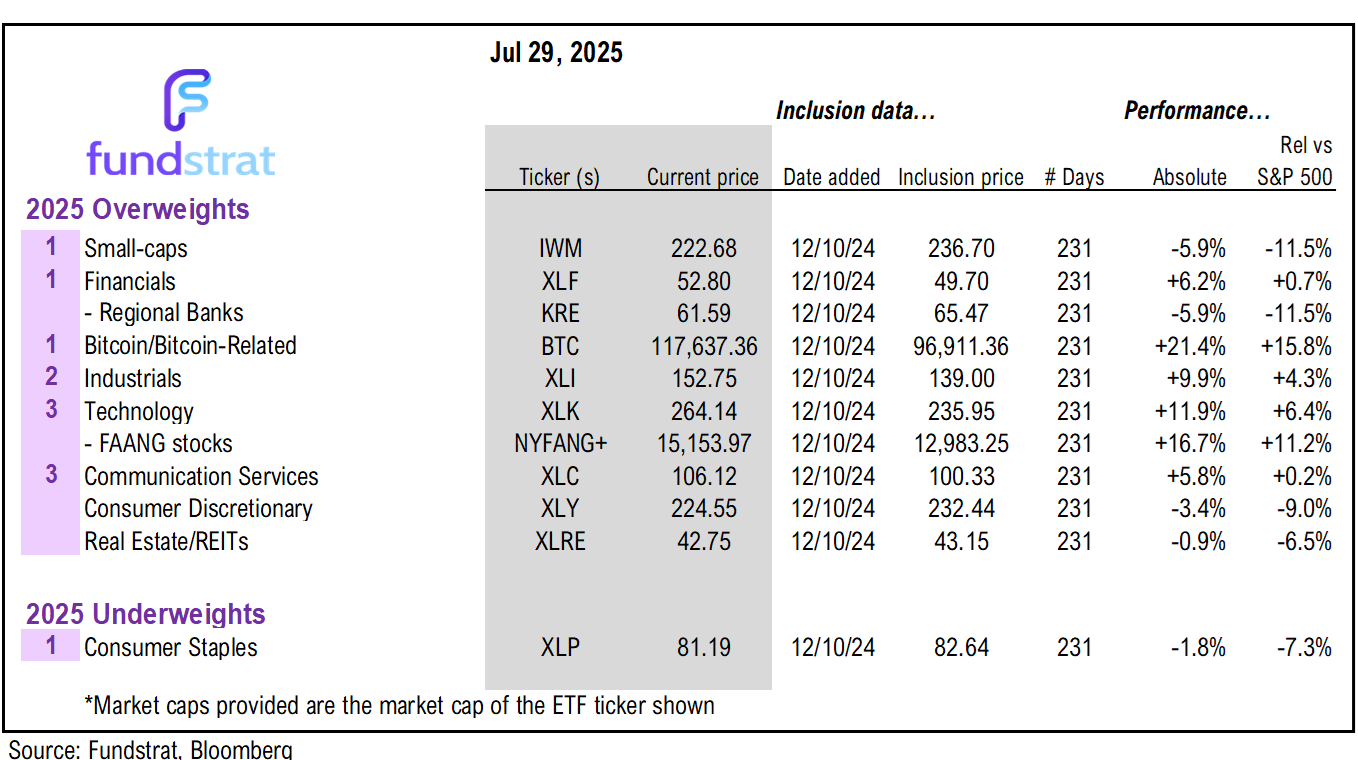
- Industrials
- Financials: Large-cap and regional banks
- Small-caps
The bull market has proven itself intact. We previously identified two lists of “washed out” stocks, both large-cap (22 names) and SMID-cap (27 names). We want to look at stocks which did not make a new low between April 1-April 8, even as the S&P 500 fell to new lows.
The large-cap criteria is as follows:
- Current Market Cap >$15 Billion
- Declined more than 30% before Feb 18th
- Didn’t make new closing low between April 1st & April 8th
- Current price down more than 25% from 52W High
The large-cap “washed out” tickers are:
WBD 0.98% LULU 1.62% TSLA -3.59% DKNG 8.68% DG 3.42% DLTR 3.66% BF STZ -0.23% RKT 3.52% COIN 4.40% HOOD 3.09% HUM 0.55% UAL 1.73% LDOS 1.14% TEAM 1.09% HUBS 0.03% MSTR 1.98% CRM 0.25% NET 3.06% SMCI -1.00% EIX 0.85% VST 3.18%
The SMID-cap criteria is as follows:
- Current Market Cap <$15 Billion
- Declined more than 30% before Feb 18th
- Didn’t make new closing low between April 1st & April 8th
- Current price down more than 25% from 52W High
- Short interest Day to Cover Ratio >2
The SMID-cap “washed out” tickers are:
DJT -1.05% ROKU -2.92% AS -0.44% LCID -3.84% RIVN 0.20% LKQ 1.17% CROX 0.54% NCLH 4.61% WBA CELH -8.06% SOFI 3.94% MKTX 0.92% COLB 1.93% GRAL -0.82% INSP -2.41% PRGO -3.28% CNXC -5.11% DAY -0.28% LUV 2.19% LYFT 3.53% CFLT -1.31% DT 2.52% ESTC 3.97% PCOR 0.64% LITE 0.18% ALAB 1.64% AES -0.42%
_____________________________
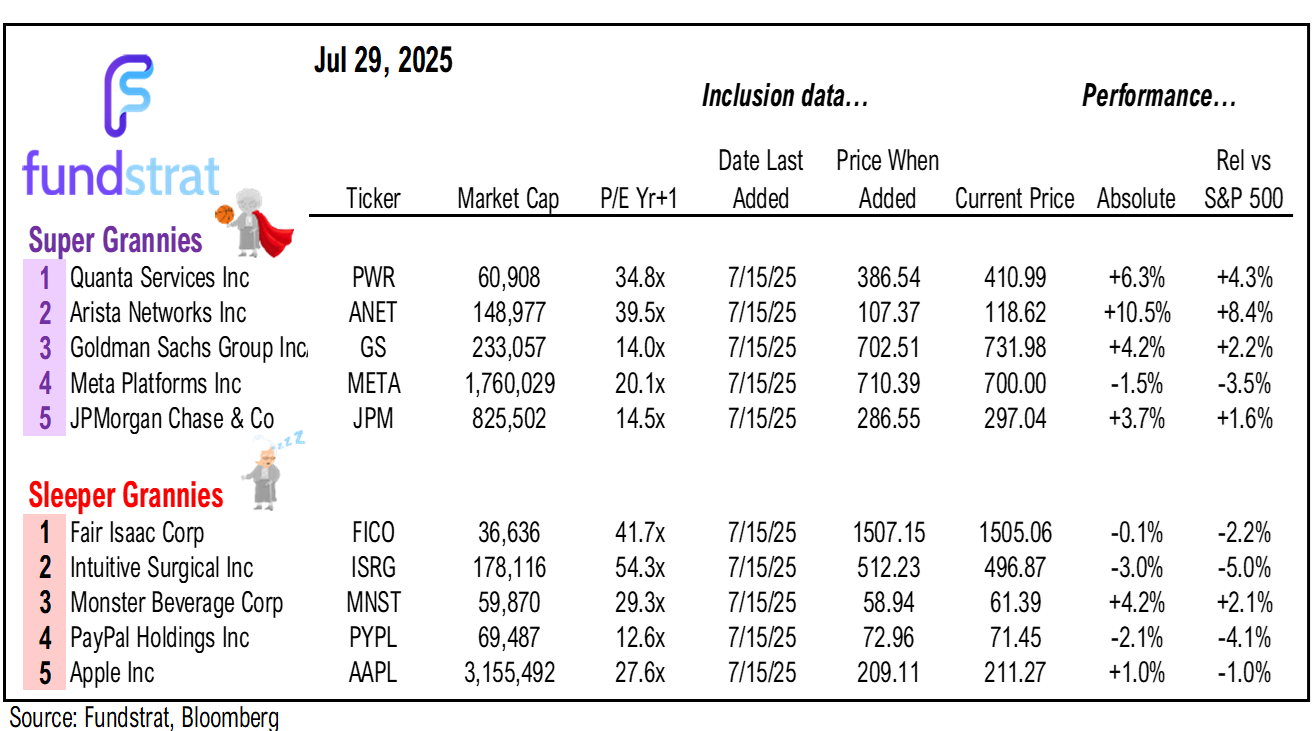
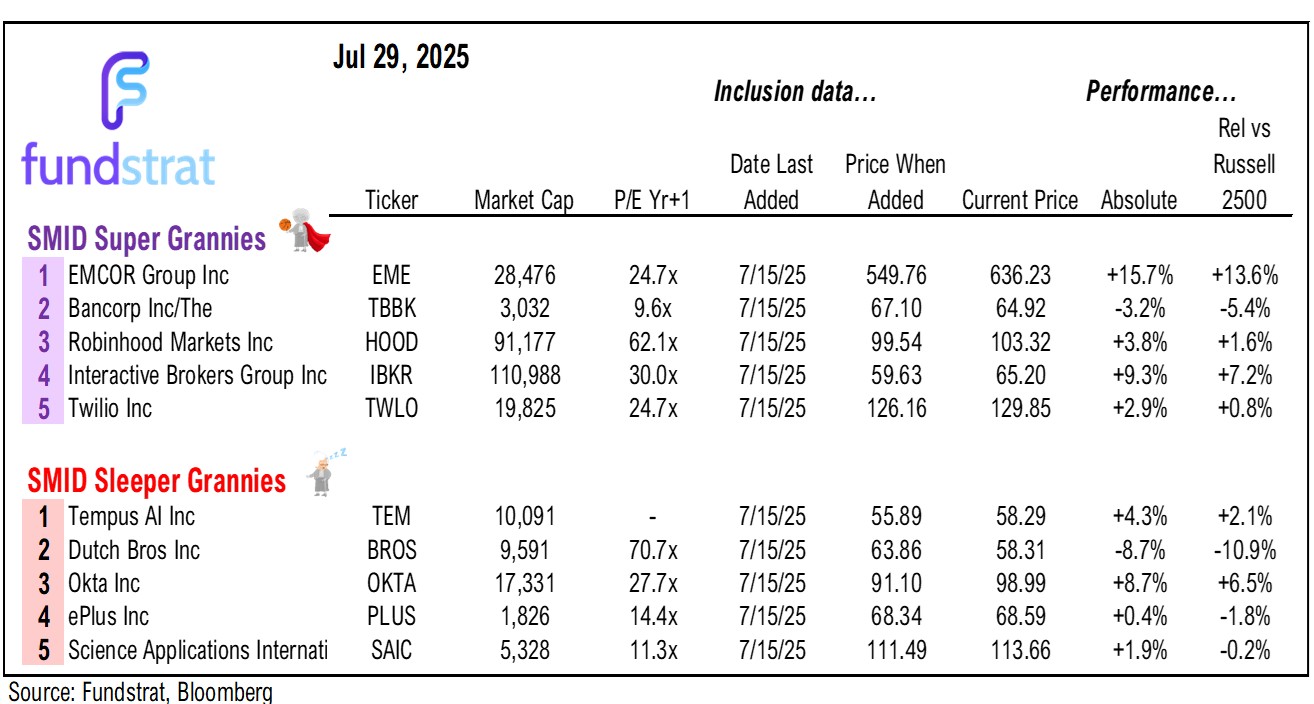
45 SMID Granny Shot Ideas: We performed our quarterly rebalance on 5/22. Full stock list here -> Click here
______________________________
PS: if you are enjoying our service and its evidence-based approach, please leave us a positive 5-star review


Key Incoming Data July:
7/1 9:45 AM ET: Jun F S&P Global Manufacturing PMITame- 7/
1 10:00 AM ET: May JOLTS Job OpeningsMixed 7/1 10:00 AM ET: Jun ISM Manufacturing PMITame7/3 8:30 AM ET: Jun Non-farm PayrollsMixed7/3 8:30 AM ET: May Trade BalanceTame7/3 9:45 AM ET: Jun F S&P Global Services PMITame7/3 10:00 AM ET: May F Durable Goods Orders MoMTame7/3 10:00 AM ET: Jun ISM Services PMITame7/8 6:00 AM ET: Jun Small Business Optimism SurveyTame7/8 9:00 AM ET: Jun F Manheim Used Vehicle IndexMixed7/8 11:00 AM ET: Jun NYFed 1yr Inf ExpTame7/9 2:00 PM ET: Jun FOMC Meeting MinutesMixed7/15 8:30 AM ET: Jun Core CPI MoMTame7/15 8:30 AM ET: Jul Empire Manufacturing SurveyTame7/16 8:30 AM ET: Jun Core PPI MoMTame7/17 8:30 AM ET: Jul Philly Fed Business OutlookTame7/17 8:30 AM ET: Jun Retail SalesTame7/17 9:00 AM ET: Jul M Manheim Used Vehicle IndexTame7/17 10:00 AM ET: Jul NAHB Housing Market IndexTame7/17 4:00 PM ET: May Net TIC FlowsTame7/18 10:00 AM ET: Jul P U. Mich. 1yr Inf ExpTame7/22 10:00 AM ET: Jul Richmond Fed Manufacturing SurveyTame7/23 10:00 AM ET: Jun Existing Home SalesTame7/24 8:30 AM ET: Jun Chicago Fed Nat Activity IndexTame7/24 9:45 AM ET: Jul P S&P Global Services PMITame7/24 9:45 AM ET: Jul P S&P Global Manufacturing PMITame7/24 10:00 AM ET: Jun New Home SalesTame7/24 11:00 AM ET: Jul Kansas City Fed Manufacturing SurveyTame7/25 8:30 AM ET: Jun P Durable Goods Orders MoMTame7/28 10:30 AM ET: Jul Dallas Fed Manuf. Activity SurveyTame7/29 9:00 AM ET: May S&P CS home price 20-City MoMTame7/29 10:00 AM ET: Jul Conference Board Consumer ConfidenceTame7/29 10:00 AM ET: Jun JOLTS Job OpeningsTame- 7/30 8:30 AM ET: 2Q A GDP QoQ
- 7/30 2:00 PM ET: Jul FOMC Decision
- 7/31 8:30 AM ET: Jun Core PCE MoM
- 7/31 8:30 AM ET: 2Q ECI QoQ
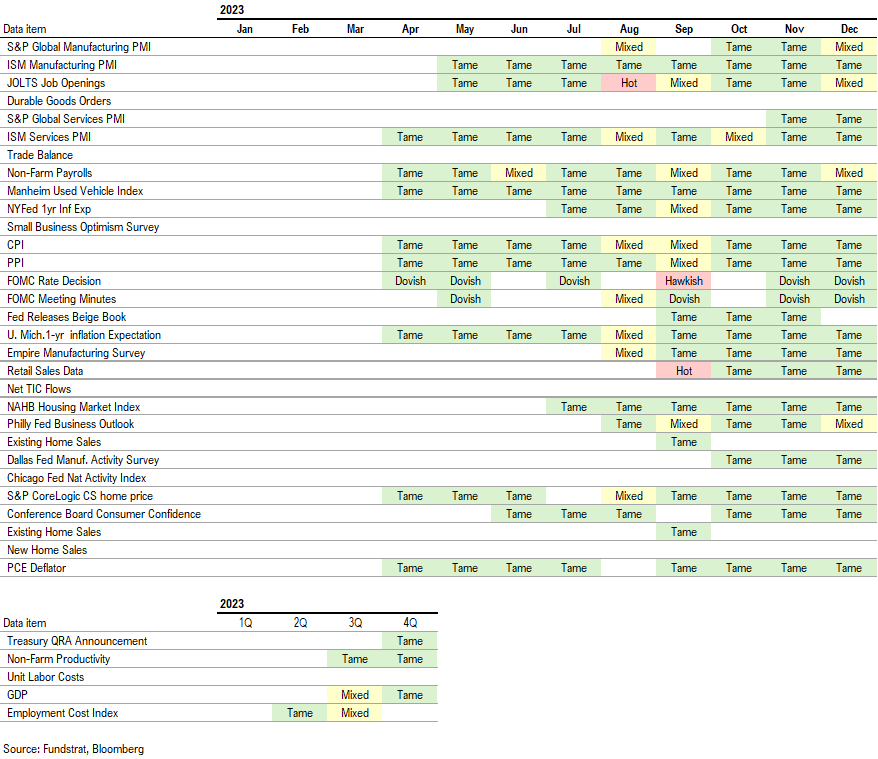
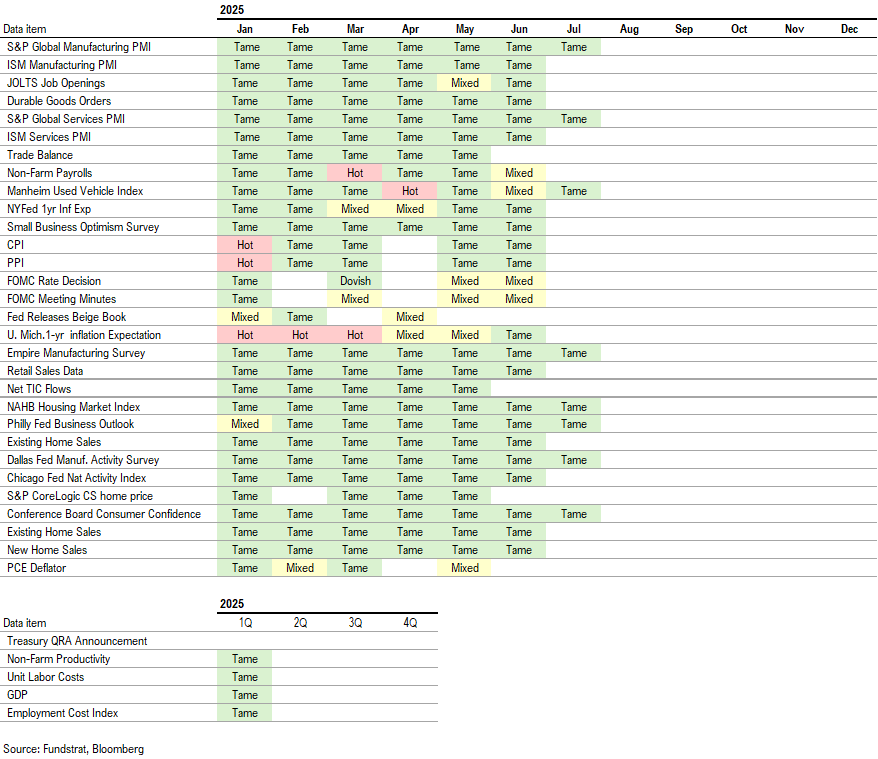
Economic Data Performance Tracker 2025:
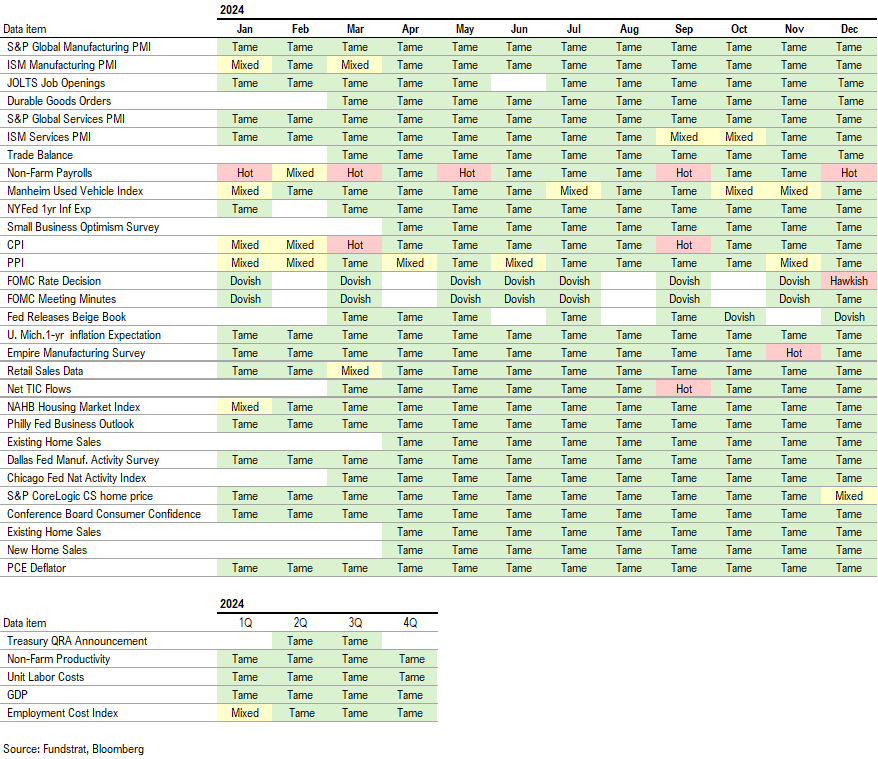
Economic Data Performance Tracker 2024:
Economic Data Performance Tracker 2023: