VIDEO: This week was about earnings (positive) and macro and markets are in a better place now than a week ago, and two weeks ago.
Please click below to view our Macro Minute (duration: 7:08).

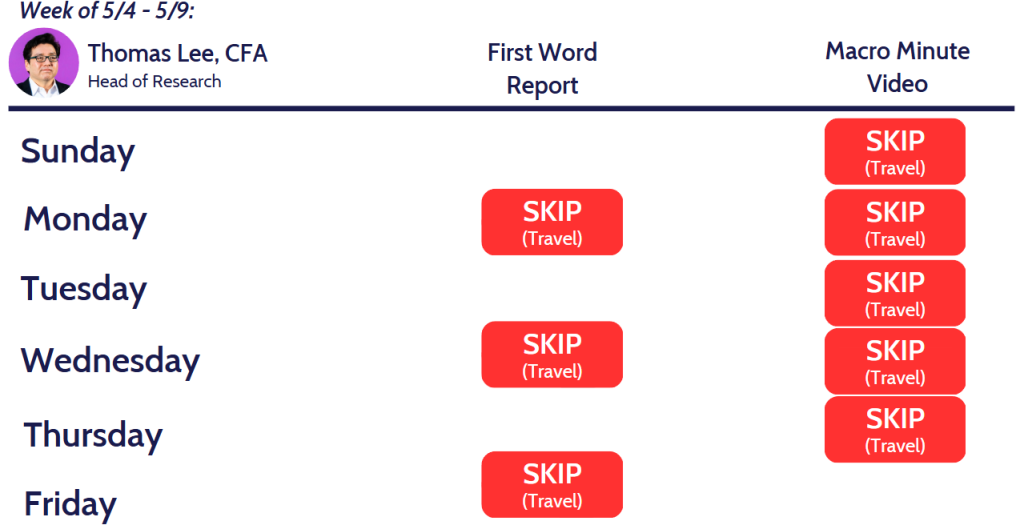
ALERT: I will be travelling out of the country next week and will not be publishing commentary or videos. If market conditions warrant, I will post commentary.
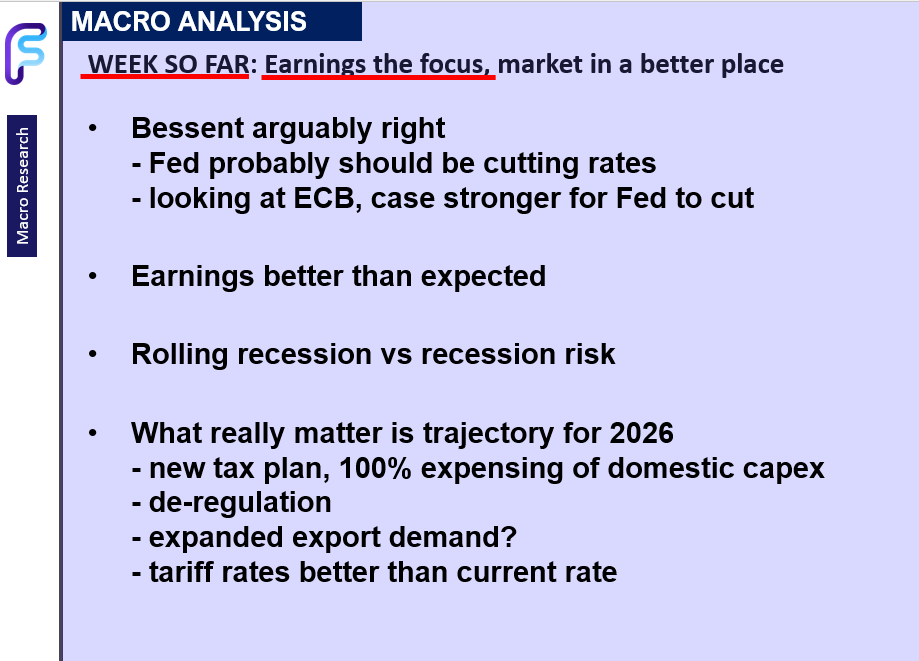
Equities are tracking for +1.5% gain for the week. As we noted at the start of this week, we expected earnings to be the focus (which has been positive overall) and overall, the macro and the market are in a better place this week compared to last week and compared to 2-3 weeks ago. And while business and consumers and investors still do not have “definitive” visibility, the situation has improved incrementally:
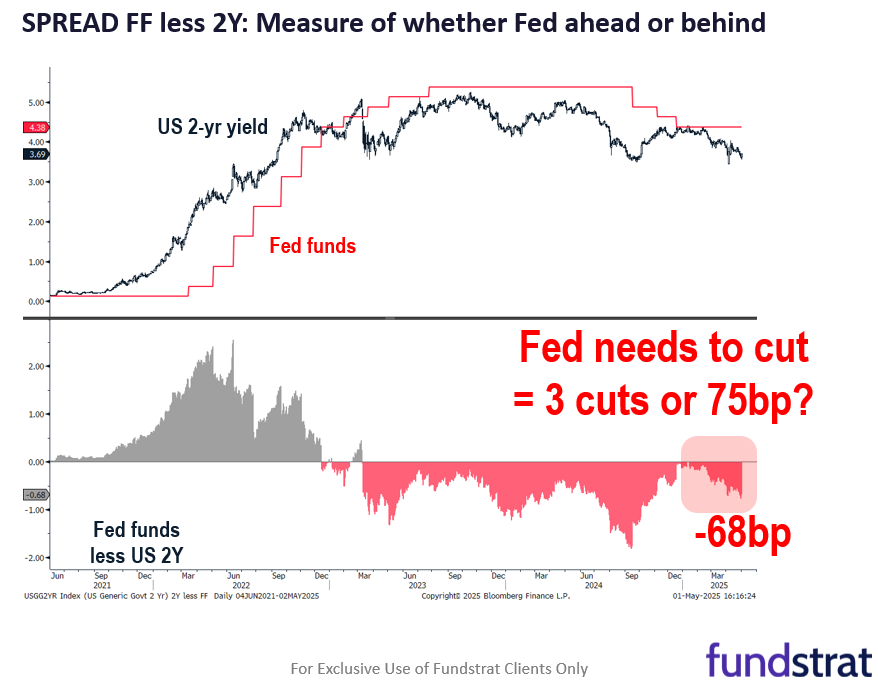
- Thursday, Treasury Secretary Bessent commented that looking at the 2-year yield, the Fed should be cutting. Given the 2-yr is the expected Fed funds in 8 quarters, we can view this as a market-based measure of where monetary policy should be. Arguably Bessent is correct based on 2 arguments:
– first, the 2-yr yield is 68bp below Fed funds, so the market is suggesting Fed is 3 cuts behind
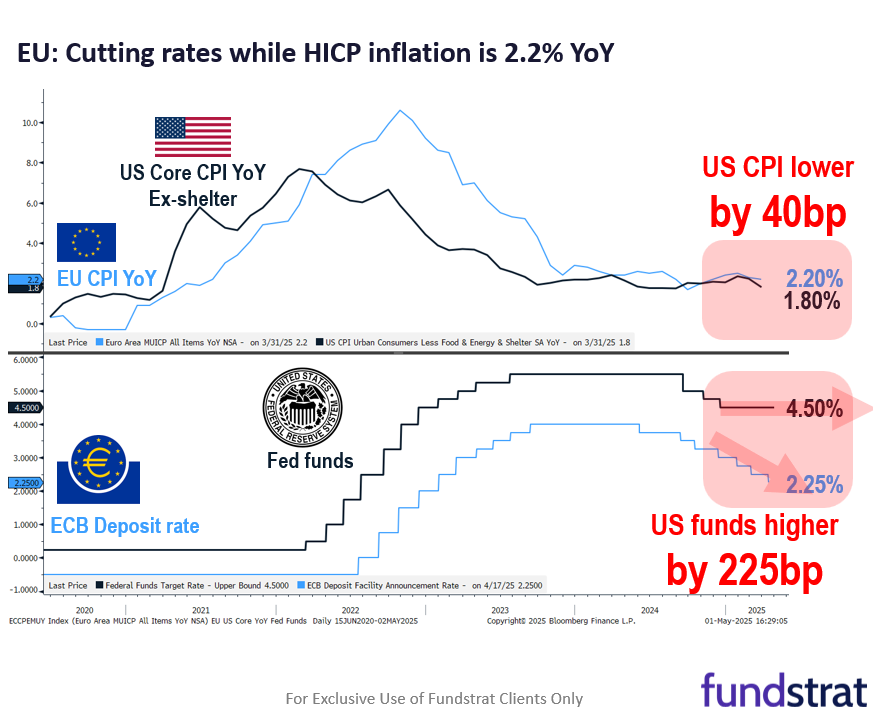
– second, more importantly, when compared to the ECB, Fed is way behind the curve - Let me explain this second argument. According to Eurozone data:
– EU Core CPI is +2.2% based on HICP
– ECB has been cutting rates for past 9 months from 4% to 2.25%
– and cut rates in the most recent meeting
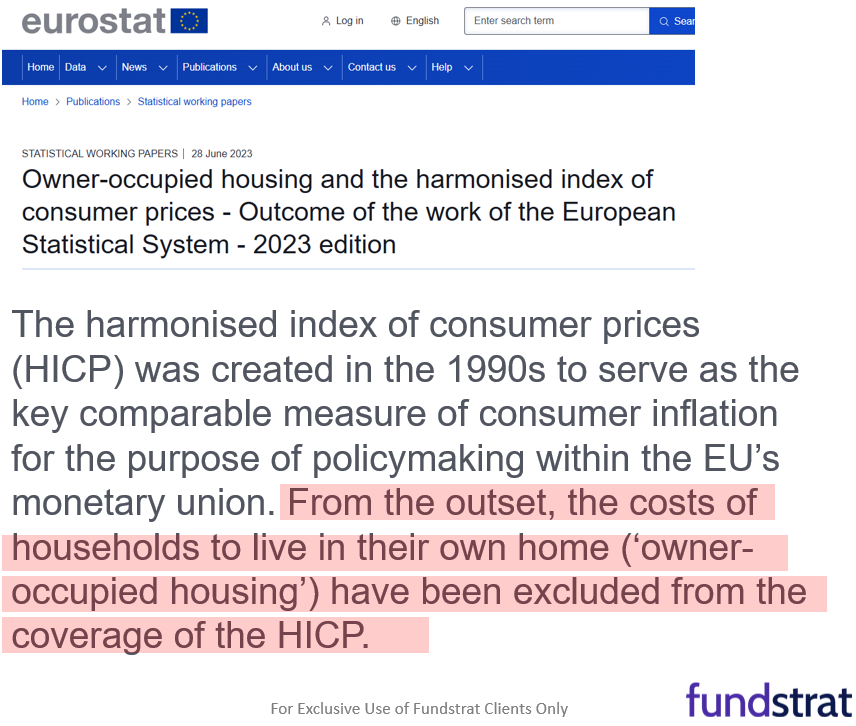
– few argue against this given the EU CPI is around 2% - Here is the thing, HICP (Harmonised index of consumer prices) specifically excludes shelter in the calculation. In the words of the European Statistical System:
– “The harmonized index of consumer prices (HICP) from the outset, the costs of households to live in their own home (‘owner-occupied housing’) have been excluded from the coverage of the HICP.“
– In other words, the EU Core CPI is ex-shelter - The BLS provides this exact calculation for US CPI. According to the latest March CPI report:
– March Core CPI ex-shelter –> +1.8%
– this is 40bp below the EU
– Fed funds is 4.5%,
– 225bp above ECB - See the point, the Fed, if using the same guide stick as the ECB, should be making 9 additional cuts. Hence, a further support to the argument made by Bessent.
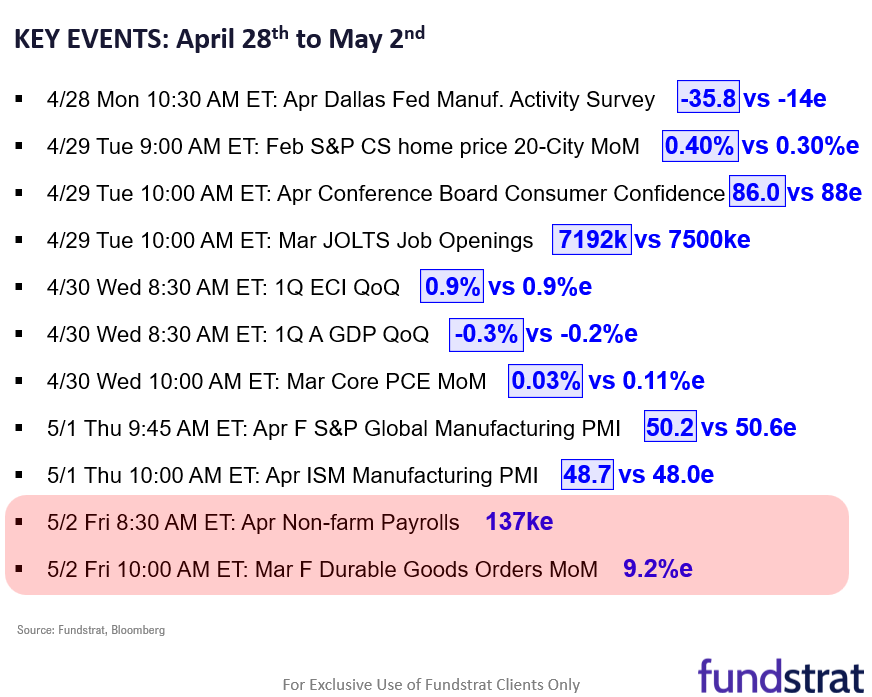
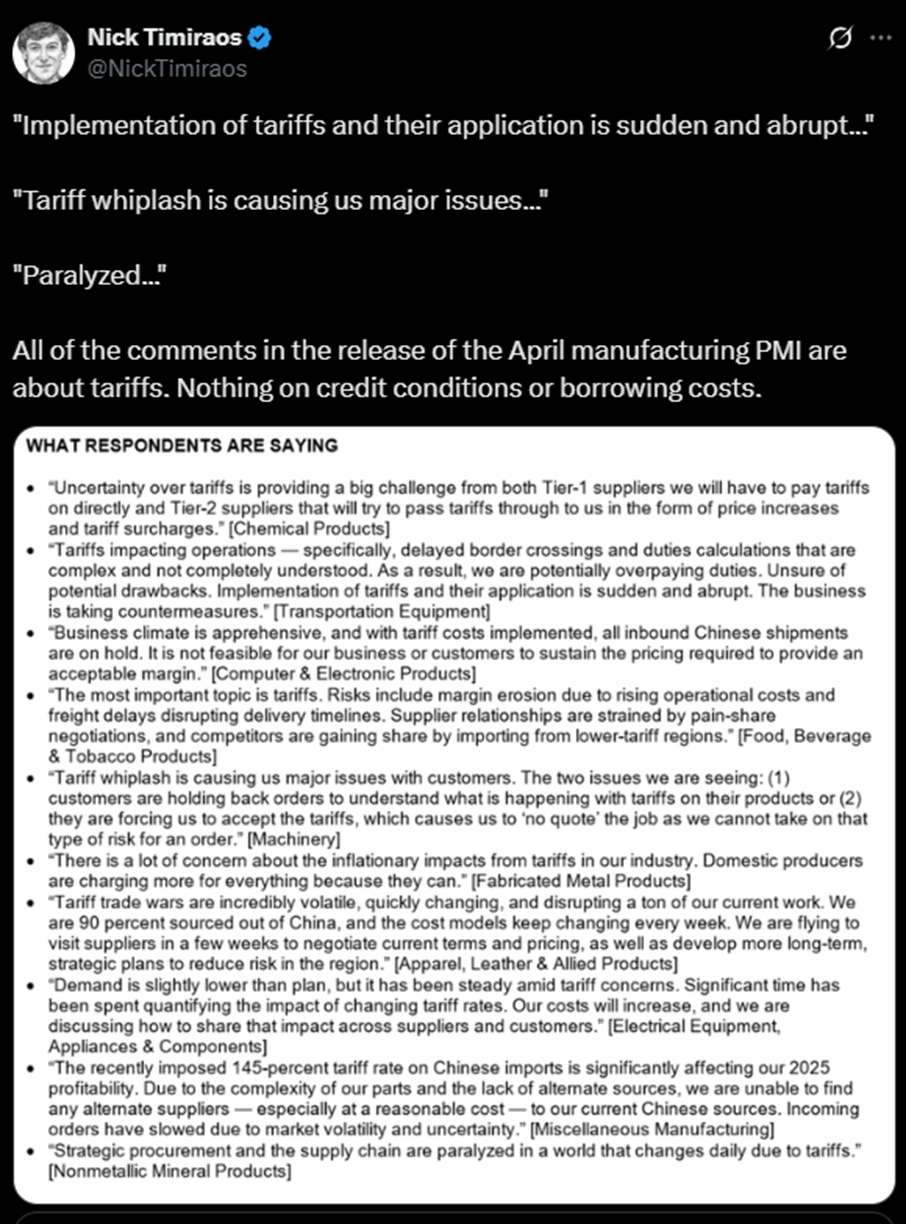
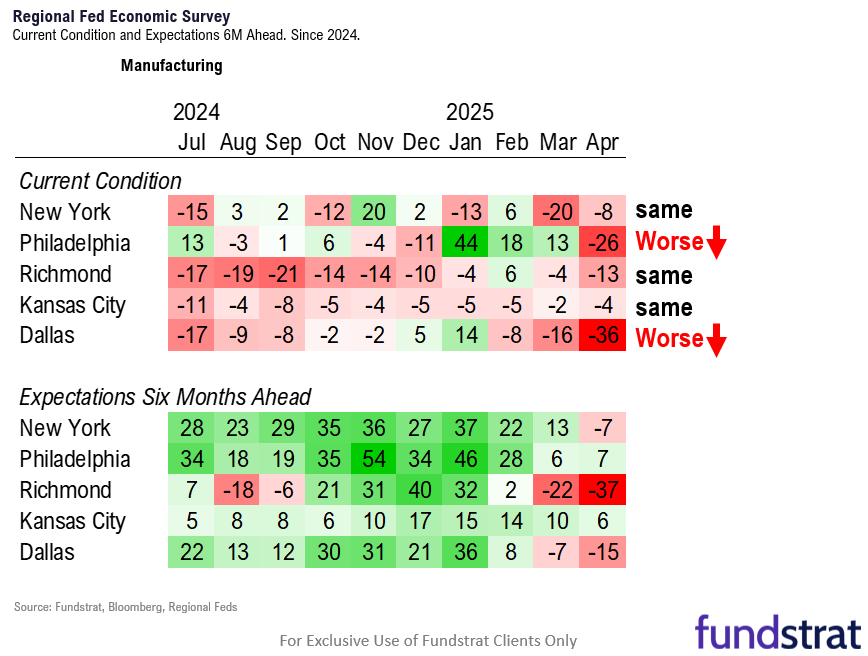
- April ISM manufacturing came in slightly better than expected. Tariffs dominated commentary, which is not entirely surprising.
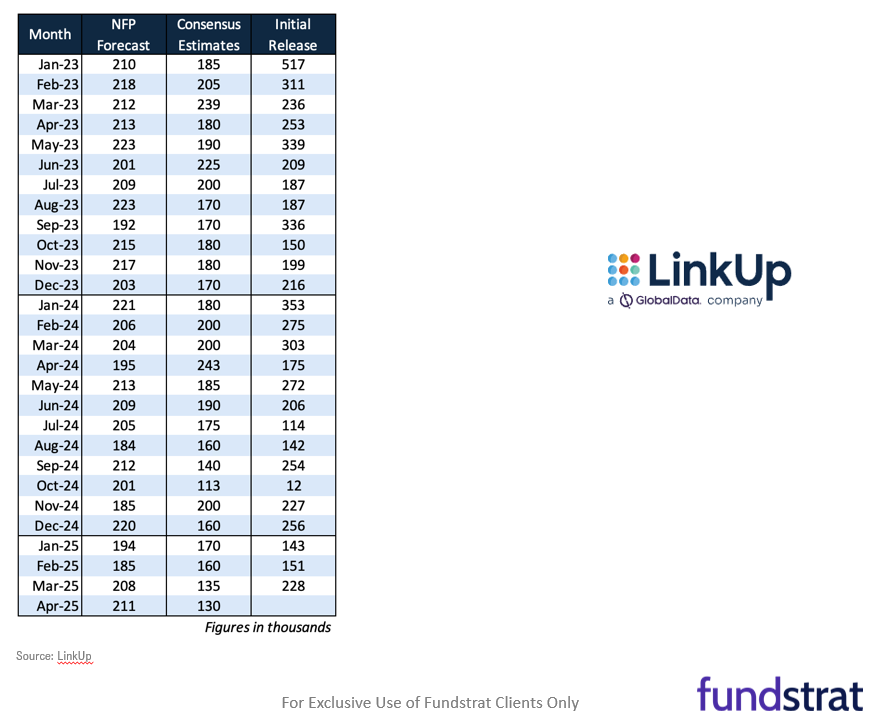
- Friday is the April jobs report. The Street is looking for +137k or so and LinkUp, which has been doing a pretty good job of forecasting jobs directionally, sees upside to +225k or so.
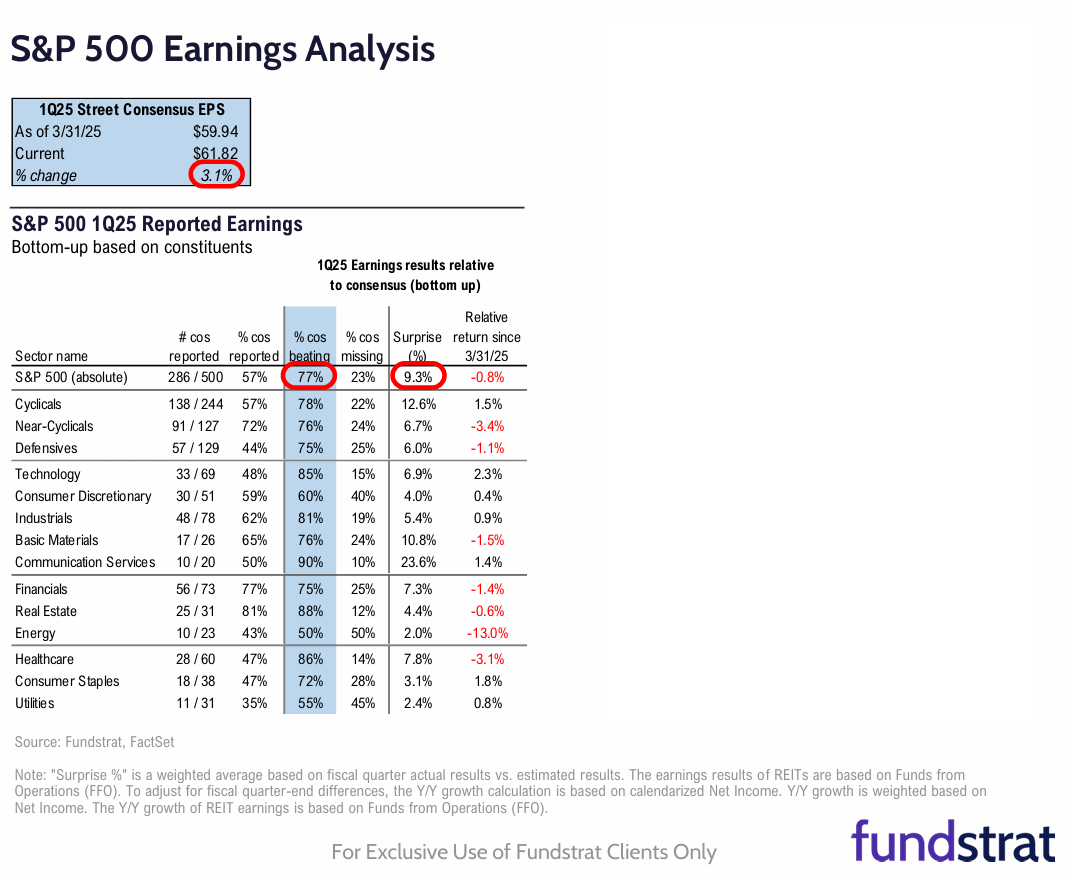
- As for 1Q25 earnings, 57% of the companies have reported and 77% are beating by a sizable +9.3% on EPS. These are far better than expected.
– it is a reminder that US companies do an exceptional job managing shocks
– this current demand shock, while hurting and will hurt more in quarter ahead
– has not crippled US companies
– after the close AMZN 0.70% AAPL -0.44% MSTR 1.98% TDOC -0.29% and other reported
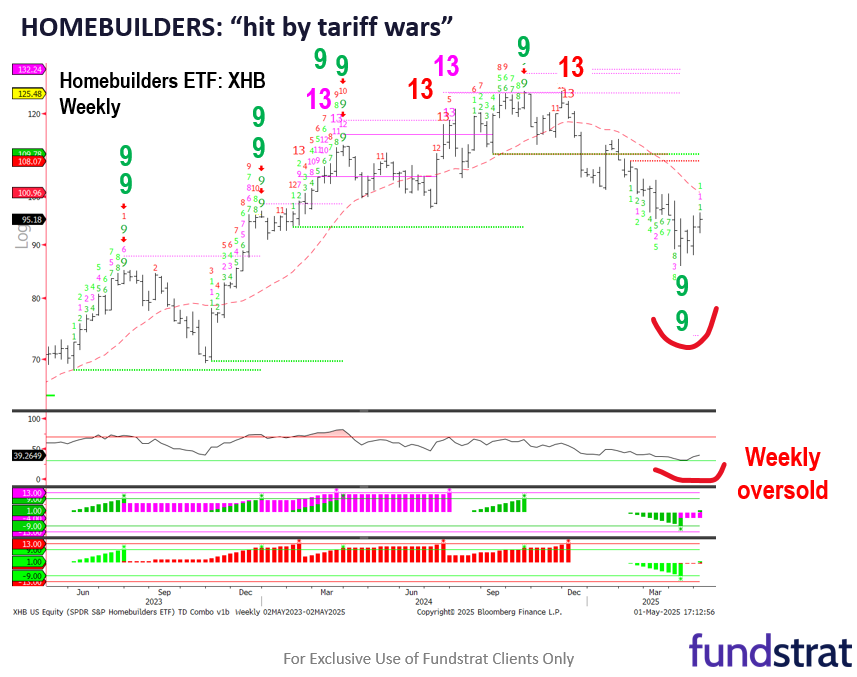
– and overall, looks better than expected - By the way, more and more groups are looking washed out, including homebuilders XHB 0.99% , which we removed from our tactical call because of the April 29 expiry.
- With stocks strengthening this week, it does seem to provide support for the idea that 5 confirming signs of a bottom (5th triggered 4/25) were triggered:
– First, on 4/14: VIX surged to >50 and then closed below 31:
– bottom in 2009 and 2020
– Second, on 4/22: Two consecutive +90% advancer days,
– 3 of 3 times previously confirmed low (3/12/09, 8/9/11 and 4/6/20)
– Third, on 4/23: High-yield OaS recover 50% widening
– confirms we are walking back from recession
– Fourth, on 4/24: Zweig Breadth Thrust triggered
– 11 previous signals, 100% win-ratio 1M, 6M and 12M later
– Fifth, on 4/25: 50% retrace, S&P 500 closed above 5,491 <– 4/25 close 5,525 CLOSE!
- WHAT COULD GO WRONG? The other shoes to drop (worrying investors) are:
– Tariff war turns into “Cold War”
– Economic ripples from “shock” lead to global recession
– Financial crisis ensues from rapid financial de-leveraging
– Inflation expectations surge leading to “greed-flation” and Fed is forced to hike rates
– S&P 500 EPS estimates fall >20% from here
BOTTOM LINE: Probabilities favor “V-shaped” recovery
Given the confirmation signals above, we believe the probabilities favor a V-shaped recovery (versus a W-shaped ala 2011). We realize this is counterintuitive given the lack of earnings visibility. But the likely reason is equities collapsed from 2/18 to 4/7, and this waterfall decline reset positioning and sentiment in a way to allow for a V-shaped recovery.
- But ultimately, what really matter is trajectory for 2026
– new tax plan, 100% expensing of domestic capex
– de-regulation
– expanded export demand?
– tariff rates better than current rate - we think this is the reason that if tariff deals are soon announced, equities can further recover.
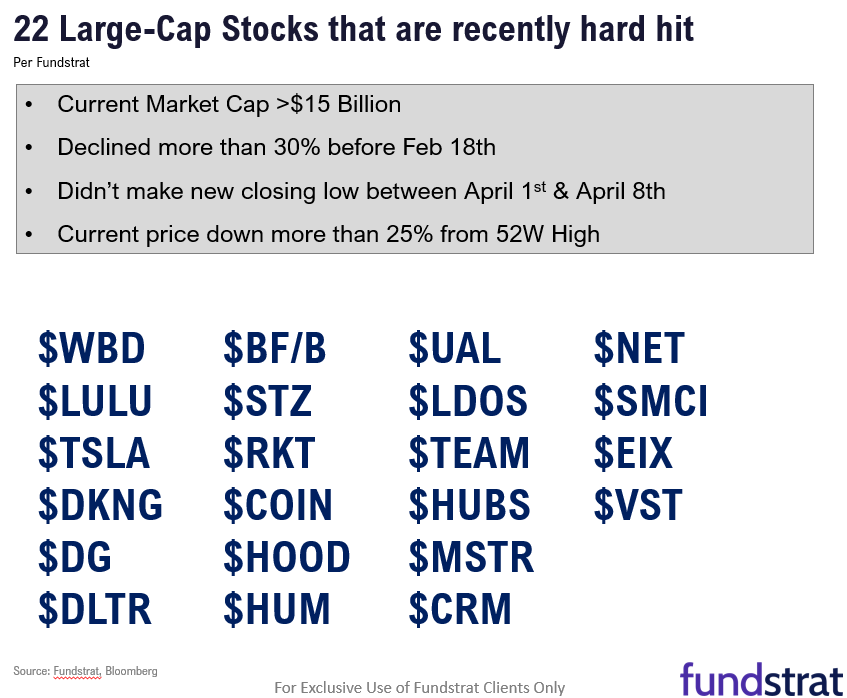
The bull market has proven itself intact. We have identified two lists of “wash out” stocks, both large-cap (22 names) and SMID-cap (27 names). We want to look at stocks which did not make a new low between April 1-April 8, even as the S&P 500 fell to new lows.
The large-cap criteria is as follows:
- Current Market Cap >$15 Billion
- Declined more than 30% before Feb 18th
- Didn’t make new closing low between April 1st & April 8th
- Current price down more than 25% from 52W High
The large-cap “washed out” tickers are:
WBD 0.98% LULU 1.62% TSLA -3.59% DKNG 8.68% DG 3.42% DLTR 3.66% BF STZ -0.23% RKT 3.52% COIN 4.40% HOOD 3.09% HUM 0.55% UAL 1.73% LDOS 1.14% TEAM 1.09% HUBS 0.03% MSTR 1.98% CRM 0.25% NET 3.06% SMCI -1.00% EIX 0.85% VST 3.18%
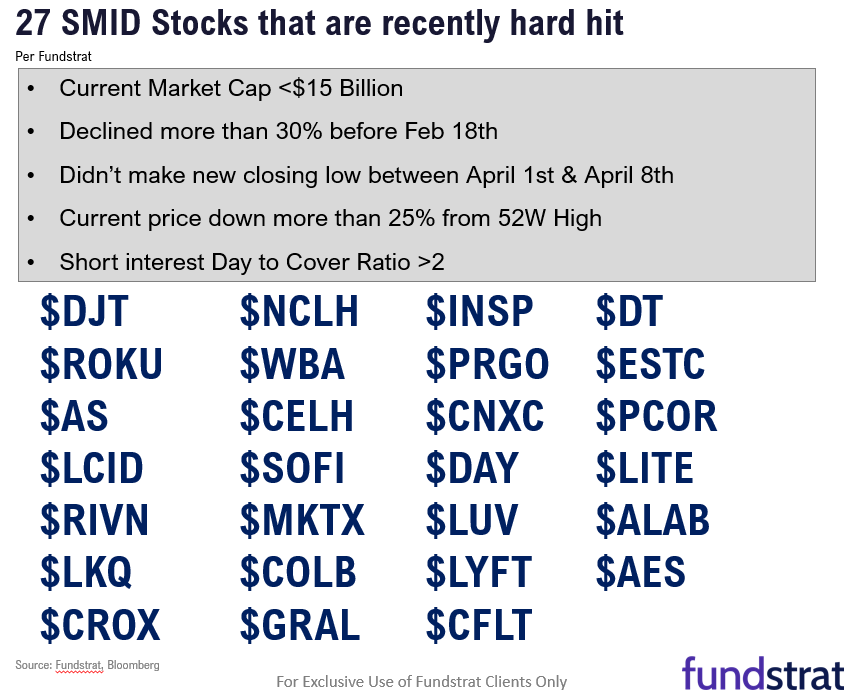
The SMID-cap criteria is as follows:
- Current Market Cap <$15 Billion
- Declined more than 30% before Feb 18th
- Didn’t make new closing low between April 1st & April 8th
- Current price down more than 25% from 52W High
- Short interest Day to Cover Ratio >2
The SMID-cap “washed out” tickers are:
DJT -1.05% ROKU -2.92% AS -0.44% LCID -3.84% RIVN 0.20% LKQ 1.17% CROX 0.54% NCLH 4.61% WBA CELH -8.06% SOFI 3.94% MKTX 0.92% COLB 1.93% GRAL -0.82% INSP -2.41% PRGO -3.28% CNXC -5.11% DAY -0.28% LUV 2.19% LYFT 3.53% CFLT -1.31% DT 2.52% ESTC 3.97% PCOR 0.64% LITE 0.18% ALAB 1.64% AES -0.42%
_____________________________
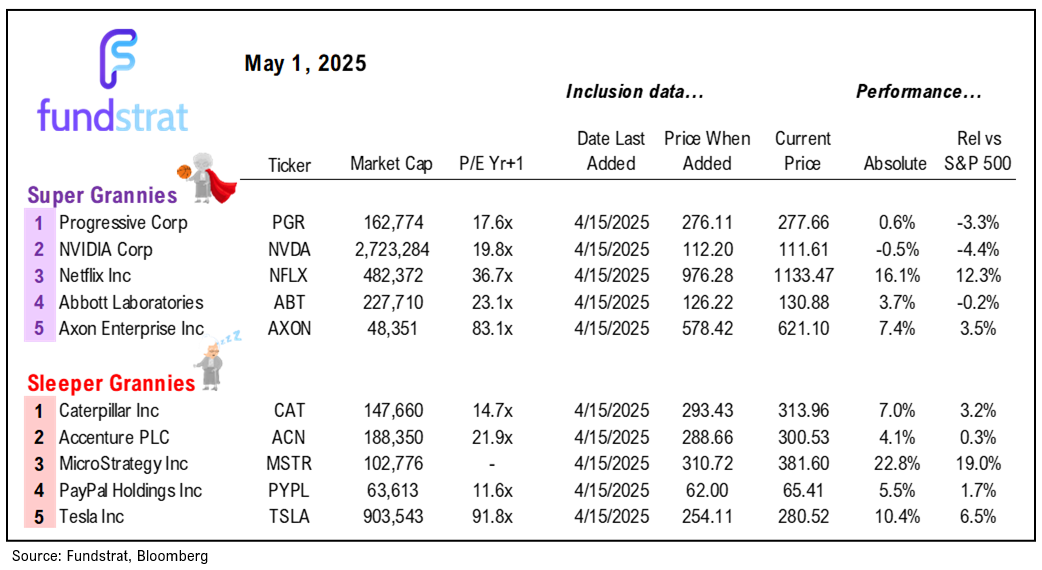
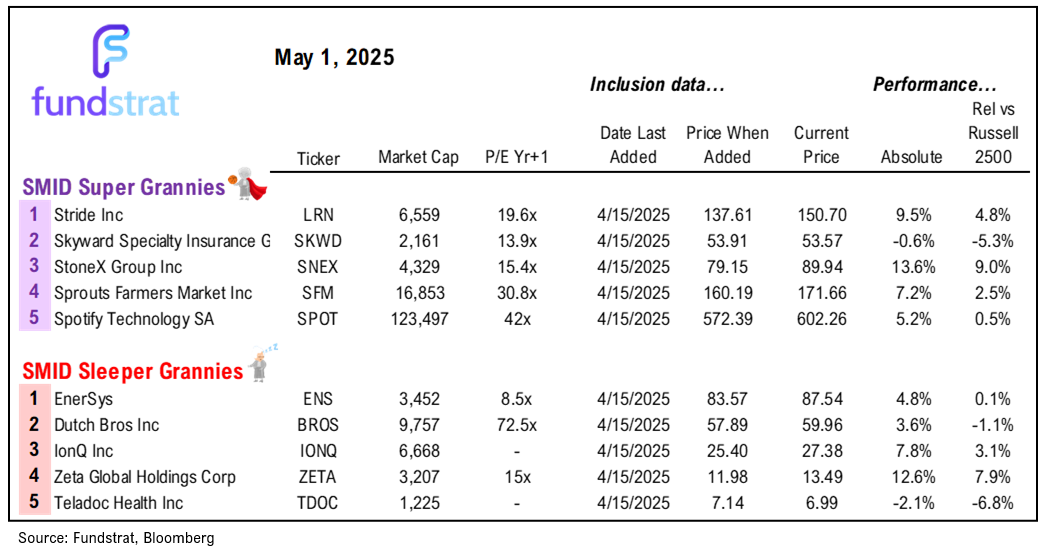
45 SMID Granny Shot Ideas: We performed our quarterly rebalance on 2/18. Full stock list here -> Click here
______________________________
PS: if you are enjoying our service and its evidence-based approach, please leave us a positive 5-star review on Google reviews —> Click here.

Key Incoming Data May:
5/1 9:45 AM ET: Apr F S&P Global Manufacturing PMITame5/1 10:00 AM ET: Apr ISM Manufacturing PMITame- 5/2 8:30 AM ET: Apr Non-Farm Payrolls
- 5/2 10:00 AM ET: Mar F Durable Goods Orders MoM
- 5/5 9:45 AM ET: Apr F S&P Global Services PMI
- 5/5 10:00 AM ET: Apr ISM Services PMI
- 5/6 8:30 AM ET: Mar Trade Balance
- 5/7 9:00 AM ET: Apr F Manheim Used Vehicle Index
- 5/7 2:00 PM ET: May FOMC Decision
- 5/8 8:30 AM ET: 1Q P Unit Labor Costs
- 5/8 8:30 AM ET: 1Q P Non-Farm Productivity QoQ
- 5/8 11:00 AM ET: Apr NY Fed 1yr Inf Exp
- 5/13 6:00 AM ET: Apr Small Business Optimism Survey
- 5/13 8:30 AM ET: Apr Core CPI MoM
- 5/15 8:30 AM ET: May Philly Fed Business Outlook
- 5/15 8:30 AM ET: Apr Core PPI MoM
- 5/15 8:30 AM ET: May Empire Manufacturing Survey
- 5/15 8:30 AM ET: Apr Retail Sales
- 5/15 10:00 AM ET: May NAHB Housing Market Index
- 5/16 10:00 AM ET: May P U. Mich. Sentiment and Inflation Expectation
- 5/16 4:00 PM ET: Mar Net TIC Flows
- 5/19 9:00 AM ET: May M Manheim Used Vehicle Index
- 5/22 8:30 AM ET: Apr Chicago Fed Nat Activity Index
- 5/22 9:45 AM ET: May P S&P Global Services PMI
- 5/22 9:45 AM ET: May P S&P Global Manufacturing PMI
- 5/22 10:00 AM ET: Apr Existing Home Sales
- 5/22 11:00 AM ET: May Kansas City Fed Manufacturing Survey
- 5/23 10:00 AM ET: Apr New Home Sales
- 5/27 8:30 AM ET: Apr P Durable Goods Orders MoM
- 5/27 9:00 AM ET: Mar S&P CoreLogic CS home price
- 5/27 10:00 AM ET: May Conference Board Consumer Confidence
- 5/27 10:30 AM ET: May Dallas Fed Manuf. Activity Survey
- 5/28 10:00 AM ET: May Richmond Fed Manufacturing Survey
- 5/28 2:00 PM ET: May FOMC Meeting Minutes
- 5/29 8:30 AM ET: 1Q S GDP QoQ
- 5/30 8:30 AM ET: Apr Core PCE Deflator MoM
- 5/30 10:00 AM ET: May F U. Mich. Sentiment and Inflation Expectation
Key incoming data April:
4/1 9:45 AM ET: Mar F S&P Global Manufacturing PMITame4/1 10:00 AM ET: Mar ISM Manufacturing PMITame4/1 10:00 AM ET: Feb JOLTS Job OpeningsTame4/2 10:00 AM ET: Feb F Durable Goods Orders MoMTame4/3 8:30 AM ET: Feb Trade BalanceTame4/3 9:45 AM ET: Mar F S&P Global Services PMITame4/3 10:00 AM ET: Mar ISM Services PMITame4/4 8:30 AM ET: Mar Non-farm PayrollsHot4/7 9:00 AM ET: Mar F Manheim Used Vehicle IndexTame4/8 6:00 AM ET: Mar Small Business Optimism SurveyTame4/9 2:00 PM ET: Mar FOMC Meeting MinutesMixed4/10 8:30 AM ET: Mar Core CPI MoMTame4/11 8:30 AM ET: Mar Core PPI MoMTame4/11 10:00 AM ET: Apr P U. Mich. 1yr Inf ExpHot4/14 11:00 AM ET: Mar NYFed 1yr Inf ExpMixed4/15 8:30 AM ET: Apr Empire Manufacturing SurveyTame4/16 8:30 AM ET: Mar Retail SalesTame4/16 10:00 AM ET: Apr NAHB Housing Market IndexTame4/16 4:00 PM ET: Feb Net TIC FlowsTame4/17 8:30 AM ET: Apr Philly Fed Business OutlookTame4/17 9:00 AM ET: Apr M Manheim Used Vehicle IndexMixed4/23 9:45 AM ET: Apr P S&P Global Services PMITame4/23 9:45 AM ET: Apr P S&P Global Manufacturing PMITame4/23 10:00 AM ET: Mar New Home SalesTame4/23 2:00 PM ET: Apr Fed Releases Beige BookMixed4/24 8:30 AM ET: Mar P Durable Goods Orders MoMHot4/24 8:30 AM ET: Mar Chicago Fed Nat Activity IndexTame4/24 10:00 AM ET: Mar Existing Home SalesTame4/25 10:00 AM ET: Apr F U. Mich. 1yr Inf ExpMixed4/28 10:30 AM ET: Apr Dallas Fed Manuf. Activity SurveyTame4/29 9:00 AM ET: Feb S&P CS home price 20-City MoMTame4/29 10:00 AM ET: Apr Conference Board Consumer ConfidenceTame4/29 10:00 AM ET: Mar JOLTS Job OpeningsTame4/30 8:30 AM ET: 1Q A GDP QoQTame4/30 8:30 AM ET: 1Q ECI QoQTame4/30 10:00 AM ET: Mar Core PCE MoMTame
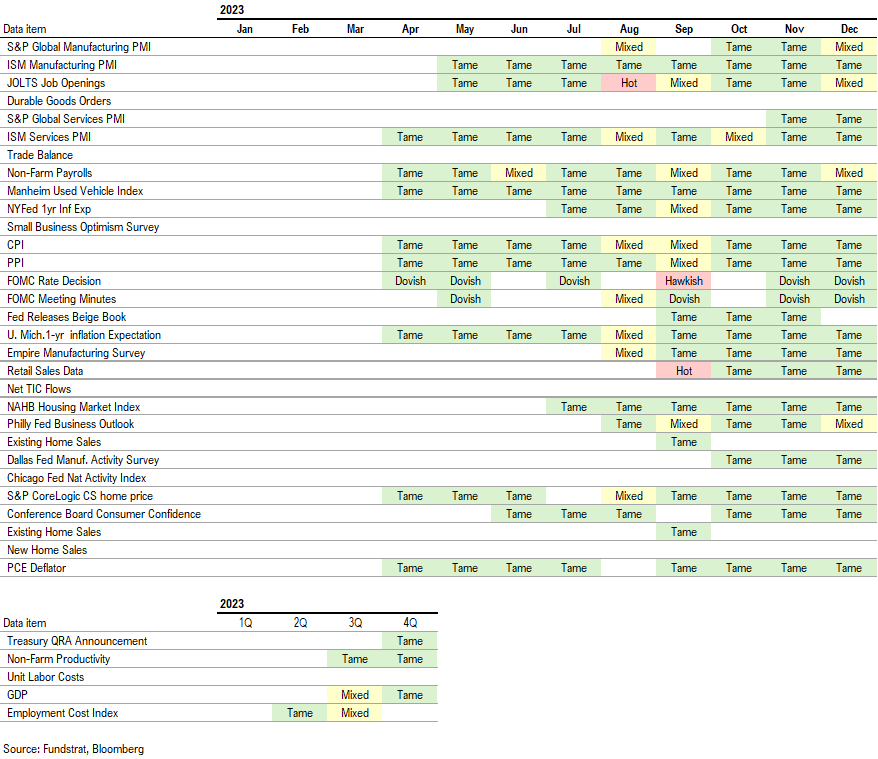
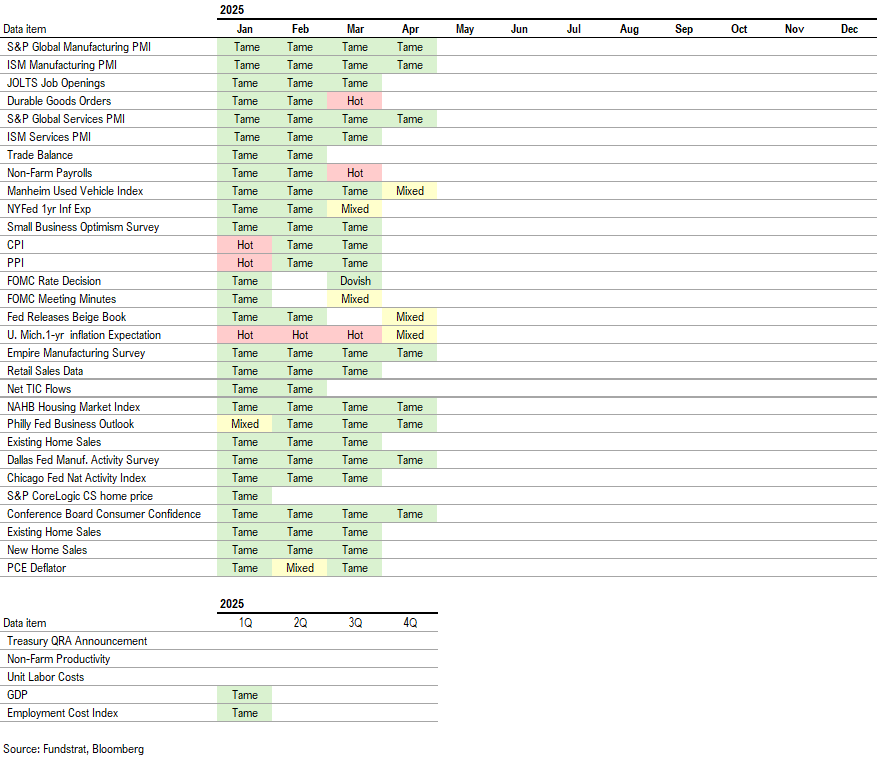
Economic Data Performance Tracker 2025:
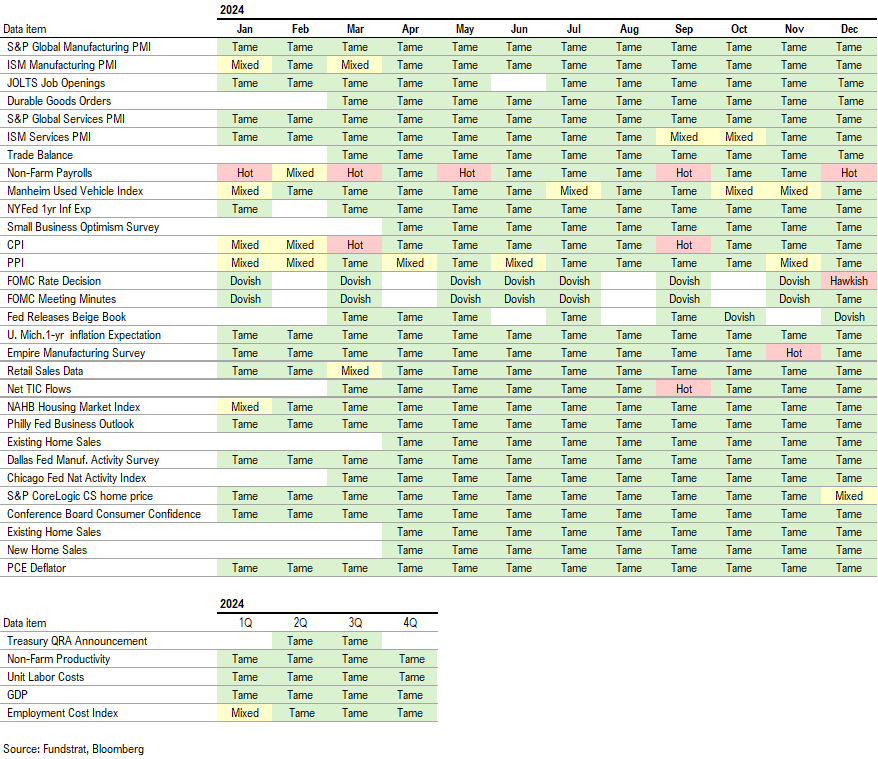
Economic Data Performance Tracker 2024:
Economic Data Performance Tracker 2023: