Click HERE to access the FSInsight COVID-19 Daily Chartbook.
We publish on a 4-day a week schedule:
Monday
Tuesday
Wednesday
SKIP THURSDAY
Friday
I will be on vacation from 1/17 to 1/25, a late Christmas vacation
– we will still publish our COVID-19 daily commentary (thanks tireless Ken)
– market commentary will resume 1/26
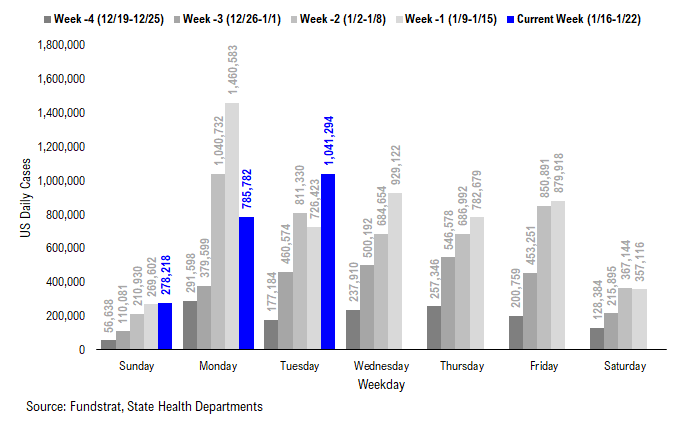
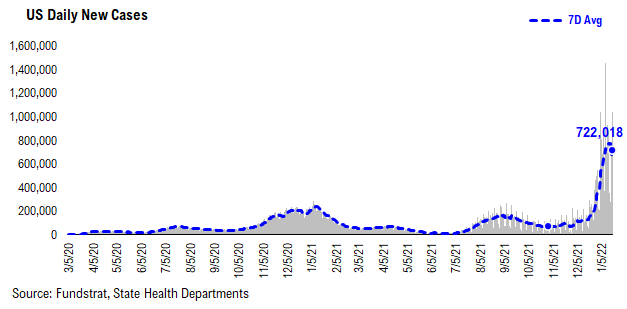
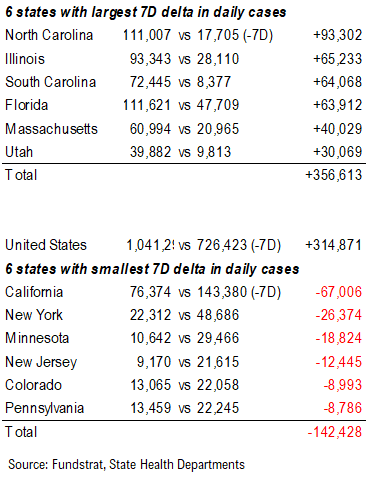
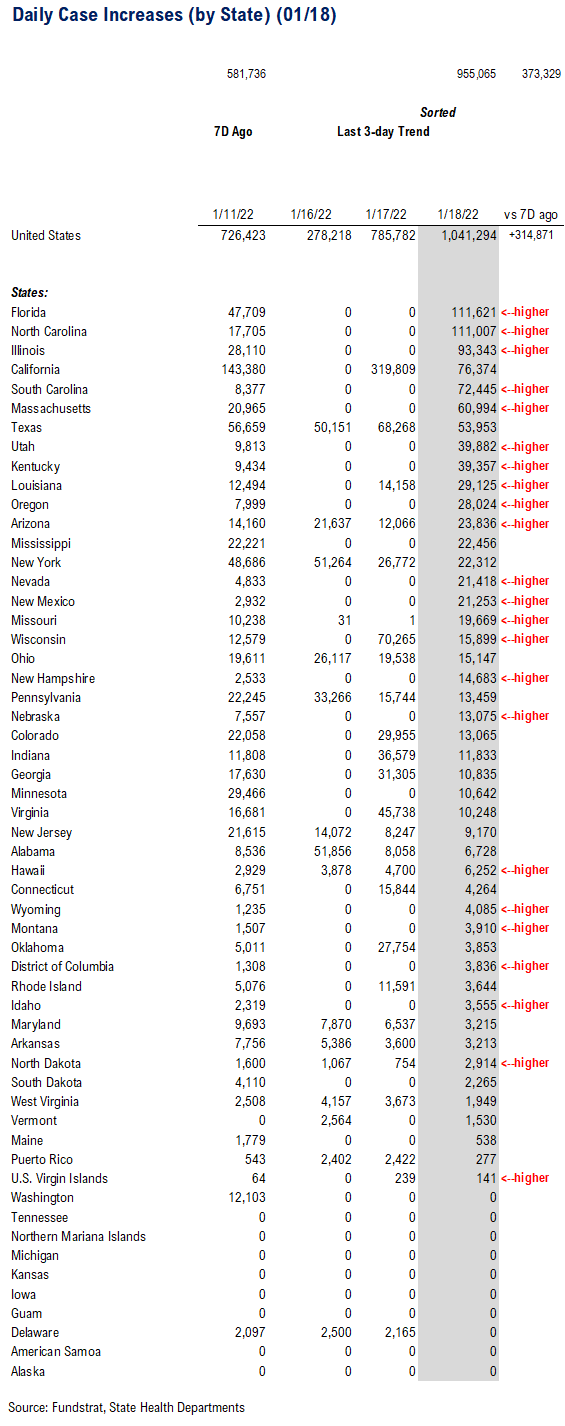
POINT 1: Daily COVID-19 cases 1,041,294, up +314,871 vs 7D ago…
Current Trends — COVID-19 cases:
- Daily cases 1,041,294 vs 726,423 7D ago, up +314,871
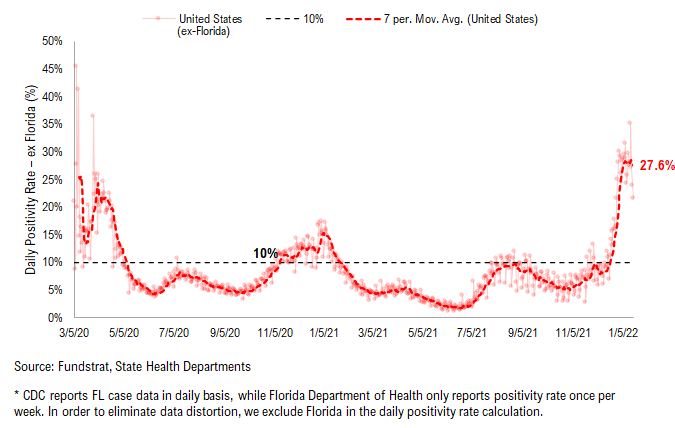
- 7D positivity rate 27.6% vs 28.1% 7D ago
- Hospitalized patients 148,499, up +5.0% vs 7D ago
- Daily deaths 1,753, up +6.0% vs 7D ago
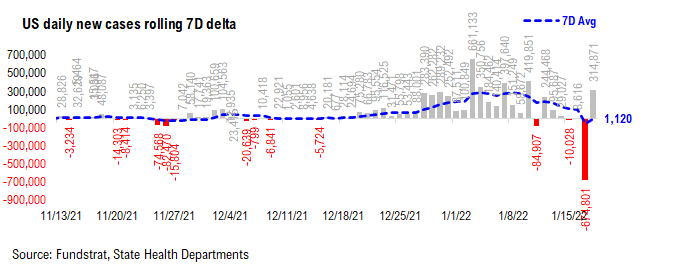
The Latest COVID daily cases came in at 1,041,294, up +314,871 vs. 7D ago. Due to MLK day, yesterday is the first time for many states to update their COVID dashboards since last Friday. Thus, yesterday’s big jump in the 7D delta was expected. The overall trend of 7D delta still looks encouraging as the 7D average line (less impacted by the daily data fluctuation) has plunged from the peak of nearly 300,000 to 1,120. This is consistent with what we have observed in many states (see the state table below where we track states with falling case figures). Recall that when the 7D delta turns negative, it means the trend in daily new cases “officially” turns downward. Therefore, we remain optimistic on the actual trend of COVID cases. The holiday data distortion effects will last a few days, so we will have a clearer view on the case trend next week, but we expect more states will see falling cases by then.
`
7D delta in daily cases is distorted due to the holiday closures…
Yesterday’s big jump (following yesterday’s big decline) in 7D delta was due to the data distortion. Despite the data distortion, we remain optimistic on the case trend and believe the decline in 7D delta in daily cases will persist. And as we noted previously, we should see the 7D average of 7D delta becomes negative in next 1-2 weeks, and it will signal the daily cases in US are in full retreat.
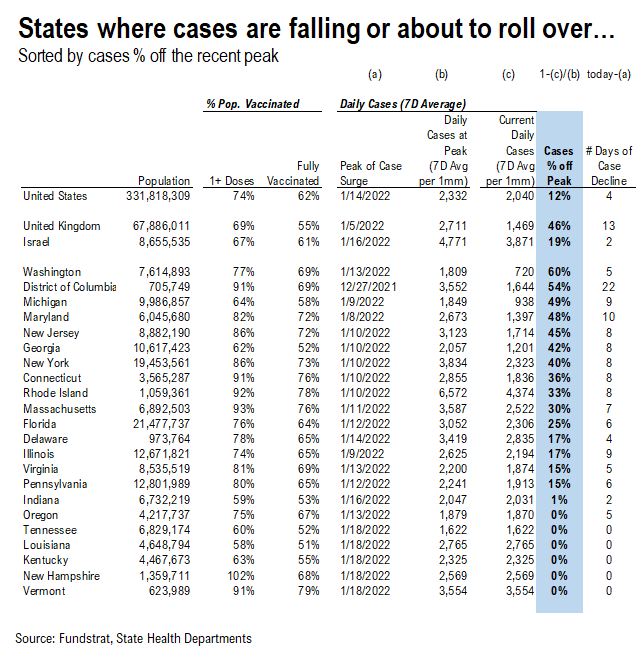
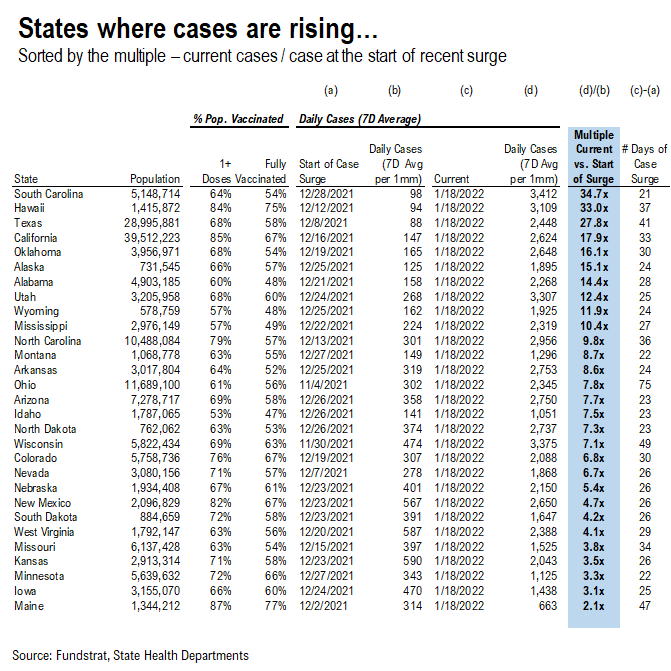
29 states are seeing a rise in cases while 21 states + DC are seeing cases falling or about to roll over…
*** We’ve split the “Parabolic Case Tracker” into 2 tables: one where cases are falling (or about to fall), and the other where cases are rising
In these tables, we’ve included the vaccine penetration, case peak information, and the current case trend for 50 US states + DC. The table for states where cases are declining is sorted by case % off of their recent peak, while the table for states where cases are rising is sorted by the current daily cases to pre-surge daily cases multiple.
- The states with higher ranks are the states that have seen a more significant decline / rise in daily cases
- We also calculated the number of days during the recent case surge
- The US as a whole, UK, and Israel are also shown at the top as a reference
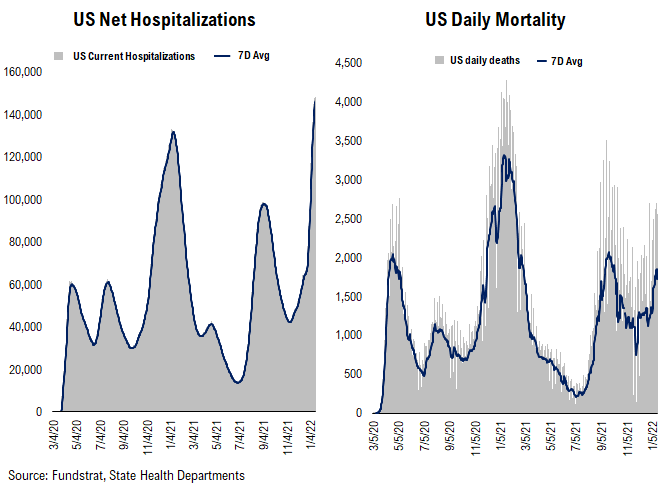
Hospitalizations and deaths are rising, while positivity rates seem to roll over now…
Below we show the aggregate number of patients hospitalized due to COVID, daily mortality associated with COVID, and the daily positivity rate for COVID.
- Net hospitalization just made a new time high recently. The good news is the daily mortality did not follow the same pattern as hospitalization which shows Omicron is less deadly compared to other variants (at least so far).
- Positivity rate climbed to nearly 30%, but looks rolling over now. But if the positivity rate remains high, it tells us that there might not be enough tests performed.
POINT 2: VACCINE: vaccination pace accelerates as boosters become more widely available…
Current Trends — Vaccinations:
- avg 1.2 million this past week vs 1.2 million last week
- overall, 24.4% received booster doses, 62.6% fully vaccinated, 74.4% 1-dose+ received
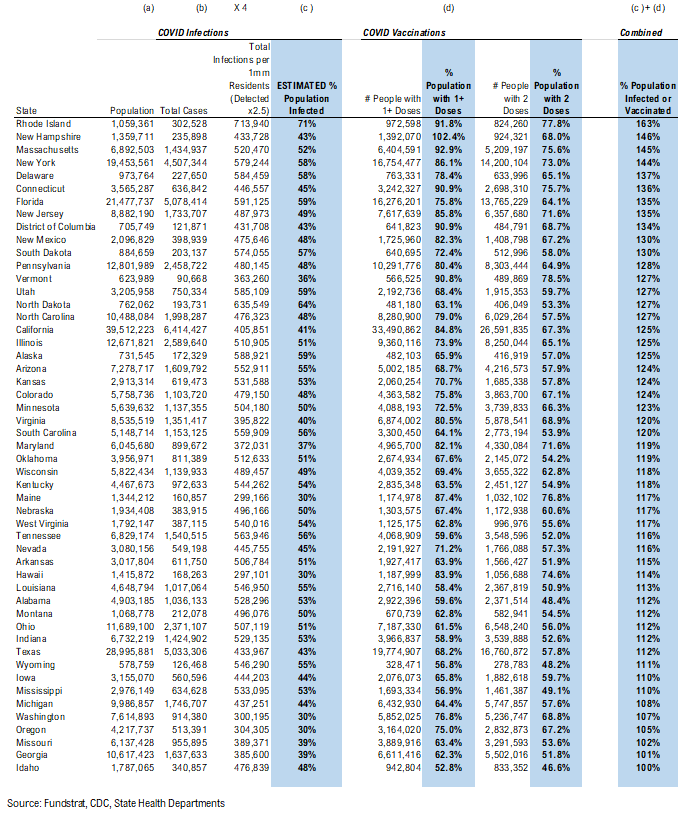
Vaccination frontier update –> all states now near or above 80% combined penetration (vaccines + infections)
*** We’ve updated the total detected infections multiplier from 4.0x to 2.5x. The CDC changed the estimate multiplier because testing has become much better and more prevalent.
Below we sorted the states by the combined penetration (vaccinations + infections). The assumption is that a state with higher combined penetration is likely to be closer to herd immunity, and therefore, less likely to see a parabolic surge in daily cases and deaths. Please note that this “combined penetration” metric can be over 100%, as infected people could also be vaccinated (actually recommended by CDC).
- Currently, all states are near or above 90% combined penetration
- Given the 2.5x multiplier, all states besides MS, WA, OR, TX, ID, MI, MO, and GA are now above 100% combined penetration (vaccines + infections). Again, this metric can be over 100%, as infected people could also be vaccinated. But 100% combined penetration does not mean that the entire population within each state is either infected or vaccinated
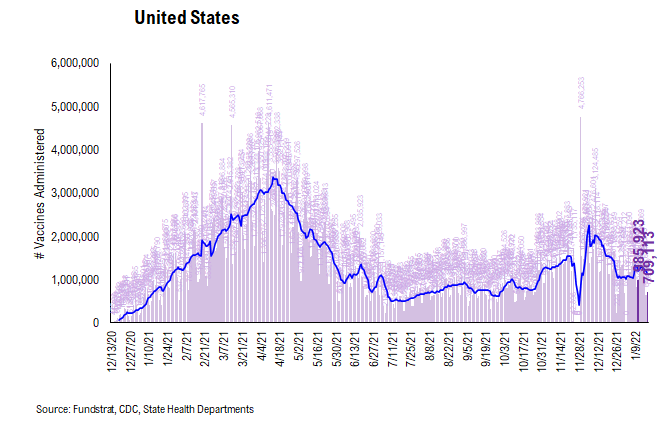
There were a total of 709,113 doses administered reported on Tuesday. Daily number of vaccines administered has been down over the past few days, but it is likely due to the MLK Day holiday. According to the latest CDC data, there were still more than 87 million people who are eligible for the booster dose, but have not received. Hence, to convince these people to receive their booster dose remains the key.
The daily number of vaccines administered remains the most important metric to track this progress and we will be closely watching the relevant data.
This is the state by state data below, showing information for individuals with one dose and two doses.
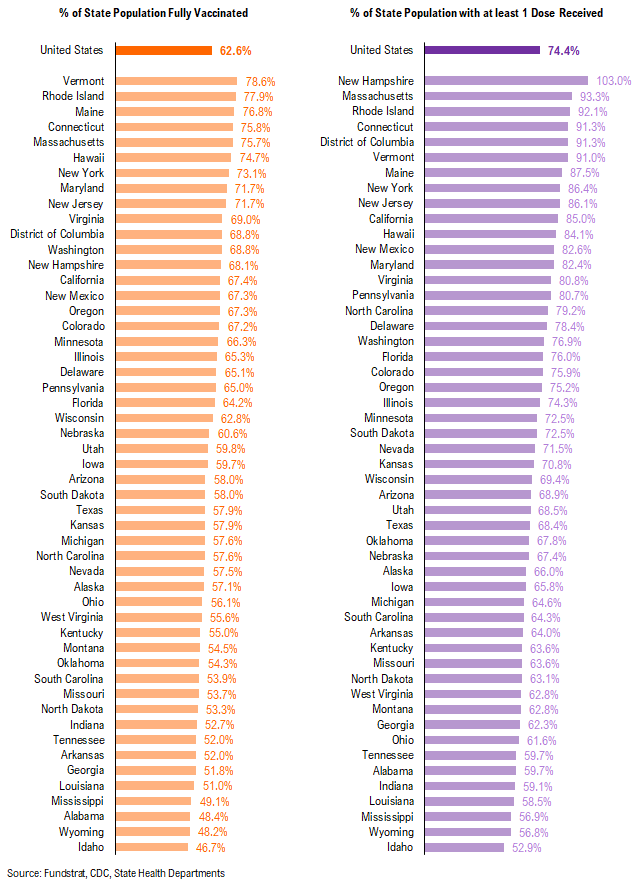
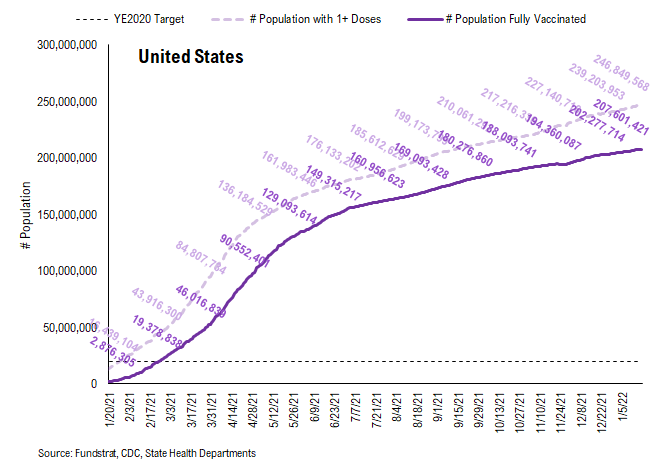
In total, 529 million vaccine doses have been administered across the country. Specifically, 247 million Americans (74% of US population) have received at least 1 dose of the vaccine. 208 million Americans (63% of US population) are fully vaccinated. And 81 million Americans (24% of US population) received their booster shot.
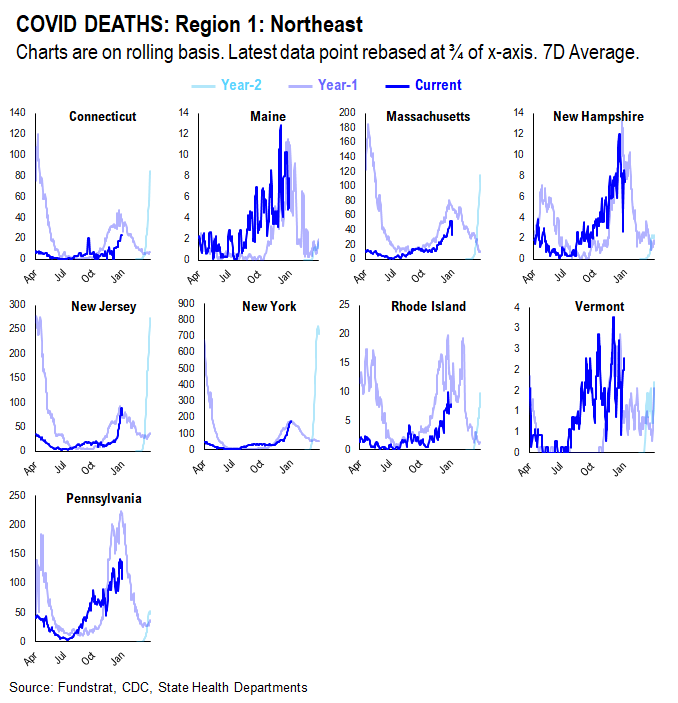
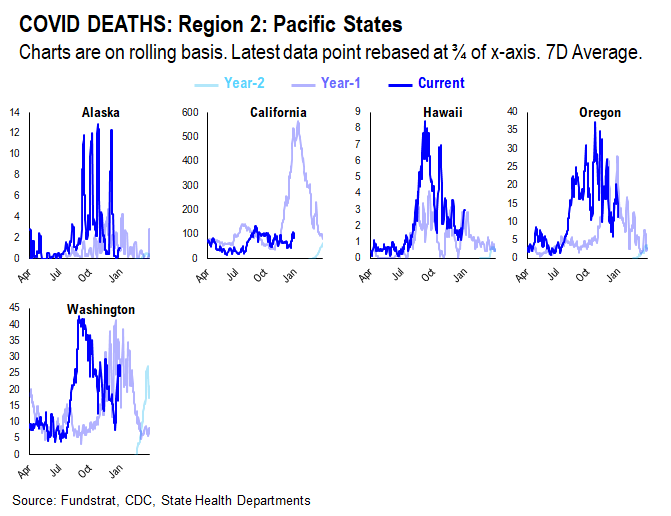
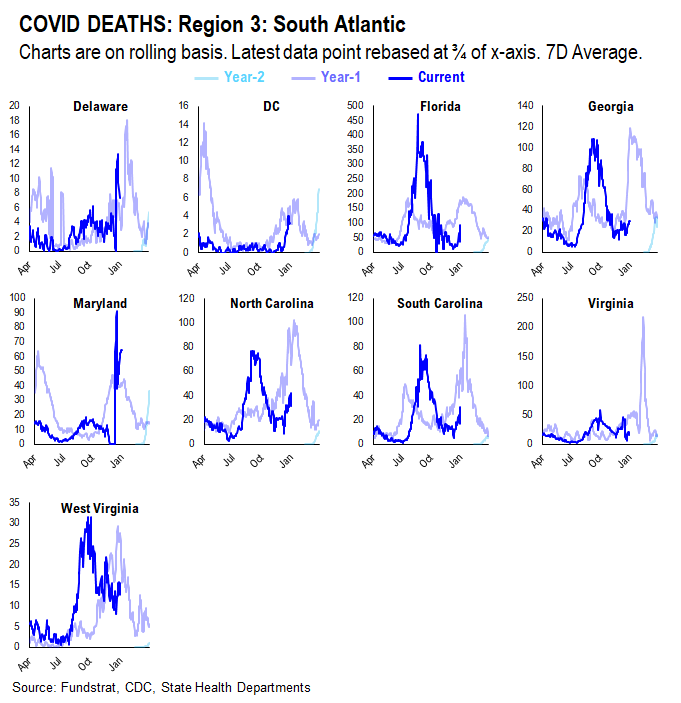
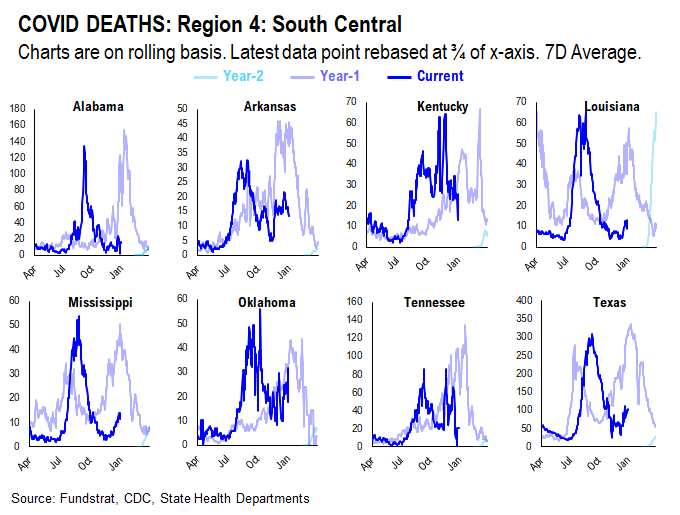
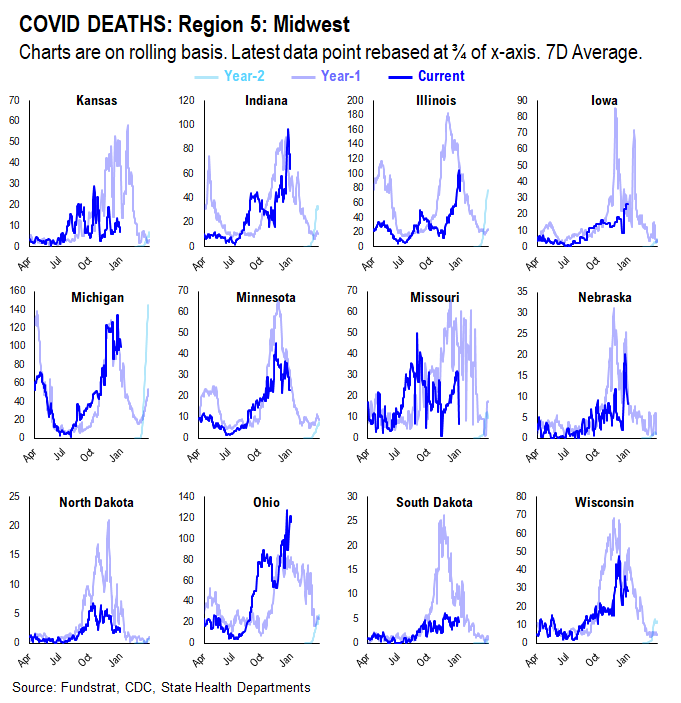
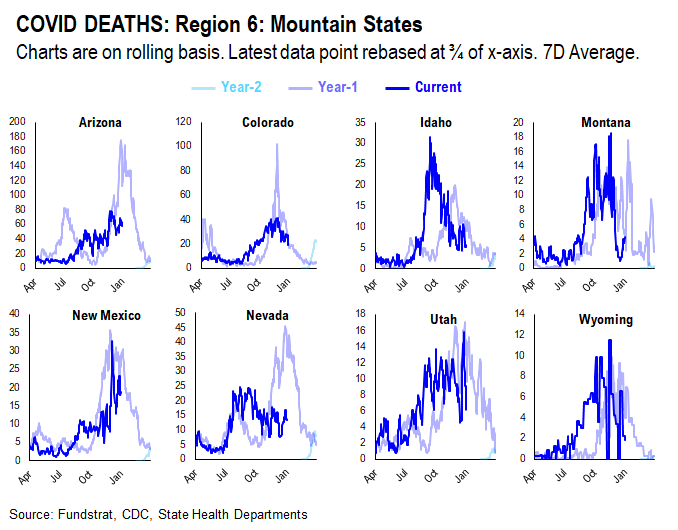
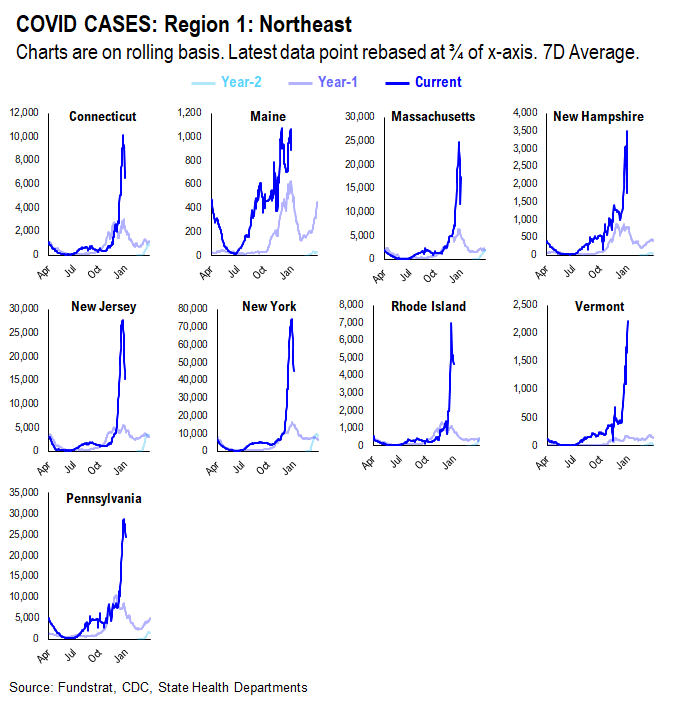
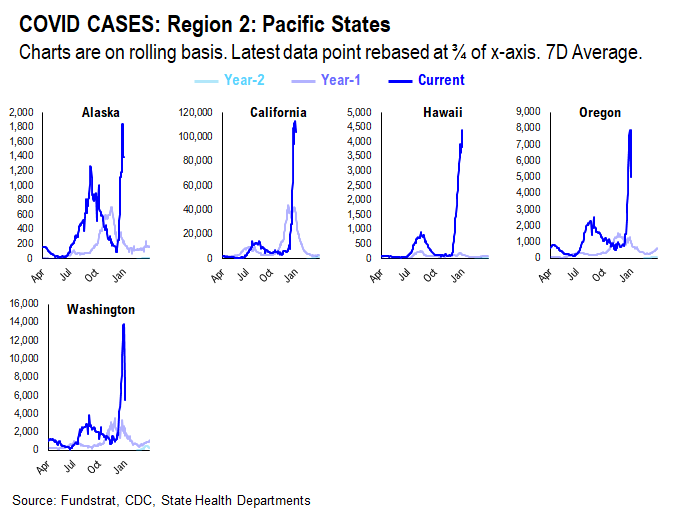
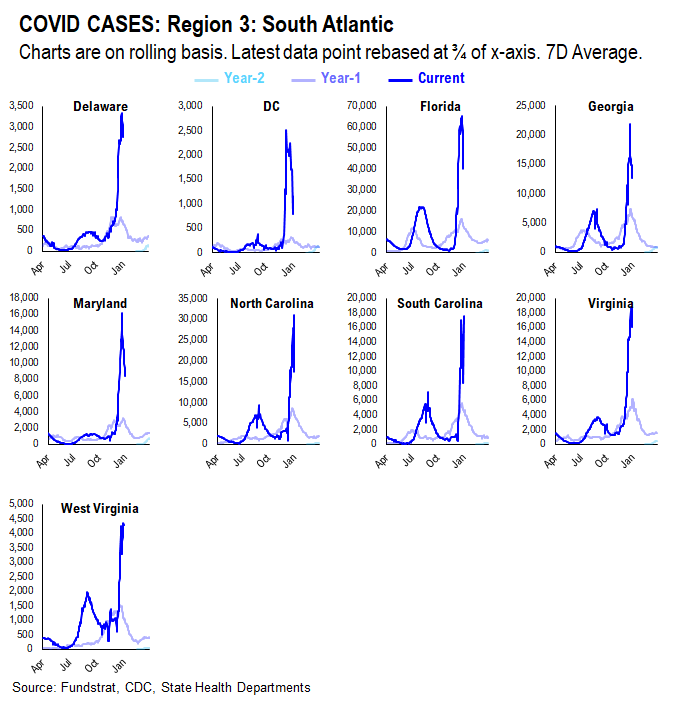
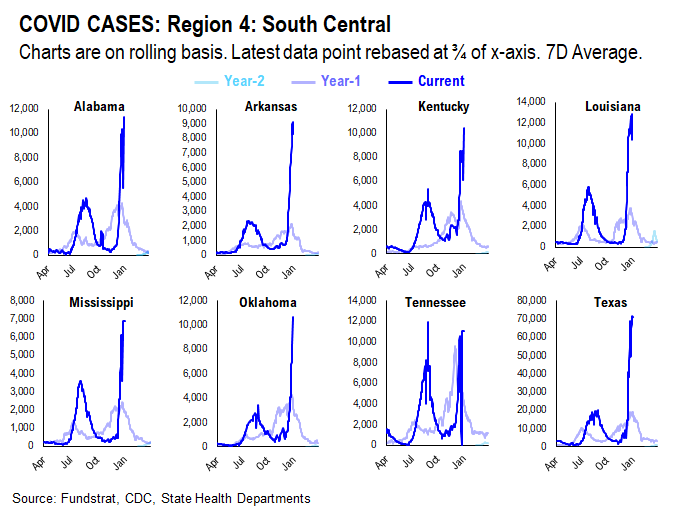
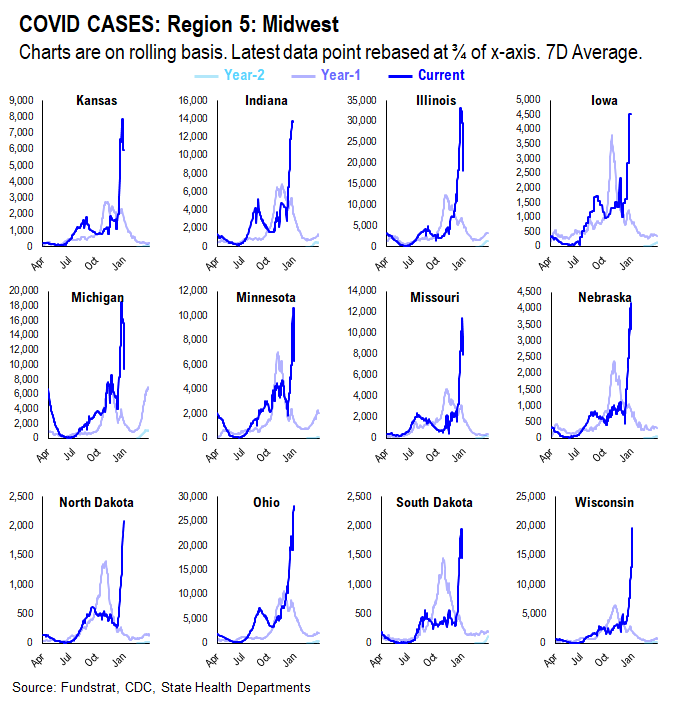
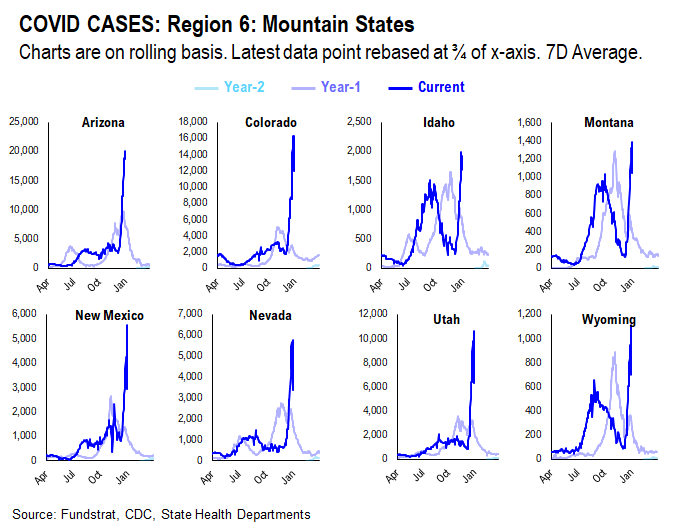
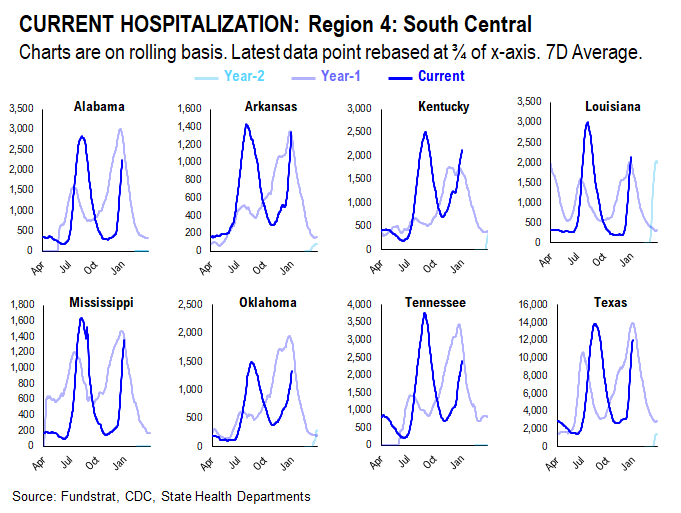
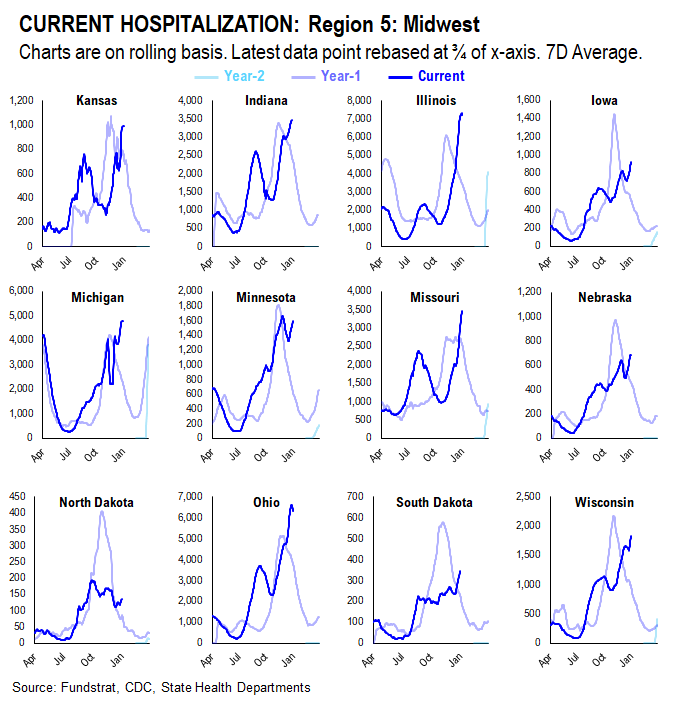
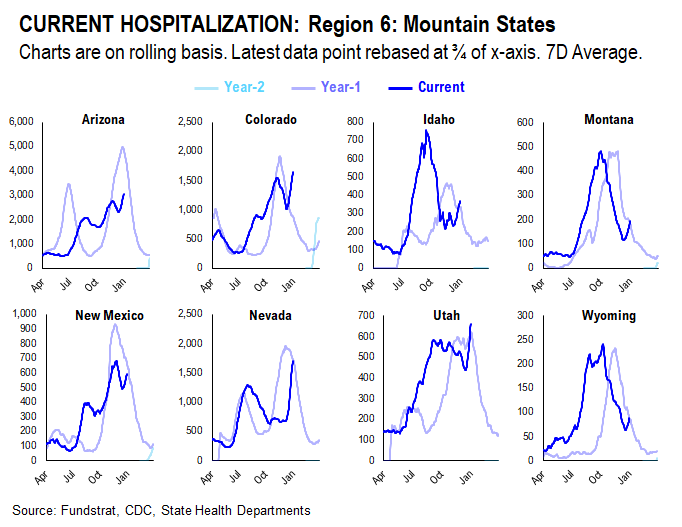
POINT 3: Tracking the seasonality of COVID-19
***We’ve updated the seasonality tracker to show figures from the last 9 months, from this calendar day, in each of the last two years***
As evident by trends in 2020 and 2021, seasonality appears to play an important role in the daily cases, hospitalization, and deaths trends. Therefore, we think there might be a strong argument that COVID-19 is poised to become a seasonal virus.
The possible explanations for the seasonality we observed are:
- Outdoor Temperature: increasing indoor activities in the South vs increasing outdoor activities in the northeast during the Summer
- “Air Conditioning” Season: similar to “outdoor temperature”, more “AC” usage might facilitate the spread of the virus indoors
- Opposite effects hold true in the winter
CASES
It seems as if the main factor contributing to current case trends right now is outdoor temperature. During the Summer, outdoor activities are generally increased in the northern states as the weather becomes nicer. In southern states, on the other hand, it becomes too hot and indoor activities are increased. As such, northern state cases didn’t spike much during Summer 2020 while southern state cases did. Currently, northern state cases are showing a slight spike, especially when compared to Summer 2020. This could be attributed to the introduction of the more transmissible Delta variant and the lifting of restrictions combined with pent up demand for indoor activities.
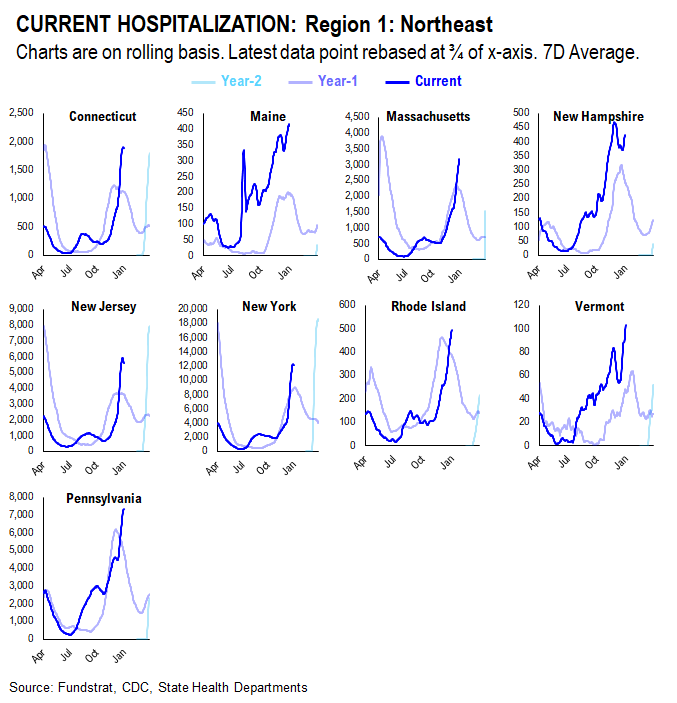
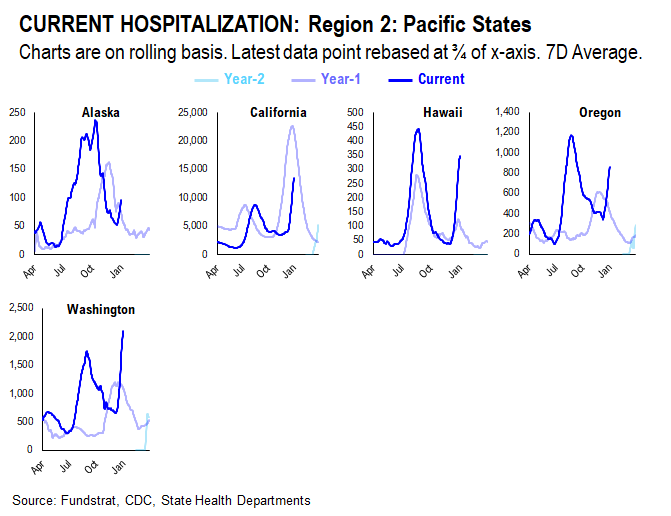
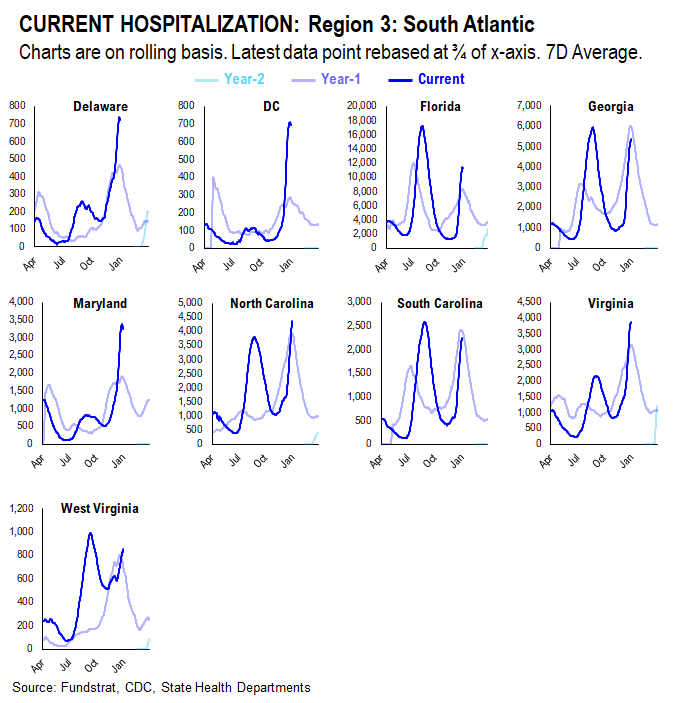
HOSPITALIZATION
Current hospitalizations appear to be similar or less than Summer 2020 rates in most states. This is likely due to increased vaccination rates and the vaccine’s ability to reduce the severity of the virus.
DEATHS
Current death rates appear to be scattered compared to 2020 rates. This is likely due to varying vaccination rates in each state. States with higher vaccination rates seem to have lower death rates given the vaccine’s ability to reduce the severity of the virus; states with lower vaccination rates seem to have higher death rates.