


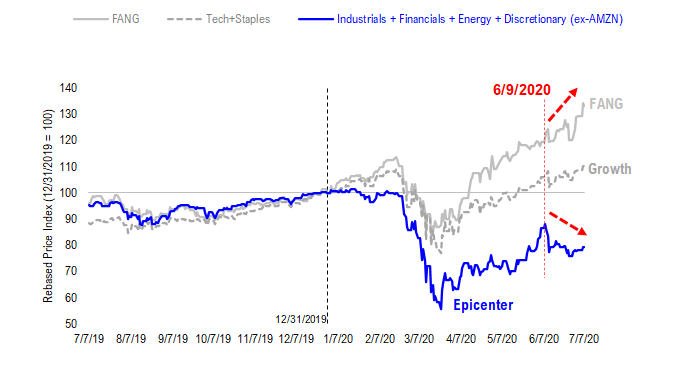
STRATEGY: Epicenter stocks struggled since June 9, exact day USA cases bottomed…
Despite equity markets making gains in the past few weeks, it has felt awfully “defensive” with FANG and secular growth stocks leading. In fact, as this chart below shows, this infection towards FANG started on June 9, 2020. So, this has been taking place for the past month.
Source: Fundstrat
I can think of multiple ways to explain this leadership:
– “momentum” strategies favor what is working
– bond proxy driven, as cash from sidelines buys stocks most like bonds
– FANG/Growth are “succeeding” during this pandemic, so valuation expands further (very true)
– markets are getting worried about a contested election/Biden, so it is becoming defensive
– markets are getting worried about COVID-19, so it is becoming defensive
– markets are getting worried risk of no vaccine/cure, so it is becoming defensive
The latter two explanations resonate with me, partly because this is my sense from speaking with clients. The data for COVID-19 is not decisive, because cases are going up, but deaths are down. And as for vaccine/cure, there are many “shots at goal” but mostly just further progress.
– daily cases bottomed on 6/9/2020, before rising
– the peak in “epicenter” performance was 6/9/2020
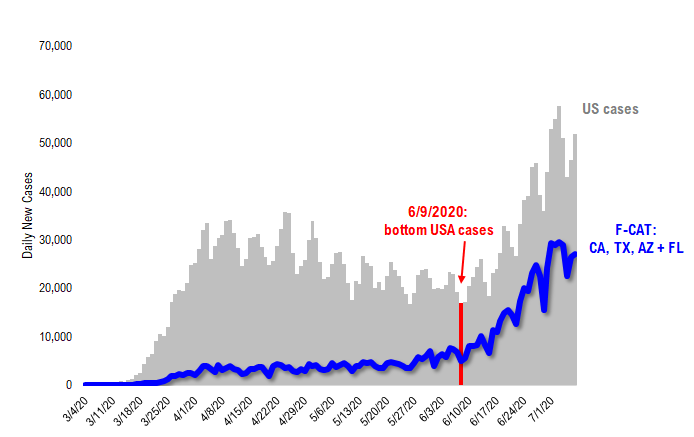
Source: Fundstrat, COVID-19 Tracking Project
So I am in the camp that cyclicals/epicenter stocks have suffered from COVID-19 anxiety. And thus:
– peak in F-CAT will be viewed as a binary event, leading to rotation into cyclicals
– development of a cure/vaccine is a binary event, leading to a rotation into cyclicals
In short, Epicenter stocks/ Cyclicals are awaiting confirmation of F-CAT peak, which is close (or a cure)…
And under this framework, the weakness in cyclicals is a reflection of the market’s growing skepticism of either. After all, I am pretty sure a cure will happen. And as we discuss below, I am 80% sure TX peaked and it is a matter of time before the rest of F-CAT peaks. Moreover, there are other instances of state’s opening safely, such as Arkansas.
So the risk/reward for Cyclicals strikes me as favorable.
The US government “Operation Warp Speed” is seeding many efforts at a vaccine. The explicit goal, as highlighted below, is to have 300 million doses of a vaccine available by January 2021. This is what Dr. Fauci refers to frequently and what Scott Gottlieb references, when he speaks of “fairly confident of a vaccine by early 2021”
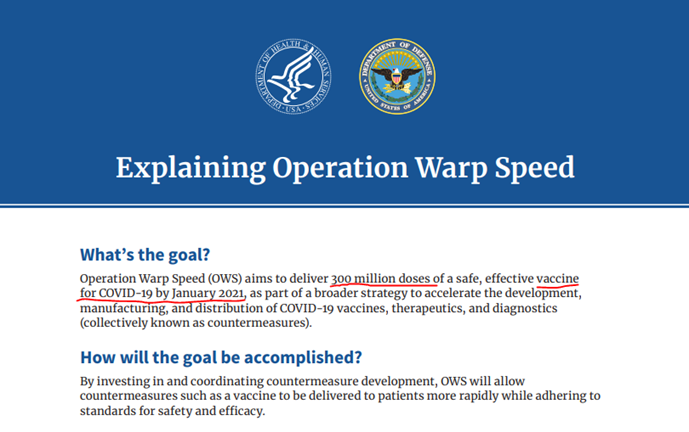
https://www.hhs.gov/about/news/2020/06/16/fact-sheet-explaining-operation-warp-speed.html
In fact, Novavax today was awarded $1.6 billion to speed its vaccine, the largest such grant to date. There have been a total of 6 companies receiving money and this is the largest to date.
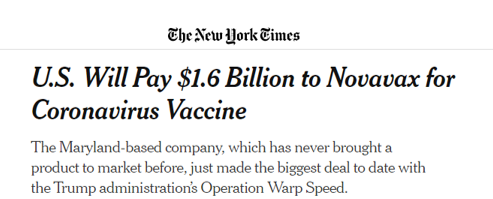
https://www.nytimes.com/2020/07/07/health/novavax-coronavirus-vaccine-warp-speed.html
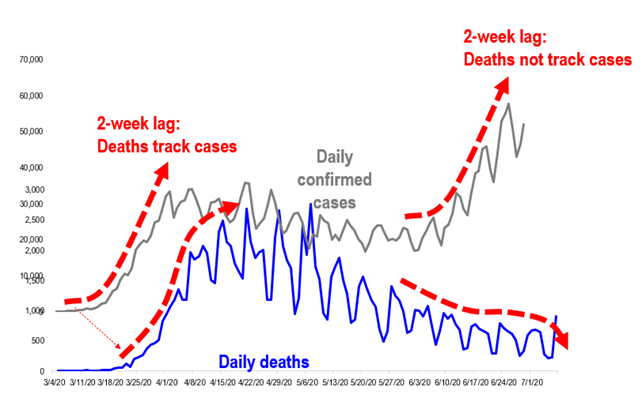
Incidentally, we believe this divergence between cases and deaths remains bifurcation from a market perspective. Those skeptical say this is just a matter of time before deaths surge. But as we highlight on the left side of the chart, there was a two-week lag between cases and deaths.
– so far, cases have surged >4 weeks
– deaths continue to fall
Source: COVID-19 Tracking Project
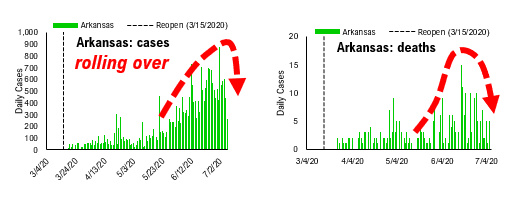
And Arkansas has faded from the public dialogue. But notice how this state’s cases are rolling over and deaths rolling over. And yet, the state did not roll back its economic opening. So, this is a posterchild that states can remain open safely. Sometimes the exceptions prove the rule, or rather, prove the alternative rule.
Source: COVID-19 Tracking Project
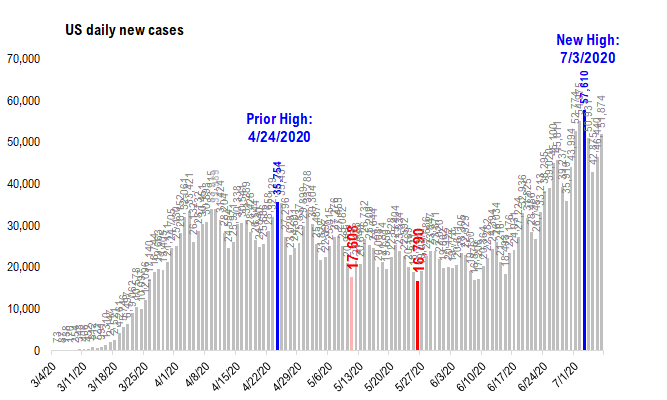
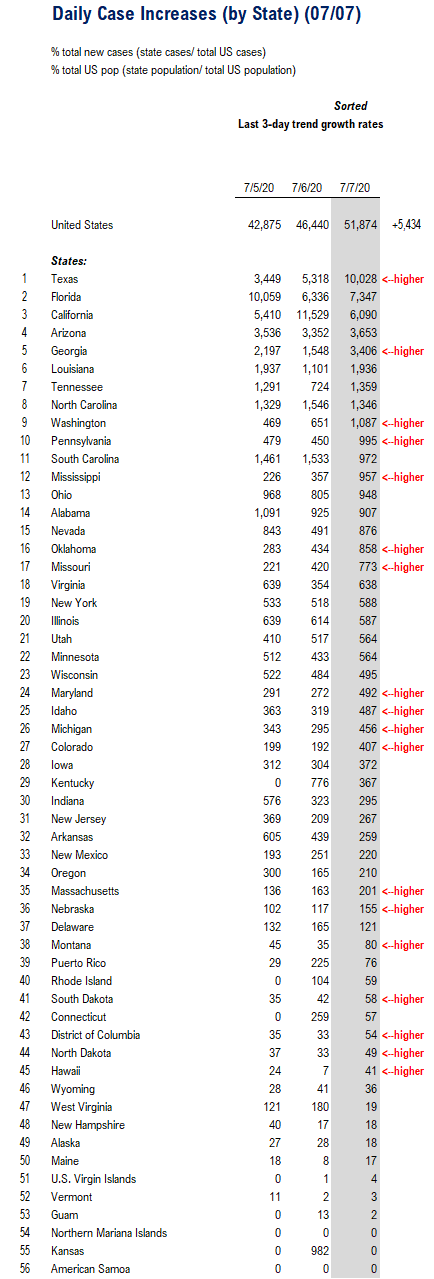
POINT #1: Daily cases rise to +51,874 (+5,434 vs 1D ago) due almost entirely to TX
Daily cases rose today to 51,874 and while not as high as the 57,800 seen on Saturday, this pace of new cases is certainly a new plateau compared to the daily case growth seen prior to Memorial Day. The rise in reported cases today looks to be a case of “weekend effect” catching up to Texas. We discuss this more fully below (next section) but:
– Houston cases still 40% off the peak seen on 6/23/2020 and Austin and San Antonio did not report “new highs”
– 186 counties in TX reported zero cases over the weekend and +4,574 today
– This seems like a weekend effect to us.
So we believe there remains >80% probability Texas cases have already peaked.
Source: COVID-19 Tracking Project
When we look at the states reporting sizable changes (1D), we can see this churn. Texas reported a big “true-up” while CA’s “true-up” from Monday is fading. I hope the US and F-CAT, in particular, can bring cases downwards ala NY tri-state, but this is not something we can be that certain of.
6 states reported a sizable increase
Texas 10,028 vs 5,318 (1D) +4,710
Georgia 3,406 vs 1,548 +1,858
Florida 7,347 vs 6,336 +1,011
Louisiana 1,936 vs 1,101 +835
Tennessee 1,359 vs 724 +635
Mississippi 957 vs 357 +600
Total 6 states +9,649
6 states reported a sizable decline in cases
California 6,090 vs 11,529 (1D) -5,439
South Carolina 972 vs 1,533 -561
Kentucky 367 vs 776 -409
Connecticut 57 vs 259 -202
North Carolina 1,346 vs 1,546 -200
Arkansas 259 vs 439 -180
Total 6 states -6,991
Source: COVID-19 Tracking Project
To “seasonally” adjust this data, it is sometimes helpful to compare the 1D confirmed cases with the same day a week ago. This chart below looks at 7D change in daily cases. And this chart highlights that this recent surge in cases (7D change) seems to be slowing. This is a good development.
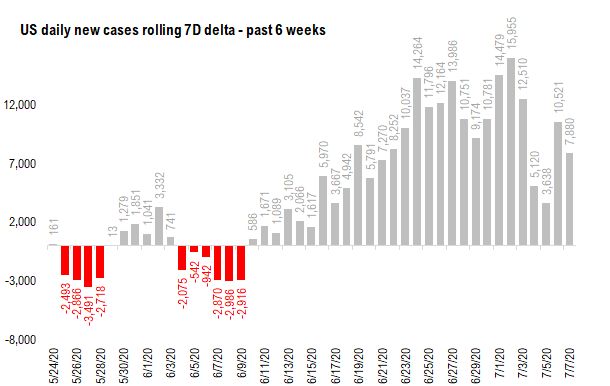
Source: COVID-19 Tracking Project
The trends in both gross hospitalizations and net hospitalizations remains mostly better than expected — to the extent these are not surging similar to what we saw in March/April. But hospitalizations are on the rise. And rising hospitalizations is not a good trend, as these are the severe cases of COVID-19 requiring hospitalizations. And rising hospitalizations lead to rising ICU and ultimately deaths.
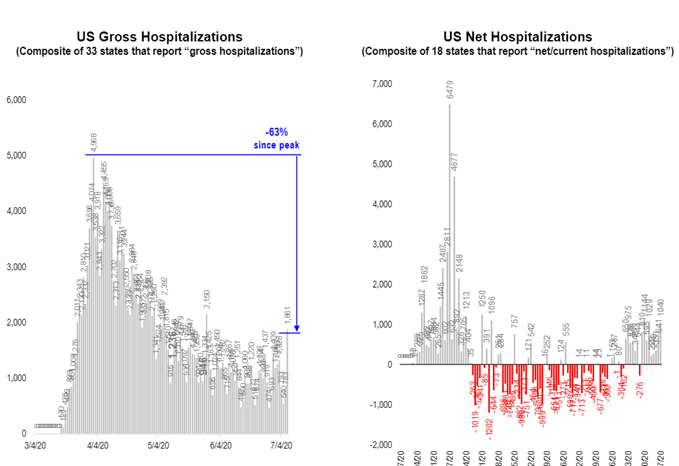
Source: COVID-19 Tracking Project
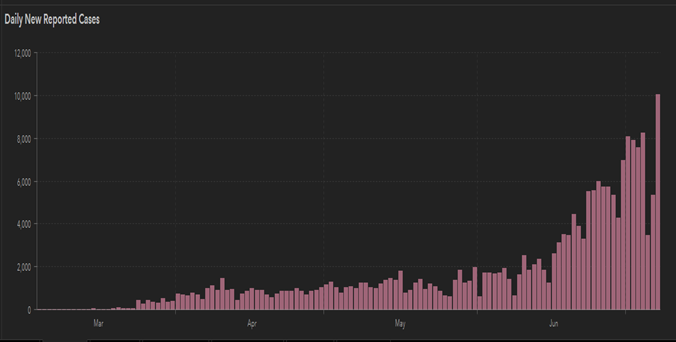
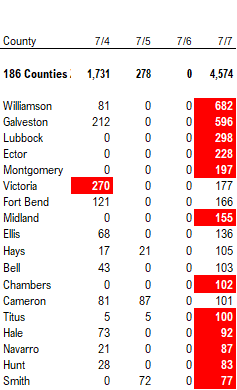
POINT #2: TX “new high” due to 186 counties reporting 0 cases 1D ago and +4,574 today
We believe >80% probability TX daily cases have already peaked, despite “new high” reported in confirmed cases today
Texas reported a new high in daily cases today of 10,028, and while this is a “new high,” we think this is not a surge in new cases. Here is why:
– Houston, the leading edge, daily cases were 1,179 (up from 1D ago) but still down from 1,994 peak on 6/23
– Austin, San Antonio did not report a new high in cases
– 186 counties which reported ZERO cases in the past few days reported +4,574 today.
– Ex-those 186 counties, daily cases would have been 5,454, or flat with 1D ago
In other words, we believe TX surge today is a backlog of tests for counties which were closed over the 4th of July weekend.
Source: TX DSHS
Even as Texas reported >10,000 cases today, Houston 40% off 6/23/2020 high of 1,994… 5 of 10 largest counties off highs
The 10 TX counties with the largest number of daily confirmed cases are shown below and these are the counties (for the most part) that we have been tracking. Note how 5 of the 10 did not report “new highs” in cases, despite the record reported cases:
– Houston peaked on 6/23 -41%
– Austin peaked on 6/28 -66%
– Corpus Christie on 7/2 -20%
– San Antonio on 7/4 -73%
– Odessa on 7/4 -52%
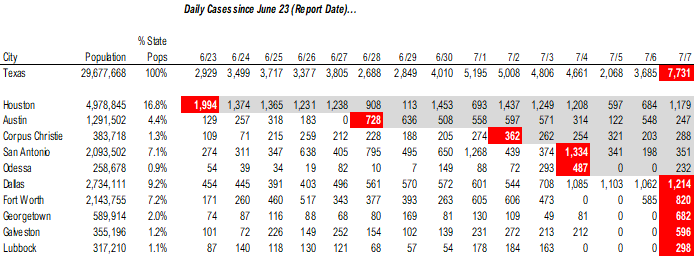
Source: TX Health Dept
186 counties with ZERO cases in past few days reported +4,574 cases… 4th of July weekend effect?
And you can see the numerical values above. Testing certainly has surged in TX in recent days. Thus, the surge seen is from counties which previously reported few cases such as Georgetown, Galveston and Lubbock.
– 186 counties reported zero cases in past few days
– These 186 reported 4,574 cases today
In other words, this is not a massive surge but it looks like a “true-up” from a backlog of tests.
Source: TX health dept.
We believe these smaller counties may have not collected or tested samples over the weekend. So Monday’s results (reported today) showed this huge backlog of 4,574 new cases.
The bottom line, we think the fact that Houston cases have peaked is a sign that Texas cases are about to peak.
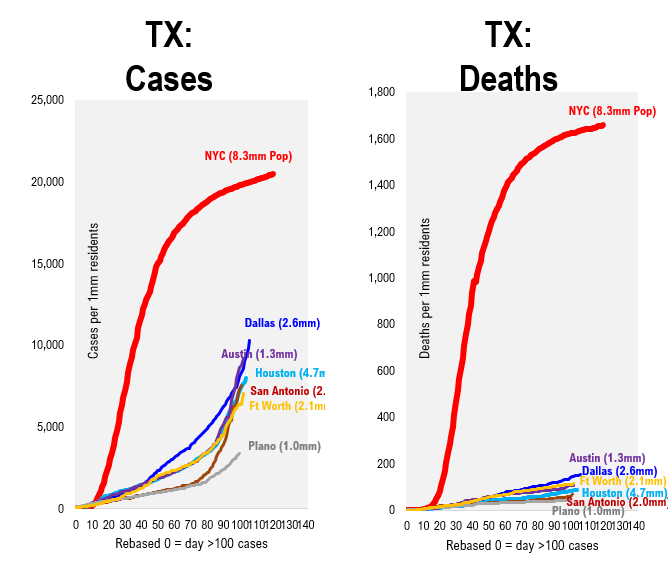
Texas cases and deaths per 1 million residents is vastly lower than NYC…
Another important perspective is to look at TX cases and deaths per 1mm residents compared to NYC. This comparison is shown below and we “rebased” the data to the time each county reported 100 cases.
– TX cases are far far lower than NYC at the moment. This is both a good and a bad thing
– It is good in the sense that COVID-19 is not as vastly spread. But it is bad if COVID-19 prevalence ultimately matches NYC
– But notice how the death curves are so different. Despite higher relative case prevalence, deaths remain much lower
This is consistent with Texas officials commenting that the cases are not as severe for the state, compared to what was seen in the Northeast.
Source: Johns Hopkins
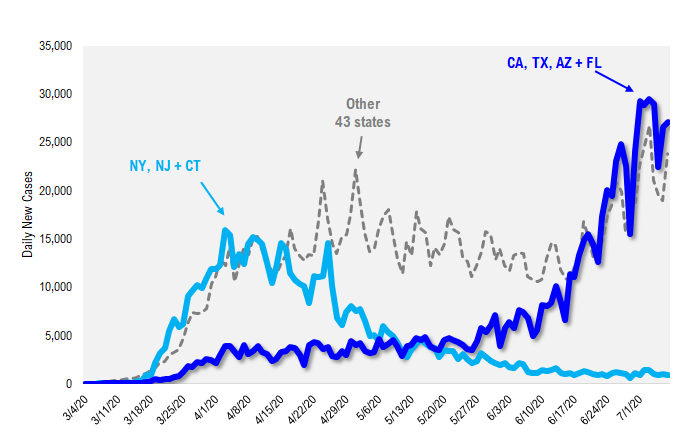
POINT #3: F-CAT examining divergence between cases and deaths vs NY tri-state…
The new US epicenter for COVID-19 remains F-CAT (FL, CA, AZ, TX) and these 4 states account for more cases on a daily basis than the other 43 states combined. And as we commented and in recent notes, we believe:
– TX peaked with >80% probability
– AZ peaked with >60% probability
– FL peaked with >50% probability
Source: COVID-19 Tracking Project
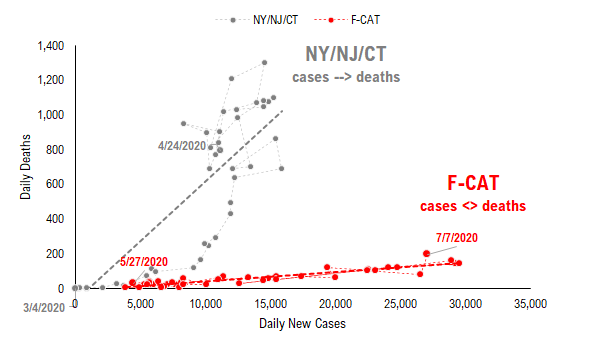
But what has distinguished this new epicenter from the prior NY tristate (NY/NJ/CT) is the far lower severity of the cases, whether measured in hospitalizations or in deaths. To appreciate this difference, take a look at the chart below:
– X-axis is daily cases
– Y-axis is daily deaths
– We can see the steep death curve versus cases. This contributes to the high mortality rate seen in NY tristate
– By contrast, F-CAT has seen more daily cases (vs NY tristate at its peak) but far fewer deaths.
– F-CAT death curve is much flatter as well.
Source: COVID-19 Tracking Project
Even at the county level, we can see case prevalence matching that of NYC within F-CAT
We have plotted the cases per 1mm residents for each F-CAT state and included the hardest-hit counties. The data is rebased to day 0 = 100 cases:
– Miami is matching NYC for case prevalence (total confirmed cases per 1mm residents)
– Imperial County in CA has blown past NYC by a factor of 2X
– AZ border counties of Santa Cruz and Yuma have blown past NYC
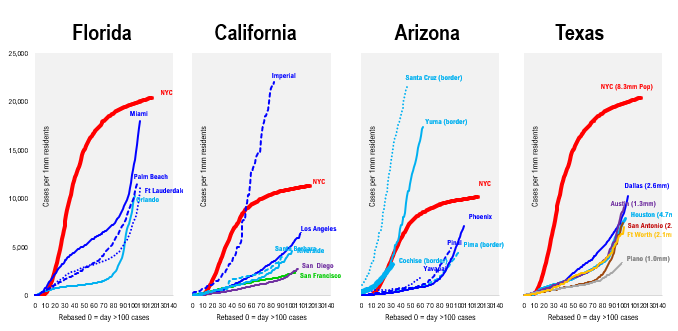
Source: Johns Hopkins
We would naturally expect those counties, which exceed NYC prevalence, to report similarly higher deaths per 1mm residents. But this is not the case. These charts below are the same states and counties but plotting deaths per 1mm residents.
– None of the states have seen deaths per 1mm residents match NYC
– None are even close
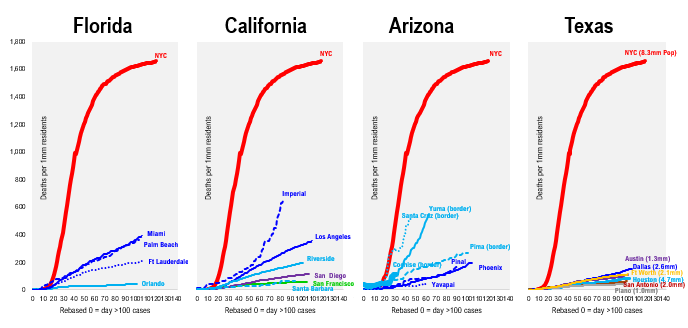
Source: Johns Hopkins


