


COVID-19 remains a global crisis and we realize that many people need to keep up with COVID-19 developments, particularly since we are moving into the more critical stage (“restart economy”), so feel free to share our commentary to anyone who has interest.
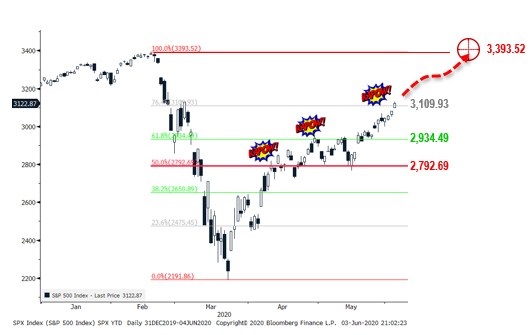
The S&P 500 reached new cycle highs today, closing at 3,122.87, the highest close post-COVID-19 and also clearing a key 76% retracement level (3,109.93). The next real battle line, as shown below, is 3,393.52, or all-time highs. The weakening of USD (past week), solid recovery in oil, further fall in VIX point to a growing constellation of financial indicators confirming the rise in equity prices. And given the mountain of dry power ($5T money market + $2T private equity + $1T corp net raise), there is a lot of capital that could be buying corporate equities if the economic recovery gains traction. Hence, the market, in our view, remains in the hands of buyers.
Tonight, the Senate passed a bill easing restrictions and essentially improving the PPP program. Under the bill, small biz only needs to spend 60% on payroll (75% prior) and could use funds for six months (vs 2 months). And per CNBC, the deadline to rehire has been extended past June 30th and could get loan forgiveness to defer to payroll taxes. This policy change makes it easier for small businesses to leverage the program and is overall positive.
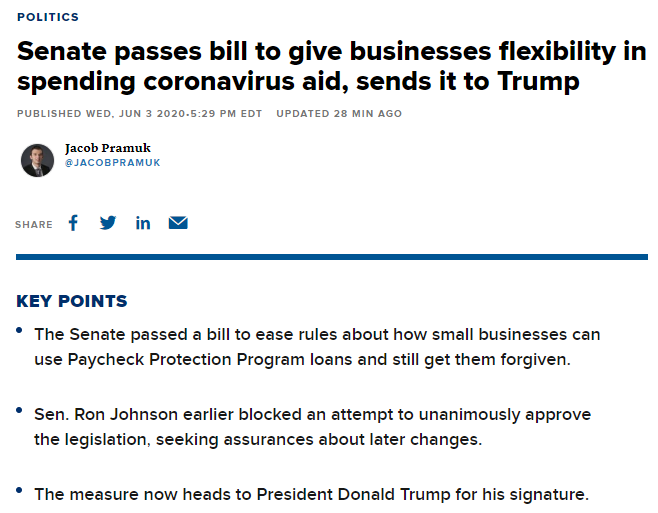
https://www.cnbc.com/2020/06/03/sen-ron-johnson-blocks-ppp-small-business-loan-legislation.html
“social distance victim” surge today, still saying no second wave due to protests, and epi-center gain, affirming “less barbell”
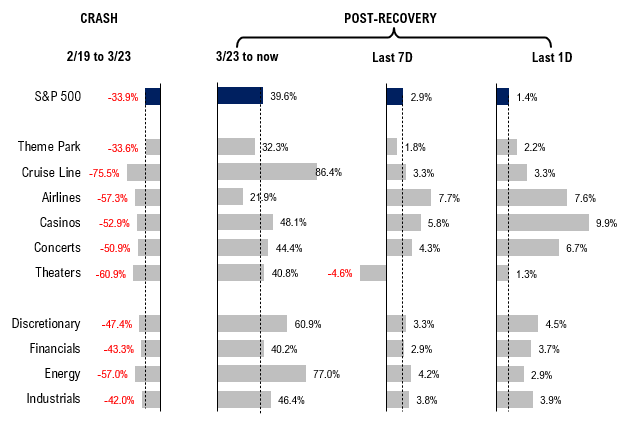
There is no fundamental explanation for the 1.4% rise in equities today, and perhaps VAR re-positioning (on lower VIX?) but what was notable is the surge in “social distance victim” groups (theme parks, cruise lines, casinos, airlines, etc.) with a massive 10% gain in casinos today and 7.6% surge in airlines. We are tracking the social distance victim stocks to use a barometer for second wave risk, stemming from the protest. The fact remains, the COVID-19 timeline is broken. The protests now spread to >350 cities and towns in the US as massive super spreader events, and have seeded the potential for a massive second wave. These social distance stocks should be seen as a leading indicator, as heightened risk (measured as cases) would hurt these stocks badly. But so far, these stocks are saying no second wave.
Source: Fundstrat
The “epicenter” sectors are still leading (Discretionary, Financials, Energy and Industrials) in the past few days and last week and since 3/23/2020. These sectors only represent ~25% of the S&P 500 market cap, but we believe could be 62% of the points gained in the S&P 500 attains all-time highs (ATH) — hence, we advocate “less barbell” and OW epicenter sectors.

In this commentary, we also highlight how a “socially distant” American is going to use a lot more gasoline. Hence, we think there may be a real structural argument to OW Energy. The future is uncertain, but this is something to keep in mind.
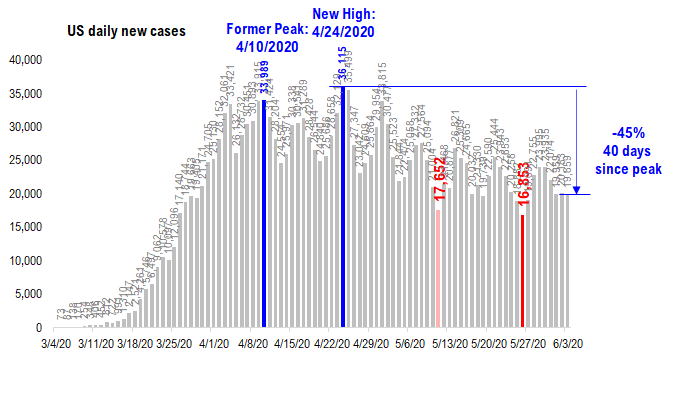
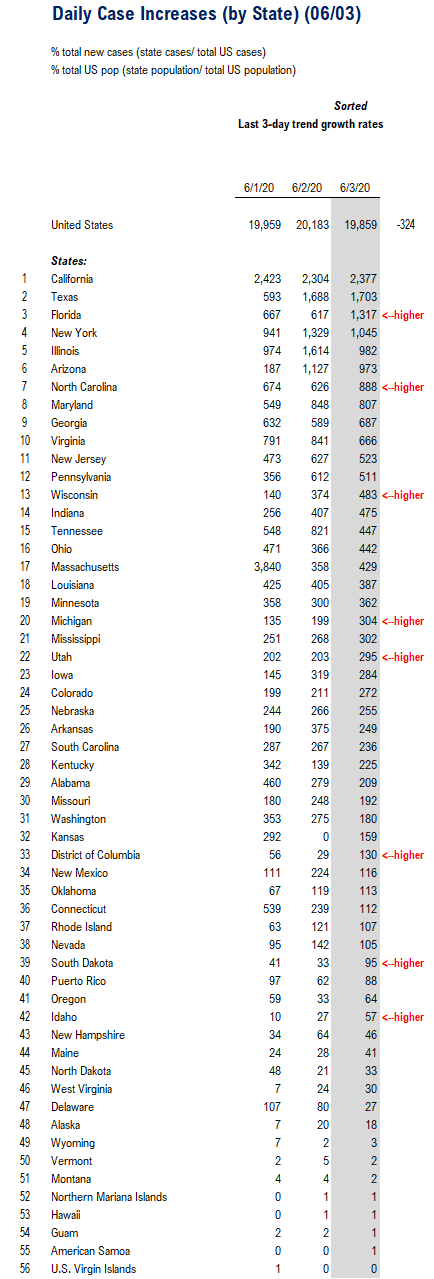
POINT #1: USA daily cases steady at 19,859 vs 20,183 1D ago. Florida sees a surge.
The daily case figures for USA have held steady in the past 3 days, with quite a lot of churn. The relative constant is the CA is now the state with the highest number of daily cases and NY has slipped to #4 consistently after being #1 for most of this crisis.
Source: COVID-19 Tracking Project
There remains the usual churn but what is unusual is Florida, the only state with a meaningful rise, with cases +700 vs 1D ago.
States with large 1D rise:
Florida 1,317 vs 617 (1D) +700
6 states with large 1D decline:
Illinois 982 vs 1,614 (1D) -632
Tennessee 447 vs 821 -374
New York 1,045 vs 1,329 -284
Virginia 666 vs 841 -175
Arizona 973 vs 1,127 -154
Connecticut 112 vs 239 -127
Total 6 states -1,746
Source: COVID-19 Tracking Project
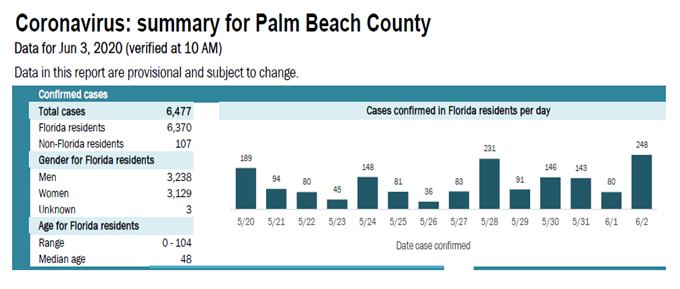
Palm Beach County reported the largest 1D rise in Florida… +168 of the +700
Florida provides a daily report by county of cases. And the county with the largest 1D rise is Palm Beach county.
Source: FL health dept
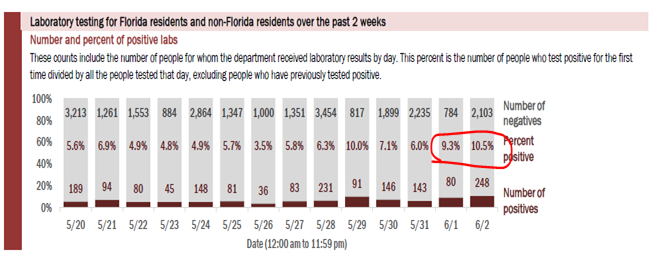
And positivity rates in Palm Beach have ~10% for the past few days, well above the ~6% of the US overall. So, it does seem like Palm Beach is seeing an escalation of case growth as well.
Source: FL Health dept.
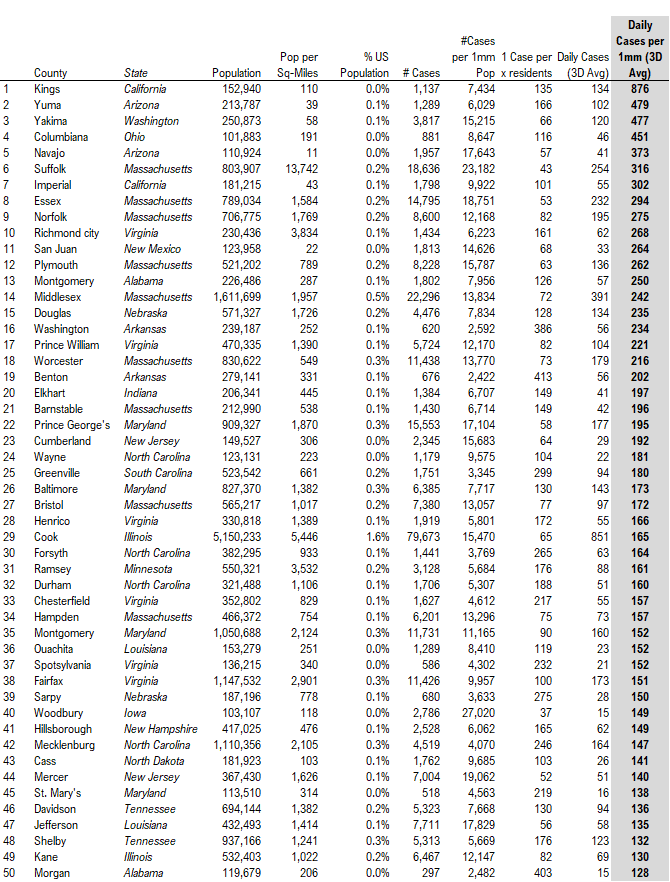
POINT #2: County-level data shows some many large counties with daily cases >200 per 1mm, about 4X the USA avg of 50
It has been a few weeks since we provided some county-level data. Below are the 50 counties with the highest daily cases per 1mm residents (3D avg). The US is about 50 per 1mm residents. The lowest figure (#50) is 128 per 1mm residents. So, these counties are seeing case growth well above the national average.
– Topping this list are CA and AZ counties and a number of “hotspots” in Massachusetts (explain below).
– The highest is Kings County, CA with 876 daily cases 1mm residents, or 18X the USA average, followed closely by Yuma, AZ with 479.
– Suffolk, MA still has daily cases of 316 per 1mm resident, which is about 6X the US average. There are also Suffolk, Essex, Norfolk, Plymouth, Middlesex and Worcester. Many counties in MA. But the high daily cases in MA counties were largely because of the “retrospective review” that revised the total cases up on Monday (6/1).
The overall impression I have is that the “imported” cases along the US-Mexico border is showing up in these high daily county cases counts for AZ, CA and TX. The counties in other states within the list also suggest US still has quite a lot COVID-19 transmission. So, suffice it to say, there are many counties in the US with high case counts. And given the mass protests, we believe the potential for new outbreaks is heightened.
Source: COVID-19 tracking project
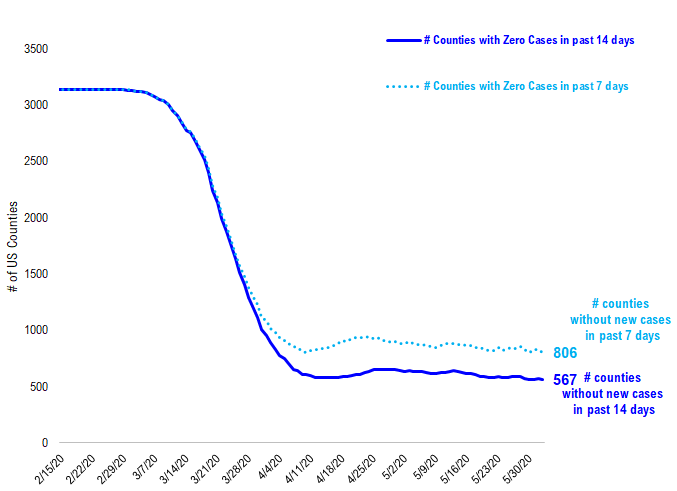
The number of counties with zero cases in past 7D and past 14D is stable and not rising (=bad)…
The number of counties in the US with zero cases in the past 7D and 14D has been static, essentially at 806 and 567, respectively. This means that no additional counties are successfully ridding themselves of confirmed COVID-19 cases. Again, a sign that the US is not making progress eradicating COVID-19. Instead, it has remained at a steady level.
Source: COVID-19 Tracking Project
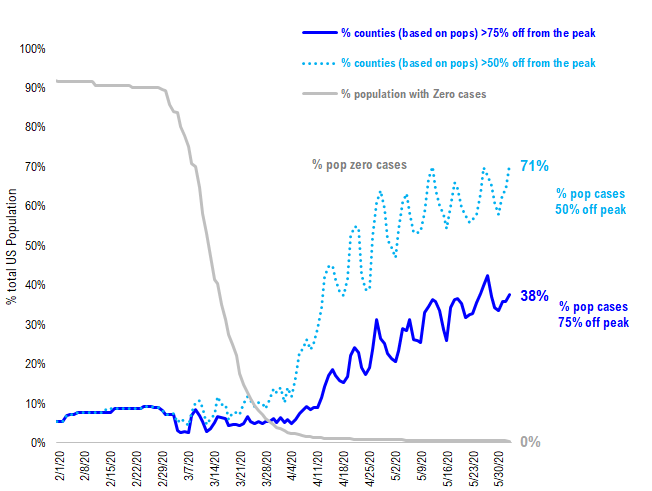
But at least a rising % of counties are seeing cases 50% and 75% off their peaks, so they are moving towards a better level…
But this does not mean counties are not seeing improvements in their overall case counts. The % of counties with cases 50% and 75% off highs is rising to 71% and 38%, respectively.
– and if we eyeball the lines, we can see these are trending higher over time.
POINT #3: Oil consumption rises if people drive more, less public transit, less uber and less flying
A good friend of mine told me that he plans to drive a lot more, using his car for travel to work (previously Uber), drive for his next vacation (not fly) and basically, does not plan to get on mass transit modes of transportation until there is a COVID-19 cure or vaccine. I am sure he is not alone in this thinking. But if enough Americans do this, total oil consumption is going to be far higher post-COVID-19.
In fact, it is astounding that spot WTI oil fell to -$48 per barrel (yes, negative) and has since surged to $38. At the historic negative price, there was a lot of talk about how there was too much oil (yes) and the future outlook for oil demand was dire given the lockdown. But as restrictions are easing, we are getting glimpses of a post-COVID consumer and their travel habits.
Multiple surveys are showing a pretty change. Americans seem to show a preference for using their cars and relying less on public transit and airplanes. For instance, look at the IBM survey results (25,000 consumers), which shows:
– 28% will use public transit less often
– half will use less or stop rideshare apps
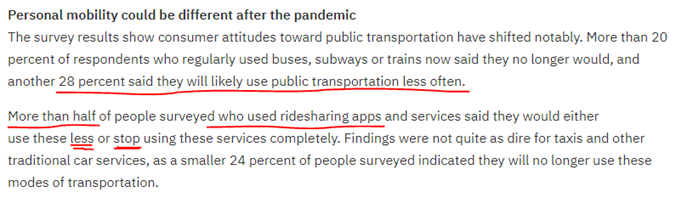
https://newsroom.ibm.com/2020-05-01-IBM-Study-COVID-19-Is-Significantly-Altering-U-S-Consumer-Behavior-and-Plans-Post-Crisis
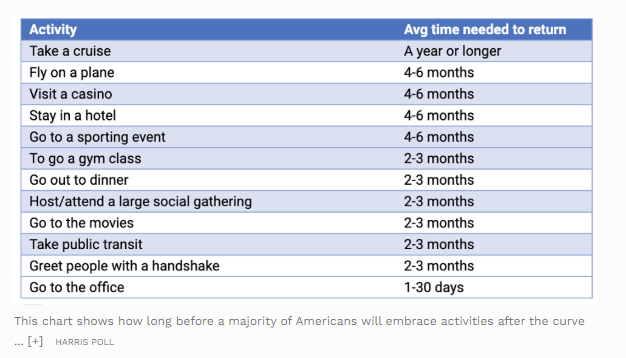
Similarly, a Harris Poll published last week shows Americans are leery of getting on a ship or a plane (see below) and thus, the default way to travel is via a car. Driving a car to vacation, in general, consumes more fuel than equivalent trip flying. There are many variables at work in that calculation including:
– # people
– distance
– type of car (SUV, compact or RV)
– road types
But FAA data shows that aircraft are more efficient in fossil fuels consumed per mile travels (see green line) and vastly improved in the last 30 years. Rail is still the most efficient, but often slower than driving and much slower than flying. But in the past 15 years, traveling via airplane consumes less fuel per mile traveled.
– in other words, all things being equal, if Americans drive more (to the same destination), total fuel consumption rises.
– factor in less public transit and less rideshare, and you can see “per capita” gasoline consumption is higher.
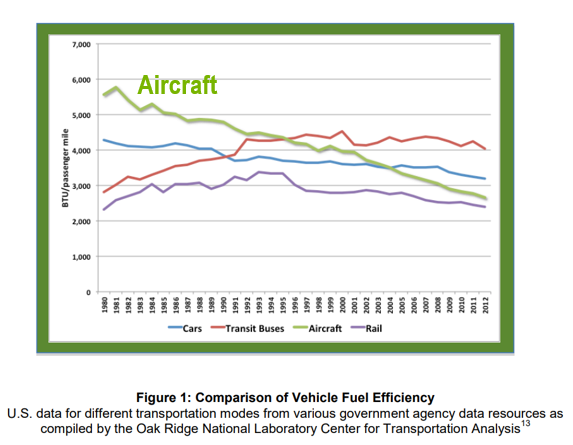
https://www.faa.gov/regulations_policies/policy_guidance/
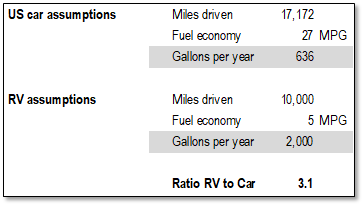
FYI, RVs are particularly fuel-inefficient. The typical RV gets about 5 miles per gallon and that means a single RV consumer about 5X as much fuel as a typical passenger car. And this could drastically increase per capital fuel consumption.
Source: Fundstrat
Driving also emits more CO2, so it is less environmentally friendly.
I decided to see the carbon emissions difference between a road trip to Orlando (typical Summer vacation) compared to taking a flight. I used the website called “mapmyemissions” and it is pretty limited in the variables. For instance, there is 2.0L engines or above, but as we all know, a 2.0 liter is a fuel-efficient engine. American cars with 4 or 5 liters, or an SUV, is guzzling gas. And there is no assumption for weight or passengers.
– But a drive to Orlando is 1,112 lbs. of CO2.
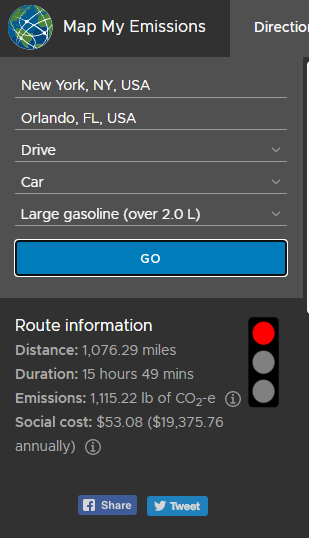
https://mapmyemissions.com/home
Using a website called atmosfair, we can see how much CO2 is emitted by an equivalent flight. This says a flight emits 429kg (945 lbs.) or CO2. Thus, a one-person comparison suggests flying is about 20% less carbon emissions. This is not a great comparison, but you get the picture.
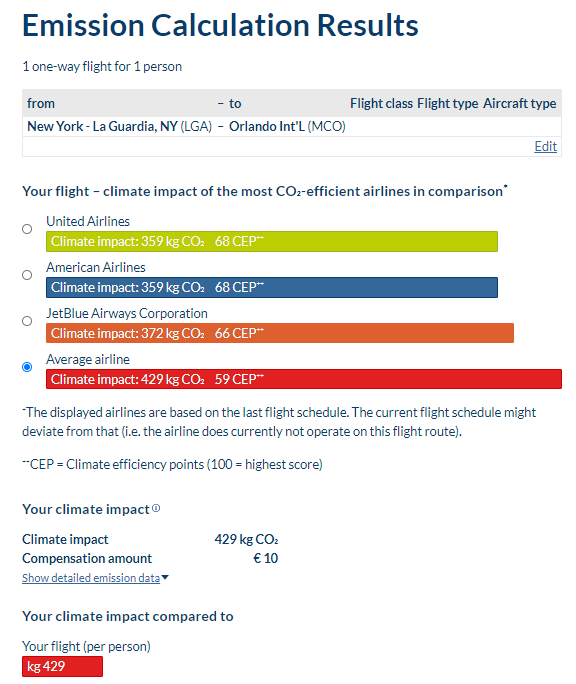
https://www.atmosfair.de/en/offset/flight


