


SUMMARY
- If domestic GDP growth and PMIs are set to sequentially decelerate, should I be moving towards defensive areas at this time?
- Now that we are near mid-year, can you provide an update of your year-end S&P 500 targets for both OEPS and index price level?
- What are your aggressive tactical indicators signaling now?
- Any stocks jump out at you based on your single stock quantitative selection model?
The U.S. equity markets continue to remain near all-time highs, but little progress has been made since the S&P 500 first moved to about 4200 on 4/28/21. Since there has been a dearth of company-specific earnings news the last couple of weeks, investors have had to rely on macro data releases and the headline story of the day. The economic data has shown the domestic economy is growing but the evidence has left many traders and forecasters conflicted about how strong things are and if inflation is beginning a 1980s surge higher or about to start moderating in the coming months. Additionally, COVID appears to be fading finally, but it has not totally disappeared as of yet. The mix of all these factors has left investors searching for a catalyst for the next big move in the S&P 500.
The start of the 2Q21 earnings season is not set to commence until the middle of July so be prepared for market action to continue to be dominated by macro related factors. First, there will be the CPI data release on Thursday 6/10 and a packed morning on 6/15, when both the Retail Sales and PPI data releases are announced. On Wednesday 6/16, the FOMC will be concluding its two-day meeting and release its latest monetary policy decision and forward guidance. And lest not forget the quad witching on Friday 6/18, which refers to a date on which stock index futures, stock index options, stock options, and single stock futures expire simultaneously. Phew, there is a lot of “noise” that will likely hit the tape over the next couple of weeks. Hence, it might be a struggle for the S&P 500 to make a big move to the upside until we get through all of these.
This type of market action is not surprising to me as I have been regularly warning for the past couple of months that the U.S. equity markets could experience short bouts of selling pressure as a result of headline macro news. Notably, though, I have also suggested that any weakness should be viewed opportunistically as my proprietary investment process is still flashing a constructive environment for equities. Indeed, my most vital factors clearly show that they remain favorable for my longstanding investment themes. Consequently, I reiterate my bullish overall equity market outlook and based on my proprietary research will keep viewing price moves that are divergent to my medium-term expectations as chances to take advantage of the tactical price action.
During times when markets churn, get confusing, or seem challenging, investors easily can get distracted. Headline news and tactical market price action can sway investors to make sub-optimal decisions. Importantly, however, if one has a disciplined investment process, it can be critical in keeping an investor’s emotions in check and to keep focused. My colleagues and I here at FSI have spent over two decades developing objective tools to help investors identify rewarding investment opportunities, especially when the equity environment becomes more difficult. We use analytical techniques that are based on data-driven approaches as the foundation for our research and idea generation to help our subscribers stay grounded and properly positioned to take advantage of the dominant trend.
ISSUES
- The most asked about topic this past week — What to buy with new money?
- Interactions still have a large macro component, but I get the sense that investors have shifted from getting more worried about the big picture to how one should navigate markets.
- With investors moving away from the elevated macro worry levels from a few weeks ago, they are trying to get a handle on how long the overall market and Cyclicals/Value can stay favorable.
- Valuation concerns seemed to be voiced more often than the past month, but I did speak with more Value managers during the week.
- Sectors where there was the most interest this past week were Industrials, Materials, Consumer Discretionary, Technology, and Energy. Real Estate had some interest, but Utilities, and legacy Telecom had zero.
QUESTION AND ANSWERS
If domestic GDP growth and PMIs are set to sequentially decelerate, should I be moving towards defensive areas at this time?
NO. In my 5/25/21 Whispers, I made the following comments:
The outperformance of Real Estate, Health Care, and Utilities and the underperformance of Energy, Industrials, and Materials are all NOT supported by my main sector tool, 8-panel analysis, which normally has a strategic focus looking out 9-18 months.
Well, over the past two weeks, the cyclical/value sectors mentioned have performed much better while the defensive areas have lagged badly, with Real Estate being the lone exception.
My proprietary 8-panel analysis suggests that there is still enough runway for Cyclicals/Value versus defense for nearly all investors, traders and strategic, to still have overweight positions relative to the defensive groups.
If you’re unfamiliar with my unique data driven research process, I am including my Intro to Methodology link below.
Fundstrat Global Advisors: Global Portfolio Strategy — Intro to Methodology
Bottom line: My work strongly suggests that investors use any defensive leadership as relative rallies to sell rather than selling strength in the offensive sectors that my work still fully supports.
Now that we are near mid-year, can you provide an update of your year-end S&P 500 targets for both OEPS and index price level?
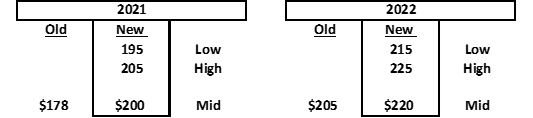
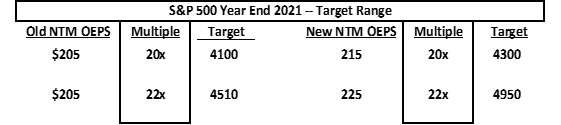
I have raised both my 2021 year-end S&P 500 OEPS and index price targets. During my May 26th 2H21 Outlook Webinar (see replay information below), I announced the following changes.
S&P 500 OEPS for 2021 goes from $178 to $200 and 2022 goes from $205 to $220 (see table).
S&P 500 2021 year-end price zone rises from 4100-4510 to 4300-4950 (see table).
Bottom line: Our work supports continued upside for both corporate profits and higher levels for the S&P 500.
The replay can be accessed here, and the slide deck from the presentation here.
What are your aggressive tactical indicators signaling now?
Bullish. My key aggressive tactical indicators — HALO-2, and V-squared (see explanations at the end of the note) — have remained favorable and not extreme since their last favorable signals that were flashed on March 19th. With that being said, our other important tool HALO, which is tactical but not as aggressive as HALO-2, has also moved back to positive. Thus, all of these key factors are portending additional tactical upside for the S&P 500.
Bottom line: All of my aggressive tactical indicators suggest that investors should still be looking for further equity gains.
Any stocks jump out at you based on your single stock quantitative selection model?
Although my work has lots of names that are favorable, I was asked this week more than usual for just a smaller handful of ideas that have a positive earnings revisions setup and have been acting reasonably well based on my preferred metrics.
The names I mentioned the most were: NVDA -0.36% , LYV -0.15% , PLD 0.76% , AXP -2.33% , BKNG 0.33% , GS 0.34%
Bottom line: My research continues to be constructive for equities and is signaling additional upside for the S&P 500. Additionally, my key recommended portfolio themes — Value/Cyclicals over Growth/FAANG, and SMid over Large— and preferred sector positions — Financials, Industrials, and Materials as Full Above Benchmark and HC, Staples, Utilities, and Real Estate as Full Below Benchmark — all remain intact.
Moreover, I continue to reiterate that there remains a high likelihood that there will periods of volatility and headline risk in the weeks and months to come. Hence, if/when this happens, my work strongly suggests that investors use relative weakness in the sectors/stocks that my work continues to identify as favorable and stay away from the ideas that have unfavorable indicators. This has been my enduring strategy since my analysis continues to portend that investors STAY THE COURSE. So, it is my forecast that the U.S. equity market will keep climbing the “Wall of Worry” even though there are still elevated levels of unease among institutional investors.
Also, I continue to expect that as each day passes the domestic economy will take another important step towards returning to pre-COVID levels. Unquestionably, this decisive shift towards recovery is a key assumption underpinning my view that as the signs of normalization increase the tailwinds for equity market rally should remain robust. I am still recommending investors stay disciplined and focused on the bigger picture and not the day-to-day market action so one can keep benefiting from the favorable backdrop for equities.
Definitions of HALO, HALO-2, and V-squared
HALO = The proprietary Fundstrat Portfolio Strategy Halo Model is a multi-factor model that attempts to predict the forward 1 – 6 month relative performance of a group. The goal is to help both strategic accounts better time their implementation strategies that would be consistent with our more strategic conclusions derived by our sector/sub-industry 8-panels as well as our stock specific Estimate Revisions Model (ERM), and to generate tactical ideas for aggressive trading accounts.
HALO-2 = The proprietary Fundstrat Portfolio Strategy HALO-2 Model is the raw tactical data behind our standard HALO multi-factor model described on the previous page. It is useful for identifying aggressive tactical trading bottoms for the S&P 500.
V-squared = The proprietary Fundstrat Portfolio Strategy V-squared indicator at its lowest level shows the ratio of VXV (the 3-month CBOE S&P 500 Volatility Index) and the VIX (the 1-month CBOE S&P 500 Volatility Index). This tool is also useful for identifying aggressive tactical trading bottoms for the S&P 500.


