

The near-term trend for US Equities is bullish, but it’s thought that SPX likely won’t immediately break out to new highs into FOMC, and the pattern for the first couple of weeks of December could prove far choppier than the last part of December. Chances for a December rate cut have now risen to near 100% certainty as per Fed Fund futures pricing data, but many U.S. stock sectors still require some improvement before one can call for a broad-based rally to have gotten underway. The US Dollar has begun to turn lower in the last week, and it’s thought that both US Treasury yields and the US Dollar should begin to weaken with greater velocity post this month’s Fed meeting. Overall, given the market’s snapback from late November, technicals have improved to match some of the bullish seasonality thought possible for this month. Moreover, the comeback in Technology looks important and positive in the short run, and similar to Tuesday’s trading, should be able to help support markets despite some lackluster performance in other sectors. Bottom line, trends are bullish, but technicals support further choppiness until post-FOMC.
Tuesday’s outperformance in Technology was similar to price action between July and November as breadth proved muted, while more volume flowed into Declining than Advancing issues on the NYSE.
However, the comeback in Technology in recent days is certainly a positive, technically speaking, and should be able to help US Stock indices hold up until more confidence of global central bank actions are known in the weeks ahead.
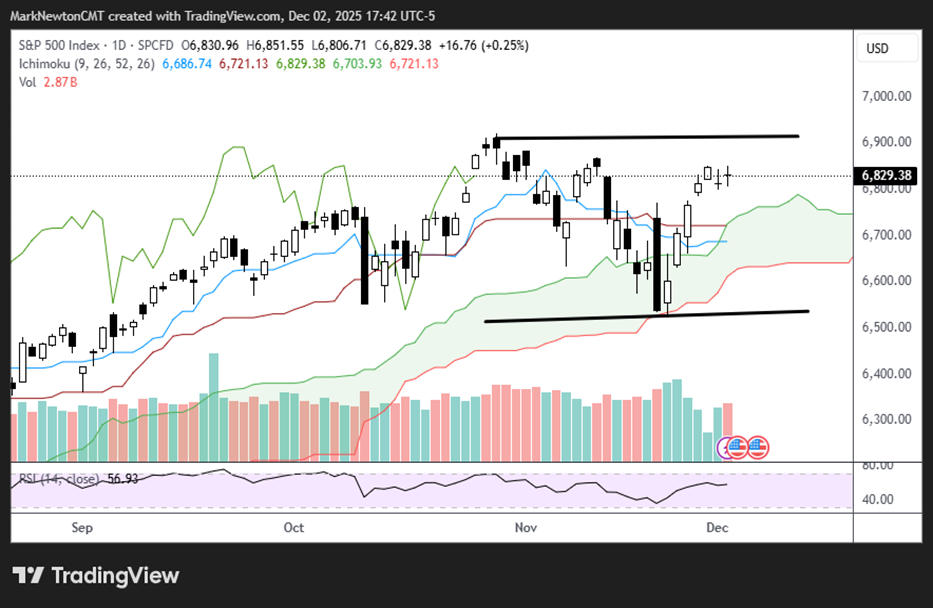
As the daily ^SPX chart shows below, prices have stalled a bit following the five sharp days of rally since late November. Near-term momentum is positive, though trends from early November remain mixed.
I suspect that a push up to near 6900-20 could be possible this week. However, I’m not expecting an immediate breakout, given that many parts of the market have not yet shown a similar breakout to Technology.
In the days to come, resistance lies at 6920 while support is found near 6680-5.
S&P 500 Index
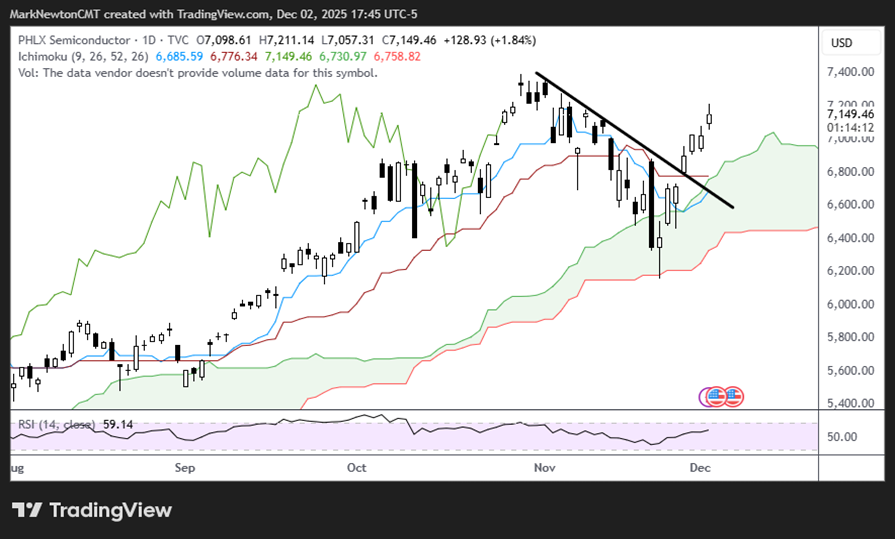
Semiconductor strength has helped US stock indices over the last week, despite NVDA 0.77% underperformance
This past week’s minor SOX (Philadelphia Semiconductor index) breakout of the downtrend from late October has served to help Technology and US stock indices, despite NVDA 0.77% not showing much strength.
Indeed, over the last five trading days, stocks like INTC 8.49% AMAT 4.15% TER 5.56% , CRDO 9.45% , and ADI 2.42% have all risen more than 14%. Meanwhile, NVDA 0.77% has been lower by 0.69% over this same period.
Overall, this is a net positive for the stock market, and resistance lies near 7400. However, until NVDA 0.77% can exceed $188, this remains within short-term consolidation and, similar to US Stock indices, it still looks a bit premature to weigh in on an immediate breakout. Cycles do show NVDA 0.77% likely beginning a push higher from late December into early February, and I’ll discuss this more when more proof is available.
PHLX Semiconductor
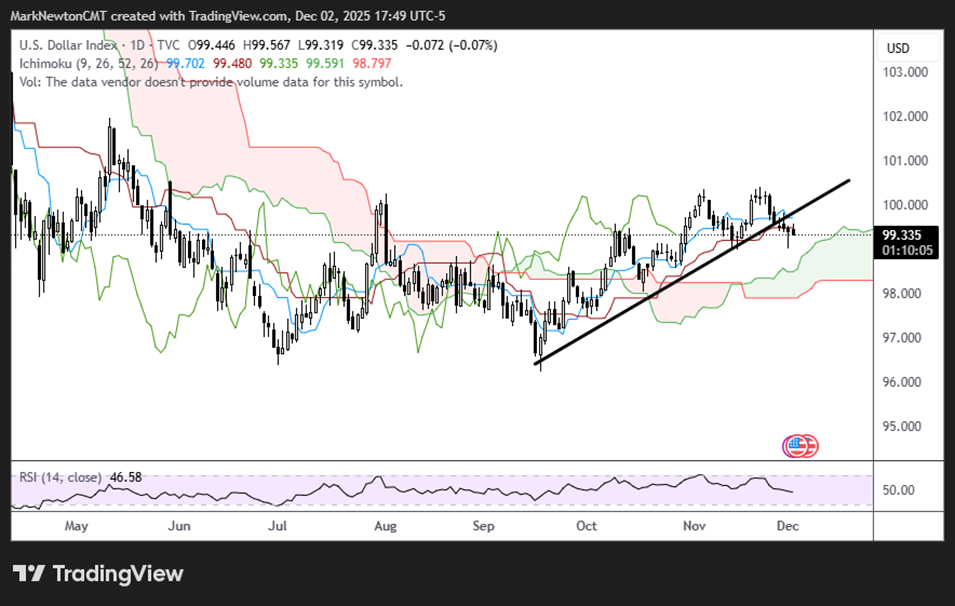
US Dollar index has taken the lead in turning lower, and Treasury yields should eventually follow suit
This week’s downturn in the US Dollar has broken uptrends and likely results in a strong decline into early next year before some stabilization.
The BOJ’s hawkish stance is partly responsible for providing some fuel to the Japanese Yen vs. the US Dollar, but this also fits in with seasonal trends for DXY (US Dollar index). However, as Kevin Hassett has grown in popularity with betting markets for being a front-runner for the Administration’s FOMC pick to replace Chair Powell, this has also served to add “fuel to the fire” for US Dollar weakness.
Seasonality trends favor further weakness, as December has been the US Dollar’s worst-performing month over the last decade, and it’s shown declines in 8 of the last 10 years by more than 1%.
The US Dollar has also traded to unusually expensive levels compared to Rate differential spreads, and it’s thought that once FOMC and BOJ meetings have taken place, a pullback to challenge and break the September lows at 96.21 should get underway.
Initially, DXY might trade down to 98.75-99 before attempting a brief bounce. Thereafter, a steep decline should get underway into early next year.
U.S. Dollar Index
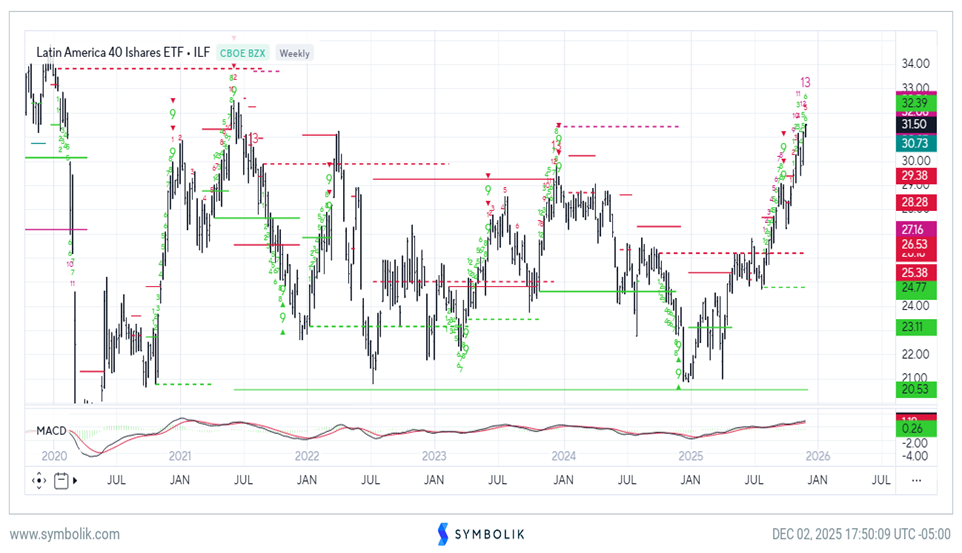
ILF breakout extending, but likely faces strong resistance into the Year-end
Given the Dollar’s decline, it’s advantageous to give Emerging markets a close look, which had stalled out a bit, similar to Domestic Equity indices, since late November.
The Latin America 40 index (ILF 1.65% ), however, has just exceeded mid-November peaks at $31.23, and continues to look quite positive in the short run. I had addressed ILF 1.65% a few weeks ago, but today’s breakout helps to add more conviction to the near-term bullishness in ILF 1.65% .
Tuesday’s move is bullish and should help ILF 1.65% extend to challenge 2021 peaks near $32.52, with long-term Fibonacci resistance (38.2%) directly above near $33.25.
Overall, I suspect another 3-4 weeks of possible ILF strength before this begins to slow in early 2026.
For now, the Lat-am Equity space looks more attractive than China, India, and many other liquid emerging markets. It’s still right to favor ILF 1.65% gains
Latin America 40 Ishares ETF – ILF
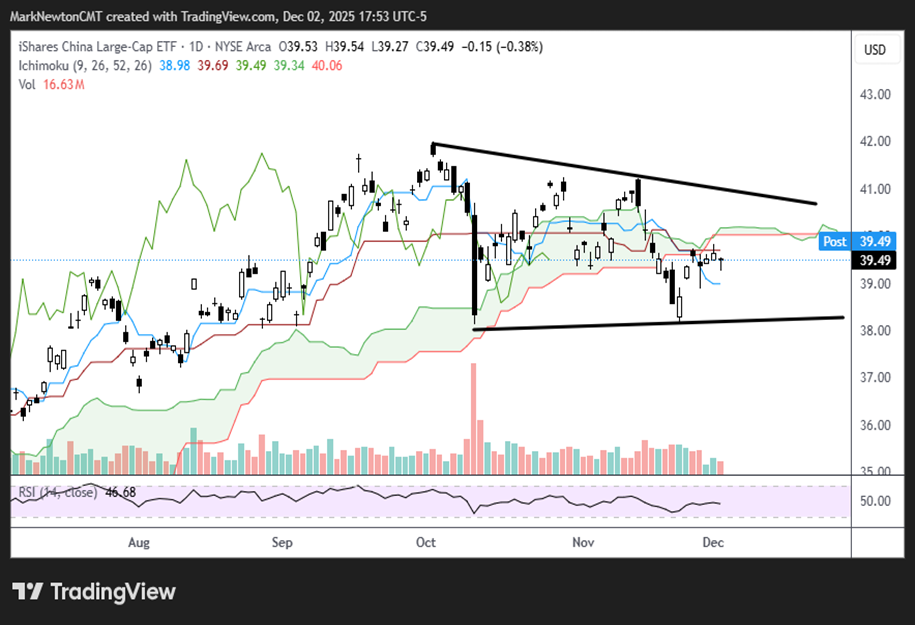
China and India are still range-bound near term and more is needed to expect immediate upside acceleration
As seen below, China is nowhere near as strong in the short run as ILF. This pattern remains technically neutral, and until the upper edge of this triangle resistance is exceeded, it’s right to be patient with China.
At present, this range spans between resistance at $41 and support just above $38. Until broken ( I expect an eventual upside breakout), this trend remains neutral in the short run, not bullish nor bearish.
iShares China Large-Cap ETF
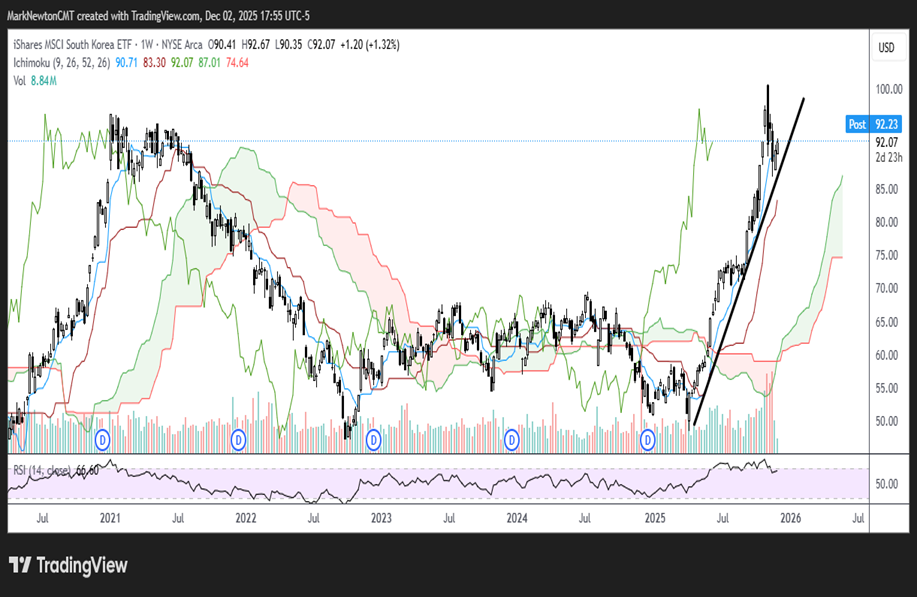
South Korea’s EWY is still quite strong but very overbought; Near-term option for outperformance into year-end
EWY 1.60% (IShares MSCI South Korea ETF) looks like a more attractive near-term investment opportunity than China’s FXI ETF, technically.
The minor consolidation from early November looks complete, and a push back to 101 looks likely over the next month.
However, on a larger scale, the trend in EWY has become quite overbought in recent months. Furthermore, volume spiked sharply on the declines in late October to levels much higher than what was seen during the run-up in price from this past Spring.
As daily charts show below, EWY 1.60% found resistance right near the 2021 peaks before starting to show consolidation in the last month.
Overall, I favor EWY 1.60% ’s strength in the short-term only (Meaning 3-5 weeks). Thereafter, I feel it’s worth keeping a close eye on EWY 1.60% given the overbought nature of its recent run-up. (Monthly RSI remains at 69, but has waned a bit given the early November consolidation.)
iShares MSCI South Korea ETF